Synthesis, spectroscopic, dielectric, molecular docking and DFT studies of (3E)-3-(4-methylbenzylidene)-3,4-dihydro2H-chromen-2-one: An anticancer agent
Bạn đang xem bản rút gọn của tài liệu. Xem và tải ngay bản đầy đủ của tài liệu tại đây (2.24 MB, 19 trang )
Beena et al. Chemistry Central Journal (2017) 11:6
DOI 10.1186/s13065-016-0230-8
RESEARCH ARTICLE
Open Access
Synthesis, spectroscopic, dielectric,
molecular docking and DFT studies
of (3E)‑3‑(4‑methylbenzylidene)‑3,4‑dihydro‑
2H‑chromen‑2‑one: an anticancer agent
T. Beena1, L. Sudha1, A. Nataraj1, V. Balachandran2, D. Kannan3 and M. N. Ponnuswamy4*
Abstract
Background: Coumarin (2H-chromen-2-one) and its derivatives have a wide range of biological and pharmaceutical
activities. They possess antitumor, anti-HIV, anticoagulant, antimicrobial, antioxidant, and anti-inflammatory activities.
Synthesis and isolation of coumarins from different species have attracted the attention of medicinal chemists. Herein,
we report the synthesis, molecular structure, dielectric, anticancer activity and docking studies with the potential
target protein tankyrase.
Results: Molecular structure of (3E)-3-(4-methylbenzylidene)-3,4-dihydro-2H-chromen-2-one (MBDC) is derived from
quantum chemical calculations and compared with the experimental results. Intramolecular interactions, stabilization energies, and charge delocalization are calculated by NBO analysis. NLO property and dielectric quantities have
also been determined. It indicates the formation of a hydrogen bonding between –OH group of alcohol and C=O of
coumarin. The relaxation time increases with the increase of bond length confirming the degree of cooperation and
depends upon the shape and size of the molecules. The molecule under study has shown good anticancer activity
against MCF-7 and HT-29 cell lines. Molecular docking studies indicate that the MBDC binds with protein.
Conclusions: In this study, the compound (3E)-3-(4-methylbenzylidene)-3,4-dihydro-2H-chromen-2-one was synthesized and characterized by spectroscopic studies. The computed and experimental results of NMR study are tabulated.
The dielectric relaxation studies show the existence of molecular interactions between MBDC and alcohol. Theoretical
results of MBDC molecules provide the way to predict various binding sites through molecular modeling and these
results also support that the chromen substitution is more active in the entire molecule. Molecular docking study
shows that MBDC binds well in the active site of tankyrase and interact with the amino acid residues. These results
are compared with the anti cancer drug molecule warfarin derivative. The results suggest that both molecules have
comparable interactions and better docking scores. The results of the antiproliferative activity of MBDC and Warfarin
derivative against MCF-7 breast cancer and HT-29 colon cancer cell lines at different concentrations exhibited significant cytotoxicity. The estimated half maximal inhibitory concentration (IC 50) value for MBDC and Warfarin derivative
was 15.6 and 31.2 μg/ml, respectively. This enhanced cytotoxicity of MBDC in MCF-7 breast cancer and HT-29 colon
cancer cell lines may be due to their efficient targeted binding and eventual uptake by the cells. Hence the compound MBDC may be considered as a drug molecule for cancer.
Keywords: Chromen, DFT, Dielectric studies, Molecular docking, Anti-cancer activity
*Correspondence:
4
CAS in Crystallography & Biophysics, University of Madras, Guindy
Campus, Chennai 600025, India
Full list of author information is available at the end of the article
© The Author(s) 2017. This article is distributed under the terms of the Creative Commons Attribution 4.0 International License
( which permits unrestricted use, distribution, and reproduction in any medium,
provided you give appropriate credit to the original author(s) and the source, provide a link to the Creative Commons license,
and indicate if changes were made. The Creative Commons Public Domain Dedication waiver ( />publicdomain/zero/1.0/) applies to the data made available in this article, unless otherwise stated.
Beena et al. Chemistry Central Journal (2017) 11:6
Page 2 of 19
Background
Coumarin (2H-chromen-2-one) is one of the important
secondary metabolic derivatives which occurs naturally
in several plant families. Coumarins are used as a fragrance in food and cosmetic products. Coumarins are
widely distributed in the plant kingdom and are present
in notable amounts in several species, such as Umbelliferae, Rutaceae and Compositae.
Coumarin and its derivatives have a wide range of biological and pharmaceutical activities. They possess antitumor [1], anti-HIV [2], anticoagulant [3], antimicrobial
[4], antioxidant [5] and anti-inflammatory [6] activities.
The antitumor activities of coumarin compounds have
been extensively examined [7]. Synthesis and isolation of
coumarins and its derivatives from different species have
attracted the attention of medicinal chemists. The spectroscopic studies led to the beneficial effects on human
health and their vibrational characteristics [8, 9].
Herein, we report the synthesis, the computed electronic structure and their properties in comparison with
experimental FT-IR, FT Raman, UV and NMR spectra.
Further, intra and inter molecular interactions, HOMO–
LUMO energies, dipole moment and NLO property
have been determined. The dielectric studies confirm
the molecular interactions and the strength of hydrogen
bonding between the molecule and the solvent ethanol. In addition, anti-cancer activity against MCF-7 and
HT-29 cell lines and molecular docking studies have also
been performed.
gel (100–200) mesh, using ethyl acetate and hexane (1:9)
as solvents. The pure form of the title compound was
obtained as a colorless solid (0.162 g). Yield: 65%, melting
point: 132–134 °C.
Experimental
Preparation of MBDC
MEM was purchased from Hi Media Laboratories, Fetal
Bovine Serum (FBS) was purchased from Cistron laboratories trypsin, methylthiazolyl diphenyl-tetrazolium
bromide (MTT) and dimethyl sulfoxide (DMSO) were
purchased from (Sisco Research Laboratory Chemicals, Mumbai). All of other chemicals and reagents were
obtained from Sigma Aldrich, Mumbai.
MBDC was synthesised from the mixture of methyl
2-[hydroxy(4-methylphenyl)methyl]prop-2-enoate
(0.206 g, 1 mmol) and phenol (0.094 g, 1 mmol) in
CH2Cl2 solvent and allowed to cool at 0 °C. To this solution, concentrated H2SO4 (0.098 g, 1 mmol) was added
and stirred well at room temperature (Scheme 1). After
completion of the reaction as indicated by TLC, the reaction mixture was neutralized with 1 M NaHCO3 and then
extracted with CH2Cl2. The combined organic layers were
washed with brine (2 × 10 ml) and dried over anhydrous
sodium sulfate. The organic layer was evaporated and the
residue was purified by column chromatography on silica
OH O
OH
OCH3
H3C
Instrumentation
FTIR, FT-Raman, UV–Vis and NMR spectra were
recorded using Bruker IFS 66 V spectrometer, FRA 106
Raman module equipped with Nd:YAG laser source,
Beckman DU640 UV/Vis spectrophotometer and Bruker
Bio Spin NMR spectrometer with CDCl3 as solvent,
respectively. The dielectric constant (ε′) and dielectric loss
(ε″) at microwave frequency were determined by X-Band
microwave bench and the dielectric constant (ε∞) at optical frequency was determined by Abbe’s refractometer
equipped by M/s. Vidyut Yantra, India. The static dielectric constant (ε0) was measured by LCR meter supplied
by M/s. Wissenschaijftlich Technische, Werkstatter, Germany. Anticancer activity for two cell lines was obtained
from National Centre for Cell Sciences, Pune (NCCS).
Cell line and culture
MCF-7 and HT-29 cell lines were obtained from National
Centre for Cell Sciences, Pune (NCCS). The cells were
maintained in Minimal Essential Medium supplemented
with 10% FBS, penicillin (100 U/ml), and streptomycin
(100 μg/ml) in a humidified atmosphere of 50 μg/ml CO2
at 37 °C.
Reagents
In vitro assay for anticancer activity (MTT assay)
Cells (1 × 10⁵/well) were plated in 24-well plates and
incubated at 37 °C with 5% CO2 condition. After the cell
reaches the confluence, the various concentrations of the
samples were added and incubated for 24 h. After incubation, the sample was removed from the well and washed
O
Con.H2SO4,
DCM, 2 h, 0 °C - rt H3C
Scheme 1 Reaction scheme showing the synthesis of the compound (MBDC)
O
Beena et al. Chemistry Central Journal (2017) 11:6
with phosphate-buffered saline (pH 7.4) or MEM without
serum. 100 µl/well (5 mg/ml) of 0.5% 3-(4,5-dimethyl2-thiazolyl)-2,5-diphenyl-tetrazolium bromide (MTT)
was added and incubated for 4 h. After incubation, 1 ml
of DMSO was added in all the wells. The absorbance at
570 nm was measured with UV-Spectrophotometer
using DMSO as the blank. The %cell viability was calculated using the following formula:
%cell viability =
A570 of treated cells
× 100
A570 of control cells
Computational methods
Electronic structure and optimized geometrical parameters were calculated by density functional theory
(DFT) using Gaussian 09W software package [10] with
B3LYP/6-31 + G(d,p) basis set method and Gauss-View
molecular visualization program package on a personal
computer [11]. Vibrational normal mode wavenumbers of
MBDC were derived with IR intensity and Raman intensity. The entire vibrational assignments were executed
on the basis of the potential energy distribution (PED) of
vibrational modes from VEDA 4 program and calculated
with scaled quantum mechanical (SQM) method. The
X-ray crystal structure of tankyrase (PDB ID: 4L2K) [12]
was obtained from Protein Data Bank (PDB). All docking
calculations were performed using induced-fit-docking
module of Schrödinger suite [13].
Results and discussion
Molecular geometry
The optimized molecular structure of MBDC along with
the numbering of atoms is shown in Fig. 1. The calculated
Fig. 1 Optimized molecular structure and atomic numbering of MBDC
Page 3 of 19
and experimental bond lengths and bond angles are presented in Table 1. The molecular structure of the compound is obtained from Gaussian 09W and GAUSSVIEW
program. The optimized structural parameters (bond
lengths and bond angles) calculated by DFT/B3LYP with
6-31 + G(d,p) basis set are compared with experimentally available X-ray data for benzylidene [14] and coumarin [15].
From the structural data, it is observed that the various
C–C bond distances calculated between the rings 1 and
2 and C–H bond lengths are comparable with that of the
experimental values of benzylidene and coumarins. The
influence of substituent groups on C–C bond distances
of ring carbon atoms seems to be negligibly small except
that of C3–C4 (1.404 Å) bond length which is slightly
longer than the normal value.
The calculated bond lengths of C8–C13 and C4–
C20, are 1.491 and 1.509 Å in the present molecule and
comparable with the experimental values of 1.491 and
1.499 Å. The experimental value for the bond C13–O7
(1.261 Å) is little longer than the calculated value 1.211 Å.
The C–H bond length variations are due to the different
substituent’s in the ring and other atoms [16]. The hyperconjugative interaction effect leads to the deviation of
bond angle for C10–C11–O12 (121.79°) from the standard value (120.8°).
Vibrational spectra
The title compound possesses Cs point group symmetry and the available 93 normal modes of vibrations are
distributed into two types, namely A′ (in-plane) and A″
(out-plane). The irreducible representation for the Cs
Beena et al. Chemistry Central Journal (2017) 11:6
Page 4 of 19
Table
1 Optimized geometrical parameters of (3E)-3(4-methylbenzylidene)-3,4-dihydro-2H-chromen-2-one
at B3LYP/6-31 + G(d,p) level of theory
Bond
length
Value (Å) Expt.a
Bond
angle
Value (°) Expt.a
C1–C2
1.411
1.407 (15) C2–C1–C6
117.36
118.8 (14)
C1–C6
1.408
C6–C1–C7
124.68
124.0 (15)
C1–C7
1.464
1.456 (14) C1–C2–H31 121.38
120.2 (15)
C2–C3
1.390
1.378 (14) C3–C2–H18 119.56
119.0 (14)
C2–H18
1.086
0.950 (15) C2–C3–C4
121.06
121.5 (15)
C3–C4
1.404
1.378 (14) C3–C4–C5
117.74
117.3 (15)
C3–H19
1.087
0.990 (15) C3–C4–C20 120.92
120.3 (15)
C4–C5
1.401
1.403 (15) C5–C6–H25 118.79
119.8 (15)
131.9 (14)
C4–C20
1.509
1.499 (14) C1–C7–C8
C5–C6
1.394
1.389 (14) C8–C7–H26 114.99
130.11
0.990 (15) C7–C8–C13 115.44
C5–H24
1.087
C6–H25
1.083
C7–C8
1.355
C8–C9–C10 112.38
C7–H26
1.088
0.950 (15) C8–C9–H28 109.63
C8–C9
1.511
C8–C13
1.491
1.491 (14) H28–C9–
H29
106.06
C9–C10
1.509
C9–C10–
C11
119.35
C9–H28
1.102
C9–C10–
C14
122.68
C10–C11
1.394
C8–C13–
O27
125.15
C10–C14
1.400
C10–C14–
H30
118.76
C11–O12
1.387
O12–C11–
C17
116.22
116.6 (15)
118.96 (14)
C7–C8–C9
126.11
116.8 (14)
125.5 (14)
C8–C9–H29 108.74
C11–C17
1.395
C9–C8–C13 118.44
O12–C13
1.376
C11–C10–
C14
107.2 (15)
C13=O27
1.211
1.087
C1–C6–C5
C15–C16
1.399
C1–C6–H25 120.23
1.261 (15) C1–C7–H26 114.86
C17–H33
1.084
120.92
120.7 (14)
C2–C3–H19 119.40
119.8 (15)
C10–C11–
O12
120.8 (15)
121.79
The C–H stretching vibrations are expected to appear
at 3100−2900 cm−1 [17] with multiple weak bands. The
four hydrogen atoms left around each benzene ring give
rise to a couple of C–H stretching, C–H in-plane bending
and C–H out-of-plane bending vibrations. In MBDC, the
calculated wavenumbers at 2936, 2945, 2962, 2989, 2993,
2999, 3007, 3018 and 3101 cm−1 are assigned to C–H
stretching modes which show good agreement with the
literature values [18]. The C–H in-plane bending vibrations occur in the region of 1390–990 cm−1. The vibrational assignments at 900, 990 and 1000 cm−1 (Fig. 3)
occur due to the effect of C–H in-plane bending vibrations. The calculated wavenumbers at 889, 903, 923, 951,
968, 992, 1011, 1029 and 1042 cm−1 are due to C–H inplane bending vibrations which show good agreement
with recorded spectral values.
The out-of-plane bending of ring C–H bonds occur
below 900 cm−1 [19]. In MBDC, the C–H out-of-plane
bending vibrations are observed at 540, 575, 600 and
725 cm−1 which are compared with the computed values
at 527, 540, 572, 601, 633, 669, 689, 716 and 723 cm−1.
Carbon–carbon vibrations
117.93
C14–H30
Carbon–hydrogen vibrations
a
X-ray data from Refs. [14] and [15]
symmetry is given by ГVib = 63 A′ + 30 A″. All the vibrations are active in both IR and Raman spectra. Vibrational assignments have been carried out from FT-IR
(Fig. 2) and FT-Raman (Fig. 3) spectra. The theoretically
predicted wavenumbers along with their PED values are
presented in Table 2. The fundamental vibrational modes
are also characterized by their PED. The calculated
wavenumbers are in good agreement with experimental
wavenumbers.
The ring C=C and C–C stretching vibrations, known as
semicircle stretching modes, usually occur in the region
of 1625–1400 cm−1 [20]. Generally, these bands are of
variable intensity and observed at 1625–1590 cm−1, 1590–
1575 cm−1, 1540–1470 cm−1, 1465–1430 cm−1 and 1380–
1280 cm−1 [21]. In MBDC, the aromatic C–C stretching
vibrations are observed at 1209 cm−1 (Fig. 2). The C–C
stretching vibrations are assigned at 1432 and 1500 cm−1
in FT-IR and at 1540 and 1600 cm−1 in FT-Raman spectrum. These values perfectly match with the calculated
wavenumbers, 1306–1615 cm−1 (mode no. 64–78). The
C–C–C in-plane bending vibrations are observed at
810 cm−1 in FT-IR spectrum and at 850 and 875 cm−1
in FT-Raman spectrum. The calculated values are 811–
872 cm−1 (mode no: 33–40). The C–C–C out-of-plane
bending vibrations appeared at 350 and 400 cm−1 in FTRaman spectrum and the corresponding calculated wavenumbers at 255–453 cm−1 (mode no: 11–18) show good
agreement with the literature values [16]. These observed
wavenumbers show that the substitutions in the benzene
ring affect the ring modes of vibrations to a certain extent.
C–O vibrations
The C–O stretching vibrations are observed at 1300–
1200 cm−1 [22]. In the present molecule, the C–O
stretching is observed at 1189 cm−1 in FT-IR spectrum
and the calculated vibration is at 1153 and 1190 cm−1.
The C–O in-plane bending vibration is observed at
Beena et al. Chemistry Central Journal (2017) 11:6
Page 5 of 19
Fig. 2 a Experimental and b predicted FT-IR spectra of MBDC
750 cm−1 in FT-IR matches with the theoretical value
of 748 cm−1. In this molecule, the peak observed at
500 cm−1 in FT-Raman and 506 cm−1 in FT-IR are
attributed to C–O out-of-plane bending vibrations.
The C=O stretching vibration is generally observed at
1800–1600 cm−1 [23]. In MBDC, the C=O stretching is
observed at 1616 cm−1 in FT-IR and at 1690 cm−1 in FTRaman spectrum. This peak matches with the calculated
value (1692 cm−1).
1243 cm−1. In FT-IR spectrum the symmetric bending vibration is observed at 1215 cm−1 and calculated
at 1231 cm−1. The in-plane CH2 bending vibration is
observed at 1000 cm−1 in FT-Raman spectrum and the
calculated vibration is at 1053 cm−1. The out-of-plane
CH2 bending vibration is calculated at 1061 cm−1. The
above results suggest that the observed frequencies are
in good agreement with calculated in-plane and out-ofplane modes.
CH2 vibrations
CH3 vibrations
The asymmetric CH2 stretching vibrations are generally
observed between 3000 and 2800 cm−1, while the symmetric stretch appears between 2900 and 2800 cm−1 [24].
In MBDC, the CH2 asymmetric and symmetric stretching vibrations are calculated at 2809 and 2801 cm−1
respectively. The asymmetric bending is calculated at
There are nine fundamental modes associated with each
CH3 group. In aromatic compounds, the CH3 asymmetric and symmetric stretching vibrations are expected
in the range of 2925–3000 cm−1 and 2905–2940 cm−1,
respectively [25]. In CH3 antisymmetric stretching mode,
two C–H bonds are expanding while the third one is
Beena et al. Chemistry Central Journal (2017) 11:6
Page 6 of 19
Fig. 3 a Experimental and b predicted FT-Raman spectra of MBDC
contracting. In symmetric stretching, all the three C–H
bonds are expanding and contracting in-phase. In MBDC,
the assigned vibrations at 2911, 2889 and 2863 cm−1 represent asymmetric and symmetric CH3 stretching vibrations
[26]. The CH3 symmetric bending vibrations are observed
at 1250 cm−1 in FT-Raman spectrum and calculated at
1250 cm−1 which are in good agreement with experimental
and theoretical vibrations. The CH3 asymmetric bending
vibrations are observed at 1261 cm−1 and calculated at 1260
and 1287 cm−1 match with the experimental values. The inplane CH3 bending vibration is assigned at 1075 cm−1 in
FT-Raman and calculated at 1072 cm−1 in B3LYP and outof-plane CH3 bending vibration is observed at 1100 cm−1
in FT-Raman and calculated at 1104 cm−1. Predicted wavenumbers derived from B3LYP/6-31 + G(d,p) method synchronise well with those of the experimental observations.
HOMO–LUMO energy gap of MBDC is shown in Fig. 4.
The HOMO (−51.0539 kcal/mol) is located over the coumarin group and LUMO (−49.0962 kcal/mol) is located
over the ring; the HOMO→LUMO transition implies
the electron density transfer to ring benzylidene. The
calculated self-consistent field (SCF) energy of MBDC
is −506,239.7545 kcal/mol. The frontier orbital gap is
found to be E = −101.9576 kcal/mol and this negative
energy gap confirms the intramolecular charge transfer.
This proves the non-linear optical (NLO) activity of the
material [27]. A molecule with a small frontier molecular
orbital is more polarizable and generally associated with
high chemical reactivity, low kinetic stability termed as
soft molecule [28]. The low value of frontier molecular
orbital in MBDC makes it more reactive and less stable.
HOMO–LUMO analysis
Natural bond orbital (NBO) of the molecule explains
the molecular wave function in terms of Lewis structures, charge, bond order, bond type, hybridization, resonance, donor–acceptor interactions, etc. NBO analysis
has been performed on MBDC to elucidate the intramolecular, rehybridization and also the interaction which
The most important orbitals in the molecule is the
frontier molecular orbitals, called highest occupied
molecular orbital (HOMO) and lowest unoccupied
molecular orbital (LUMO). These orbitals determine
the way the molecule interacts with other species. The
NBO analysis
60
4
327
368
350
400
13
14
15
34
851
829
33
810
778
768
31
32
740
737
725
29
30
711
727
27
28
693
26
639
650
600
25
24
582
545
540
575
22
23
540
524
21
490
500
457
18
20
444
17
19
421
16
450
314
12
409
274
189
225
8
9
252
156
7
11
101
6
10
81
61
5
750
43
3
200
36
48
23
30
2
824
811
760
748
735
723
716
689
669
633
601
572
540
527
506
479
453
437
413
400
354
309
286
255
237
202
181
143
96
78
60
42
29
20
Scaled
Unscaled
FTIR
FT Raman
Calculated frequencies
(cm−1)
Observed frequencies
(cm−1)
1
Mode nos
1.26
1.610
4.144
1.335
4.346
5.549
3.876
3.832
5.112
6.834
6.329
6.588
3.662
5.569
2.790
5.515
4.033
4.136
2.977
3.550
3.122
5.288
4.114
4.050
4.366
6.604
3.393
4.419
4.785
6.433
4.037
4.317
1.041
4.139
Reduced mass
(amu)
0.540
0.653
1.481
0.465
1.404
1.776
1.208
1.142
1.447
1.703
1.526
1.319
0.642
0.786
0.452
0.783
0.496
0.482
0.310
0.350
0.249
0.335
0.240
0.179
0.164
0.197
0.072
0.064
0.029
0.025
0.009
0.006
0.001
0.001
Force constant
(mdyn/Å)
0.813
37.872
7.458
62.541
0.599
11.299
9.921
0.262
4.947
0.662
7.519
2.309
4.599
5.539
12.486
24.603
3.817
3.120
1.829
1.104
0.038
1.339
0.632
1.403
1.529
2.382
0.402
1.546
0.456
1.029
0.126
0.138
0.259
0.140
IR intensity
(km/mol)
0.119
0.230
0.587
0.034
0.184
0.128
0.085
0.116
0.007
0.176
0.104
0.138
0.033
0.239
0.794
0.378
0.144
0.773
0.326
0.482
0.119
0.029
0.065
0.314
0.314
0.235
1.098
0.321
0.906
1.382
4.758
4.698
2.839
98.862
Raman intensity
(Å4 amu−1)
βCCC (63), βCH (18), βCH3 (11)
βCCC (63), βCH (21), βCH3 (12)
βCC (58), βCH (21), βCH3 (10)
βC–O (62), βCC (22)
βC–CH3 (60), βCH (23)
γ CH (58), γ CC (18)
γ CH (56), γ CC (18)
γ CH (56), γ CC (16)
γ CH (56), γ CH3 (18), γ CC (12)
γ CH (58), γ CC (18), γ CH2 (11)
γ CH (56), γ CC (20), γ CH3 (10)
γ CH (58), γ CH3 (20), γ CC (11)
γ CH (58), γ CC (21), γ CH2 (11)
γ CH (58), γ CH3 (22), γ CC (10)
γ C–O (64), γ CH3 (23), γ CO (10)
βC=O (58), βCC (22), βCO (10)
γ CCC (63), γ CH (18), γ CH3 (12)
γ CCC (62), γ CH (20), γ CH3 (11)
γ CCC (62), γ CH (20), γ CH3 (10)
γ CCC (62), γ CH (18), γ CH3 (10)
γ CCC (60), γ CH (22), γ CH3 (12)
γ CCC (58), γ CH (18), γ CH3 (11)
γ CCC (59), γ CH (18), γ CH3 (10)
γ CCC (60), γ CH (22), γ CH3 (11)
γ CC (62), γ CH (20), γ CH2 (10)
γ C–CH3 (54), γ CH (18), γ CH3 (12)
τ CH2 (56), γ CH3 (18)
τ CH3 (56)
γ C=O (58), τ CH3 (21)
τ Ring (55), τ CH3 (22)
τ Ring (56), τ CH3 (20)
τ Ring (55), τ CH3 (18)
τ Ring (56), τ CH3 (20)
τ Ring (56), τ CH3 (20)
Vibrational assignments
(PED%)
Table 2 The observed FT-IR, FT-Raman and calculated frequencies (in cm−1) using B3LYP/6-31 + G (d,p) along with their relative intensities, probable assignments, reduced mass and force constants of (3E)-3-(4-methylbenzylidene)-3,4-dihydro-2H-chromen-2-one
Beena et al. Chemistry Central Journal (2017) 11:6
Page 7 of 19
1189
1250
1420
1440
1476
1491
68
69
1407
65
66
1369
64
67
1349
1342
63
1261
1340
61
62
1288
1258
59
60
1255
58
1215
1227
1238
56
1218
1215
57
55
1100
1150
53
54
1190
1148
1180
1075
51
52
1088
1133
49
50
1000
1056
1060
47
48
1010
1033
45
46
990
984
988
43
44
970
981
900
41
954
40
42
947
875
919
39
876
37
38
862
850
858
36
1395
1387
1362
1343
1330
1306
1287
1260
1250
1243
1231
1217
1209
1197
1190
1153
1104
1072
1061
1053
1042
1029
1011
992
968
951
923
903
889
872
869
861
850
838
830
Scaled
Unscaled
FTIR
FT Raman
Calculated frequencies
(cm−1)
Observed frequencies
(cm−1)
35
Mode nos
Table 2 continued
1.072
1.277
2.310
1.248
1.776
2.450
2.373
1.625
5.462
1.825
3.099
2.115
2.485
2.167
1.580
1.274
2.389
1.113
1.367
1.775
4.259
1.545
2.122
2.848
1.409
1.282
1.377
1.476
1.579
1.399
1.572
6.652
1.962
2.202
3.739
Reduced mass
(amu)
1.450
1.449
2.850
1.483
2.074
2.709
2.544
1.727
5.782
1.785
2.893
1.964
2.247
1.924
1.381
1.109
1.994
0.914
1.063
1.344
2.975
1.024
1.396
1.794
0.848
0.738
0.786
0.837
0.877
0.751
0.831
3.314
0.888
0.964
1.625
Force constant
(mdyn/Å)
11.786
12.963
7.463
0.324
9.480
31.517
13.033
2.543
49.937
19.982
219.799
33.951
7.534
37.004
27.443
16.185
564.050
4.889
20.088
19.980
171.99
11.399
3.275
2.530
2.809
0.051
2.738
5.323
5.474
11.534
5.009
11.953
3.587
0.532
14.149
IR intensity
(km/mol)
0.102
0.069
0.084
0.393
0.143
0.047
0.436
0.527
0.759
0.588
0.644
0.281
0.045
1.290
0.044
0.942
3.029
0.005
0.106
0.028
0.044
0.009
0.289
0.024
0.020
0.002
0.150
0.410
0.037
1.087
0.061
0.057
0.199
0.221
0.099
Raman intensity
(Å4 amu−1)
ν CC (70), βCH (18)
ν CC (68), βCH (19)
ν CC (68), βCH (19)
ν CC (66), βCH (18)
ν CC (66), βCH (19)
ν CC (68), βCH (18)
βCH3asb (60), βCH (18), ν CC (10)
βCH3asb (66), βCH (17), ν CC (10)
βCH3sb (71), βCC (23), βCH (11)
βCH2asb (70), βCC (20), βCH (10)
βCH2sb (66), βCC (22), βCH (11)
ν C–CH3 (50), βCH (20), βCO (12)
ν CC (71), βCH (16), ν CH3 (12)
ν C=C (82), βCH3 (14)
ν CO (58), βCH (18), ν CC (12)
ν CO (58), βCH (18), ν CC (11)
γ CH3opr (71), βCC (23)
βCH3ipr (65), βCC (30)
γ CH2opr (66), βCH (21)
βCH2ipr (67), βCH (20)
βCH (78), ν CC (17)
βCH (78), ν CC (17)
βCH (76), ν CC (18)
βCH (70), ν CC (18)
βCH (66), ν CC (20)
βCH (66), ν CC (16)
βCH (78), ν CC (13)
βCH (76), ν CC (16)
βCH (78), ν CC (18)
βCCC (61), βCH (20), βCH3 (10)
βCCC (56), βCH (16), βCH3 (11)
βCCC (58), βCH3 (18), βCH (12)
βCCC (56), βCH (18), βCH3 (10)
βCCC (62), βCH3 (21), βCH (12)
βCCC (62), βCH3 (20), βCH (10)
Vibrational assignments
(PED%)
Beena et al. Chemistry Central Journal (2017) 11:6
Page 8 of 19
1540
1616
1603
3100
93
1404
3101
3018
3007
2999
2993
2989
2962
2945
2936
2911
2889
2863
2809
2801
1692
1615
1604
1592
1587
1543
1502
1487
1430
1.091
1.096
1.094
1.094
1.089
1.089
1.088
1.088
1.088
1.102
1.097
1.088
1.039
1.072
12.541
7.222
6.840
6.049
6.310
5.415
2.482
2.593
1.114
2.295
Reduced mass
(amu)
6.690
6.687
6.629
6.574
6.536
6.488
6.464
6.464
6.451
6.330
6.182
6.085
5.641
5.615
23.775
11.846
11.109
9.754
9.958
8.200
3.505
3.574
1.469
3.013
Force constant
(mdyn/Å)
6.782
5.949
18.471
14.859
7.580
17.412
7012
5.999
3.815
15.019
17.402
4.273
33.955
14.012
370.738
91.204
9.718
145.323
21.097
5.106
23.043
57.049
9.704
30.676
IR intensity
(km/mol)
0.076
0.335
0.243
0.219
0.129
0.127
0.109
0.065
0.088
0.127
0.180
0.081
0.722
0.299
0.460
0.131
0.093
3.229
0.660
0.867
0.262
0.019
0.119
0.013
Raman intensity
(Å4 amu−1)
ν CH (98)
ν CH (98)
ν CH (98)
ν CH (96)
ν CH (98)
ν CH (98)
ν CH (96)
ν CH (96)
ν CH (96)
ν assCH3 (88), ν CH (11)
ν assCH3 (80), ν CH (16)
ν ssCH3 (72), ν CH (23)
ν assCH2 (82)
ν ssCH2 (80)
ν C=O (72), ν CC (14)
ν CC (70), βCH (16)
ν CC (68), βCH (18)
ν CC (66), βCH (18)
ν CC (65), βCH (18)
ν CC (66), βCH (19)
ν CC (65), βCH (18)
ν CC (66), βCH (18)
ν CC (68), βCH (17)
ν CC (70), βCH (17)
Vibrational assignments
(PED%)
ν, stretching; β, in plane bending; γ, out of plane bending; ω, wagging; τ, torsion; ρ, rocking; δ, scissoring; ss, symmetric stretching; ass, antisymmetric stretching; sb, symmetric bending; asb, antisymmetric bending; ipr,
in-plane-rocking; opr, out-of-plane rocking
3225
3206
3218
3020
91
92
3192
3193
89
90
3177
3179
87
88
3172
3175
85
86
3092
3122
83
84
3080
3034
81
82
2980
80
2800
1668
1600
1690
78
79
1793
1654
1659
76
77
1636
75
74
1529
1548
1500
72
73
1492
1496
1432
70
Scaled
Unscaled
FTIR
FT Raman
Calculated frequencies
(cm−1)
Observed frequencies
(cm−1)
71
Mode nos
Table 2 continued
Beena et al. Chemistry Central Journal (2017) 11:6
Page 9 of 19
Beena et al. Chemistry Central Journal (2017) 11:6
Page 10 of 19
Fig. 4 The calculated frontiers energies of MBDC
will weaken the bond associated with the anti-bonding
orbital. Conversely, an interaction with a bonding pair
will strengthen the bond.
The corresponding results are presented in Tables 3
and 4. The intramolecular interaction between lone pair
of O27 with antibonding C13–O12 results in a stabilized
energy of 35.64 kcal/mol. The most important interaction in MBDC is between the LP(2)O12 and the antibonding C13–O27. This results in a stabilization energy
41.74 kcal/mol and denotes larger delocalization. The
valence hybrid analysis of NBO shows that the region
of electron density distribution mainly influences the
polarity of the compound. The maximum electron density on the oxygen atom is responsible for the polarity of
the molecule. The p-character of oxygen lone pair orbital
LP(2) O27 and LP(2) O12 are 99.66 and 99.88, respectively. Thus, a very close pure p-type lone pair orbital
participates in the electron donation in the compound.
Mulliken charges
The Mulliken atomic charges of MBDC were calculated by
B3LYP/6–31 + G (d,p) level theory (Table 5). It is important
to mention that the atoms C1, C2, C4, C7, C10, H18, H19,
O27 of MBDC exhibit positive charges, whereas the atoms
C3, C5, C6, C11, O12 exhibit negative charges. The maximum negative and positive charge values are −0.95788 for
C11 and 0.90500 for C10 in the molecule, respectively.
UV–Visible analysis
Theoretical UV–Visible spectrum (Table 6) of MBDC
was derived by employing polarizable continuum model
(PCM) and TD-DFT method with B3LYP/6-31 + G(d,p)
basis set and compared with experimentally obtained
UV–Visible spectrum (Fig. 5). The spectrum shows the
peaks at 215 and 283 nm whereas the calculated absorption maxima values are noted at 223, 265 and 296 nm
in the solvent of ethanol. These bands correspond to
one electron excitation from HOMO–LUMO. The band
at 223 and 265 nm are assigned to the dipole-allowed
σ → σ* and π → π* transitions, respectively. The strong
transitions are observed at 2.414 eV (215 nm) with
f = 0.0036 and at 2.268 eV (283 nm) with f = 0.002.
Molecular electrostatic potential
Molecular electrostatic potential at the surface are
represented by different colours (inset in Fig. 5). Red
Beena et al. Chemistry Central Journal (2017) 11:6
Page 11 of 19
Table 3 Second-order perturbation energy [E(2), kcal/mol] between donor and acceptor orbitals of MBDC calculated
at B3LYP/6-31 + G(d,p) level of DFT theory
Donor (i)
Acceptor (j)
E(2)
ED (i) (e)
ED (j)(e)
E(j) − E(i) (a.u.)
F(i,j) (a.u.)
LP(1)O27
σ*C8–C13
3.01
1.97789
0.07355
1.11
0.052
LP(1)O27
σ*C13–O12
0.08
1.97789
0.10629
1.03
0.026
LP(2)O27
π*C8–C13
18.58
1.83804
0.07355
0.67
0.102
LP(2)O27
π*C13–O12
35.64
1.83804
0.10629
0.60
0.132
LP(2)O27
π*C7–H26
0.70
1.83804
0.01944
0.73
0.021
LP(1)O12
σ*C8–C13
6.30
1.95794
0.07355
0.96
0.070
LP(1)O12
σ*C10–C11
6.54
1.95794
0.03331
1.11
0.076
LP(1)O12
σ*C11–C17
0.77
1.95794
0.02024
1.10
0.026
LP(1)O12
σ*C13–O27
2.06
1.95794
0.01348
1.16
0.044
LP(2)O12
σ*C10–C11
25.17
1.95794
0.38783
0.36
0.088
LP(2)O12
σ*C13–O27
41.74
1.76210
0.24560
0.34
0.106
σC8–C9
σ*C8–C7
3.21
1.9767
0.01864
1.29
0.057
σC8–C13
σ*C7–C1
4.13
1.97727
0.02282
1.14
0.061
πC9–H28
π*C8–C7
3.36
1.96228
0.06368
0.55
0.038
πC9–H29
π*C10–C11
3.31
1.96216
0.38783
0.53
0.041
σC10–C14
σ*C11–O12
4.82
1.97139
0.03516
1.03
0.063
σC11–C17
σ*C10–C11
4.15
1.97581
0.03331
1.28
0.065
σH30–C14
σ*C10–C11
4.18
1.98112
0.03331
1.10
0.061
σC17–C16
σ*C11–O12
4.34
1.97651
0.03516
1.03
0.060
σC17–H33
σ*C10–C11
4.56
1.97906
0.03331
1.09
0.063
σC7–H26
σ*C8–C9
7.24
1.96715
0.02414
0.94
0.074
σC2–H18
σ*C1–C6
4.35
1.98162
0.02521
1.08
0.061
σC6–H25
σ*C1–C2
4.31
1.98170
0.02470
1.09
0.061
σC5–H24
σ*C6–C4
4.24
1.98119
0.02266
1.00
0.029
πC20–H21
π*C5–C4
4.04
1.98750
0.34063
0.53
0.045
colour indicates electronegative character responsible for electrophilic attack, blue colour indicates positive region representing nucleophilic attack and green
colour represents the zero potential. The electrostatic
potential increases in the order red < orange < yellow < green < blue [29]. The mapped electrostatic potential surface of the molecule shows that atoms O27 and
O12 of chromen possess negative potential and all H
atoms have positive potential. The same regions are
identified in the Mulliken charges also.
Hyper polarizability
On the basis of the finite-field approach, using B3LYP/6–
31 + G (d,p) basis set, the first hyperpolarizability (β),
dipole moment (μ) and polarizability (α) for MBDC are
calculated and compared with urea (Table 7) [30]. The
dipole moment of MBDC is 1.6941 times greater than the
magnitude of urea (μtot of urea is 3.2705 D) and the first
hyperpolarizability is 1.51 times greater than the magnitude of urea (βtot of urea is 3.7472 × 10⁻³¹ esu). Urea is
the standard NLO crystal reported earlier [31] so that a
direct comparison was made.
Dielectric studies
The experimental data of ε0, ε′, ε∞ and τ of MBDC in ethanol at various concentrations are presented in Table 8.
The static and microwave dielectric constants decrease
with increasing concentration of the compound. This
shows a weak interaction exists between the molecule
and the solvent at low frequencies. Optical dielectric
constant increases with increasing solute concentration
which leading to a strong interaction between MBDC
and ethanol at high frequency. It indicates the formation
of a hydrogen bonding between –OH group of alcohol
and C=O of coumarin. The relaxation time increases
with the increase of bond length confirming the degree of
cooperation, shape and size of the molecule [32].
NMR study
The characterization of MBDC was further enhanced by
the study of 1H NMR method. The computed 13C NMR
and 1H NMR chemical shifts and experimental 1H NMR
are compiled in Table 9. The experimental 1H NMR
spectrum in CDCl3 solution is shown in Fig. 6. The relevant difference of 1H NMR chemical shifts calculated
Beena et al. Chemistry Central Journal (2017) 11:6
Page 12 of 19
Table 4 NBO results showing the formation of Lewis and non Lewis orbitals of MBDC molecule by B3LYP/6-31G + (d,p)
method
Bond (A–B)
σ C8–C9
σ C8–C13
σ C9–H28
σ C10–C14
σ C11–C17
σ H30–C14
σ C17–C16
σ C17–H33
σ C7–H26
σ C2–H18
σ C6–H25
σ C5–H24
σ C20–H21
LP(1) O27
LP(2) O27
LP(1) O12
LP(2) O12
ED/energy (a.u.)
1.97667
−0.65200
1.97727
−0.68595
1.96228
−0.51190
1.97139
−0.70409
1.97581
−0.71570
1.98112
−0.53074
1.97651
−0.25929
1.97906
−0.52986
1.96715
−0.52611
1.98162
−0.52927
1.98170
−0.53031
1.98119
−0.52761
1.98750
EDA %
EDB %
NBO
s%
p%
50.31
49.69
0.7093 (sp2.03)
0.7049 (sp2.71)
32.95
26.97
67.02
72.98
51.86
48.14
0.7201 (sp2.48)
0.6938 (sp1.52)
28.69
39.66
71.27
60.28
63.78
36.22
0.7986 (sp3.34)
0.6019 (sp0.00)
23.04
99.95
76.91
00.05
51.60
48.40
0.7184 (sp1.82)
0.6957 (sp1.91)
35.47
34.37
64.50
65.59
51.16
48.84
0.7153 (sp1.62)
0.6989 (sp2.00)
38.17
33.31
61.80
66.64
37.66
62.34
0.6137 (sp0.00)
0.7896 (sp2.37)
99.95
29.65
00.05
70.31
50.46
49.54
0.7103 (sp1.79)
0.7039 (sp1.88)
35.85
34.75
64.11
65.20
63.18
36.782
0.7948 (sp2.24)
0.6068 (sp0.00)
30.81
99.95
69.15
00.04
63.87
36.13
0.7992 (sp2.36)
0.6011 (sp0.00)
29.74
99.95
70.22
00.05
62.58
37.42
0.7911 (sp2.34)
0.6117 (sp0.00)
29.94
99.95
70.02
00.05
62.53
37.47
0.7908 (sp2.34)
0.6121 (sp0.00)
29.93
99.95
70.03
00.05
62.30
37.70
0.7893 (sp2.37)
0.6140 (sp0.00)
29.62
99.95
70.34
00.05
62.42
37.58
0.7901 (sp3.12)
0.6130 (sp0.00)
24.25
99.95
75.70
00.05
sp0.70
58.63
41.30
sp99.99
00.05
99.66
sp1.89
34.56
65.38
sp1.00
00.00
99.88
−0.51049
1.97789
−0.69724
1.83804
−0.26311
1.95794
−0.54749
1.76210
−0.33734
by GIAO/B3LYP method is: 0.06(H31), 0.17(H26) and
0.19(H24). The maximum deviation from experimental
value is responded to be 0.19 ppm for H24 atom [33].
Overall the calculated values agree with the experimental chemical shift values and the slight deviations may be
due to the influence of proton exchange, hydrogen bond
and solvent effect in complex real systems. The results of
13
C NMR chemical shift of the MBDC compound is reliable for the interpretation of spectroscopic parameters.
The C1 and C2 atoms of the compound are attached with
the electron releasing group and hence they are more
electron donating than C15. This causes more shielding
at C1 and C2 positions and hence the chemical shift values are lesser.
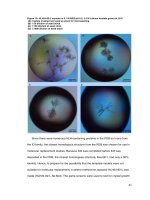
Molecular docking studies
Glide docking was used to study the binding orientations
and affinities of MBDC with tankyrase as target protein
(Fig. 7). Tankyrases are ADP-ribosyltransferases that play
key roles in various cellular pathways, including the regulation of cell proliferation, and thus they are promising
drug targets for the treatment of cancer [12]. The keto
atom in MBDC interacts with SER1068 and GLY1032 at
distances of 3.17 and 2.91 Å, respectively (Table 10). This
Beena et al. Chemistry Central Journal (2017) 11:6
Page 13 of 19
Table 5 The charge distribution calculated by the Mulliken
method
Atoms
Mulliken charge
C1
0.35122
C2
0.07866
C3
−0.25976
C4
−0.09783
−0.22079
−0.23196
0.28427
C5
−0.03843
−0.54829
C6
−0.23334
−0.26856
C7
−0.22441
0.10817
C8
0.48781
C9
−0.49756
C10
−0.12331
−0.15456
−0.50908
0.90500
C11
−0.08766
0.29617
−0.95788
O12
−0.39388
C13
−0.51439
0.33449
C14
0.80701
−0.31967
C15
NBO
Fig. 5 Experimental UV spectrum of MBDC. Inset figure predicated
MEP map of MBDC
−0.21966
0.13614
−0.25219
0.24986
Table 7 The calculated electric dipole moment (μtot D)
the average polarizability (αtot × 10−24 esu) and the first
hyperpolarizability (βtot × 10−31 esu)
H19
0.12586
0.24422
Parameters
Values
C20
−0.60604
−0.70947
μx
2.9237
μy
−4.6995
C16
−0.08232
C17
−0.23483
−0.15764
H18
−0.26075
0.13200
H21
0.17095
0.24897
H22
0.16101
0.24929
H23
0.15358
0.25629
H24
0.12235
0.24404
H25
0.12453
0.24877
H26
0.15765
0.27521
O27
−0.44633
−0.56839
H28
0.18552
0.27671
H29
0.16406
0.27813
H30
0.12443
0.24480
H31
0.12660
0.24891
H32
0.13021
0.25025
H33
0.14289
0.26243
μz
μtot (D)
αxx
αxy
αyy
αxz
αyz
αzz
αtot (esu)
−0.2541
5.5406
−93.6767
6.1433
−119.8535
−0.1725
−4.4825
−111.9369
2.32632 × 10−24
βxxx
23.1945
βxxy
−28.7842
βxyy
βyyy
βxxz
20.1351
−51.2342
−32.9779
Table 6 UV-Vis excitation energy and electronic absorption spectra of MBDC using TD-B3LYP/631G + (d,p)
method
βxyz
Exp. (nm)
βyzz
8.6308
βzzz
6.4779
βtot (esu)
5.6583 × 10⁻³¹
283
Wavelength
(nm)
296
Energy (eV) Oscillator
strength (f)
2.2007
0.0134
Assignments
π → π*
283
265
2.2684
0.002
π → π*
215
223
2.4147
0.0036
σ − σ*
result suggests that the MBDC binds well in the active
site pocket of tankyrase and interact with the amino
acid residues. These results are compared with the anti
βyyz
βxzz
−12.6553
−7.0618
5.9903
cancer drug molecule warfarin derivative. This drug molecule fits in the active site and favourable interactions are
observed with the same residues. The results obtained
reveals that both the molecules have comparable interactions and better docking scores.
Beena et al. Chemistry Central Journal (2017) 11:6
Page 14 of 19
Table 8 Values of dielectric constant (ε0, ε′, ε∞) and relaxation time τ(ps) of MBDC in ethanol at 303 K
System
Mole conc.
Static dielectric constant (ε0)
Microwave dielectric
constant (ε′)
Optical dielectric constant (ε∞)
Relaxation
time τ (ps)
Ethanol + MBDC
0.025
24.10
22.45
1.848
125.45
0.040
21.14
20.33
1.945
132.61
0.055
19.36
18.39
2.570
148.44
0.070
15.89
16.59
2.832
153.89
Table 9 Experimental (in CDCl3), predicted (δpred) 13C and 1H chemical shifts (ppm) and calculated GIAO/B3LYP/631 + G(d,p) isotropic magnetic shielding tensors (σcalc) for (3E)-3-(4-methylbenzylidene)-3,4-dihydro-2H-chromen-2-one
1
H
δexp (CDCl3)
CDCl3
δpred
13
Gas phase
σcalc
δpred
C
σcalc
CDCl3
δpred
Gas phase
σcalc
δpred
σcalc
H18
7.36
7.42
23.9144
7.20
24.1513
C1
115.85
62.9668
116.66
62.1766
H19
7.36
7.46
23.8777
7.22
24.1263
C2
117.49
61.3681
117.18
61.6766
H21
2.42
2.66
28.8984
2.63
28.9317
C3
111.81
66.8779
111.47
67.2105
H22
2.42
2.39
29.1857
2.34
29.2393
C4
127.41
51.7495
125.56
53.5485
H23
2.42
2.21
29.3704
2.14
29.4509
C5
111.58
67.1015
111.27
67.4047
H24
7.21
7.40
23.9349
7.15
24.2029
C6
112.70
66.0193
112.14
66.5622
H25
7.39
7.41
23.9272
7.24
24.1070
C7
129.24
49.9746
127.65
51.5188
H26
7.96
8.13
23.1789
8.01
23.3020
C8
106.14
72.3815
106.55
71.98
16.03
159.7719
H28
4.07
4.08
27.4169
3.92
27.5850
C9
15.45
H29
4.07
4.02
27.4732
3.92
27.5830
C10
106.20
160.332
72.3198
104.77
73.708
H30
7.24
7.25
24.0981
6.95
24.4081
C11
134.84
44.5441
135.63
43.7844
H32
7.28
7.33
24.0134
7.10
24.2574
C13
149.18
30.6419
146.48
33.261
H33
7.10
7.10
24.2534
6.93
24.4260
C14
110.11
68.5299
109.42
69.2007
Anticancer activity
The results of the antiproliferative activity of MBDC
and Warfarin derivative against MCF-7 breast cancer
and HT-29 colon cancer cell lines at different concentrations (7.8, 15.6, 31.2, 62.5, 125, 250, 500 and 1000 μg/
ml) for 24 h, and cell proliferation was measured by a
standard MTT assay. As shown in Figs. 8a, b and 9a, b,
MCF-7 and HT-29 cells exposed to MBDC and Warfarin
derivative exhibited significant cytotoxicity in the dose
dependent manner after 24 h treatment. The estimated
half maximal inhibitory concentration (IC 50) value for
MBDC and Warfarin derivative was 15.6 and 31.2 μg/
ml respectively. This enhanced cytotoxicity of MBDC in
MCF-7 breast cancer and HT-29 colon cancer cell lines
may be due to their efficient targeted binding and eventual uptake by the cells.
C15
107.00
71.5493
105.72
72.7857
C16
109.94
68.6951
109.65
68.9804
C17
99.92
78.414
100.35
77.9959
Conclusion
The vibrational and molecular structure analysis have
been performed based on the quantum mechanical
approach using DFT calculations. The difference in the
observed and scaled wavenumber values of most fundamentals is very small. Therefore, the assignments made
using DFT theory with experimental values seem to be
correct. The geometrical structure shows a little distortion due to the substitution of methyl benzylidene and
chromen group in the benzene.
The chromen group substitution plays an important role
with its characteristic peaks compared in both experimental
and theoretical FTIR and FT-Raman spectra. The MEP map
shows negative potential sites on O27 and O12 of chromen
and positive potential sites on all H atoms which are responsible for electrophilic and nucleophilic attacks, respectively.
Beena et al. Chemistry Central Journal (2017) 11:6
Page 15 of 19
Fig. 6 Experimental 1H NMR spectrum of MBDC
In addition, HOMO and LUMO orbitals are in agreement with MEP. The results indicate that the title compound is found to be useful to bond metallicity and inter
molecular interaction. The NBO analysis explains the
large delocalization of charge in the molecule. The predicted NLO properties are compared with that of urea
and the title compound seems to be a good candidate of
second-order NLO materials.
Molecular docking study shows that MBDC binds well
in the active site of tankyrase and interact with the amino
acid residues. These results are compared with the anti
cancer drug molecule of warfarin derivative. The results
suggest that both the molecules have comparable interactions and better docking scores. The results of the antiproliferative activity of MBDC and Warfarin derivative
against MCF-7 breast cancer and HT-29 colon cancer
Beena et al. Chemistry Central Journal (2017) 11:6
Page 16 of 19
Fig. 7 a MBDC interacts with the amino acid in the active site of tankyrase, b anticancer drug Warfarin derivative interacts with the amino acid in
the active site of tankyrase, c surface diagram showing MBDC fit into the active site of tankyrase
cell lines at different concentrations exhibited significant
cytotoxicity. The estimated half maximal inhibitory concentration (IC 50) value for MBDC and Warfarin derivative was 15.6 and 31.2 μg/ml, respectively. This enhanced
cytotoxicity of MBDC in MCF-7 breast cancer and
HT-29 colon cancer cell lines may be due to their efficient targeted binding and eventual uptake by the cells.
Hence the compound MBDC may be considered as a
Beena et al. Chemistry Central Journal (2017) 11:6
Page 17 of 19
Table 10 Hydrogen bond interactions of title compound and co-crystal ligand with amino acids at the active site
of tankyrases
Docking score
Glide energy (kcal/mol)
Hydrogen bonding interactions
Donor
Acceptor
Distance (Å)
−49.845
N–H[GLY1032]
O
2.91
O–H[SER1068]
O
3.17
−55.759
NH[Tyr1060]
O
2.0
NH[Gly1032]
O
2.1
OH
O[Gly1032]
2.0
OH
N[His 1031]
3.7
N[His1031]
O
3.3
O[His1048]
O
3.5
MBDC
−10.823
Warfarin
−10.625
Fig. 8 Graphical representation of MBDC molecule on a MCF-7 cell line and b HT-29 cell line
Beena et al. Chemistry Central Journal (2017) 11:6
Page 18 of 19
Fig. 9 Graphical representation of Warfarin derivative on a MCF-7 cell line and b HT-29 cell line
drug molecule for cancer. The dielectric relaxation studies show the existence of molecular interactions between
MBDC and alcohol. The NMR spectrum confirms the
molecular structure of the compound.
Authors’ contributions
TB proposed the work, carried out the DFT studies, dielectric, NMR and
anticancer studies, arranged the results and drafted the manuscript under the
guidance of LS. Spectroscopic studies carried out by AN under the guidance
of VB. DK synthesized the title compound. Molecular docking, manuscript
revision and final shape were done by MNP. All authors read and approved the
final manuscript.
Author details
1
Department of Physics, SRM University, Ramapuram, Chennai 600089,
India. 2 Research Department of Physics, A.A. Government Arts College,
Musiri, Tiruchirapalli 621211, India. 3 Department of Organic Chemistry,
University of Madras, Guindy Campus, Chennai 600025, India. 4 CAS in Crystallography & Biophysics, University of Madras, Guindy Campus, Chennai 600025, India.
Acknowledgements
MNP thanks UGC, New Delhi for the financial support in the form of UGCEmeritus Fellowship. We wish to thank (BIF) at CAS in Crystallography and
Biophysics, University of Madras, Chennai-25.
Competing interests
This is the characterization study which provides the needed information to
prove that the molecule MBDC competes with Warfarin derivative as an anticancer agent.
Received: 9 May 2016 Accepted: 7 December 2016
Beena et al. Chemistry Central Journal (2017) 11:6
References
1. Madari H, Panda D, Wilson L, Jacobs RS (2003) Dicoumarol: a unique
microtubule stabilizing natural product that is synergistic with Taxol.
Cancer Res 63:1214–1220
2. Takeuchi Y, Xie L, Cosentino LM, Lee KH (1997) Anti-AIDS agents—XXVIII.
Synthesis and anti-HIV activity of methoxy substituted 3′,4′-di-O-(−)camphanoyl-(+)-cis-khellactone (DCK) analogues. Bioorg Med Chem Lett
7:2573–2578
3. Manolov I, Moessmer CM, Danchev N (2006) Synthesis, structure,
toxicological and pharmacological investigations of 4-hydroxycoumarin
derivatives. Eur J Med Chem 41:882–890
4. Ostrov DA, Prada JAH, Corsino PE, Finton KA, Le N, Rowe TC (2007) Discovery of novel DNA gyrase inhibitors by high-throughput virtual screening.
Antimicrob Agents Chemother 51:3688–3698
5. Koshy L, Dwarakanath BS, Raj HG, Chandra R, Mathew TL (2003) Suicidal
oxidative stress induced by certain antioxidants Indian. Indian J Exp Biol
41:1273–1278
6. Ghate M, Manohar D, Kulkarni V, Shobha R, Kattimani SY (2003) Synthesis
of vanillin ethers from 4-(bromomethyl) coumarins as anti-inflammatory
agents. Eur J Med Chem 38:297–302
7. Baba M, Jin Y, Mizuno A, Suzuki H, Okada Y, Takasuka N, Tokuda H, Nishino
H, Okuyama T (2002) Studies on cancer chemoprevention by traditional
folk medicines XXIV. Inhibitory effect of a coumarin derivative, 7-isopentenyloxycoumarin, against tumor-promotion. Biol Pharm Bull 25:244–246
8. Gacche RN, Jadhav SG (2012) Antioxidant activities and cytotoxicity of
selected coumarin derivatives: preliminary results of a structure–activity
relationship study using computational tools. J Exp Clin Med 4:165–169
9. Paramjeet KM, Dipak S, Arti D (2012) Overview of synthesis and activity of
coumarins. Int Sci Res J 4:16–37
10. Frisch MJ, Trucks GW, Schlegel HB, Scuseria GE et al (2009) Gaussian, Inc.,
Wallingford
11. Frisch A, Nielsen AB, Holder AJ (2007) Gaussview users manual. Gaussian
Inc., Pittsburg
12. Narwal M, Koivunen J, Haikarainen T, Obaji E, Ongey E, Venkannagari LH,
Joensuu P, Pihlajaniemi T, Lehtiö L (2013) Discovery of tankyrase inhibiting
flavones with increased potency and isoenzyme selectivity. J Med Chem
56:7880–7889
13. Schrödinger Suite 2011 (2011) Maestro, version 9.2. Schrödinger, LLC,
New York
14. Patel UH, Gandhi SA, Patel BD, Modh RD, Patel RH, Yadav J, Desai R (2013)
Synthesis, characterizations, molecular structure and DFT studies of
4-benzylidene-2-(2-chloro-phenyl)-5-methyl-2, 4-dihydro-pyrazol-3-one.
Indian J Pure Appl Phys 51:819–826
15. Sajan D, Erdogdu Y, Reshmy R, Dereli O, Thomas KK, Joe H (2011) DFTbased molecular modeling, NBO analysis and vibrational spectroscopic
study of 3-(bromoacetyl)coumarin. Spectrochim Acta A Mol Biomol
Spectrosc 82:118–125
16. Peesole RL, Shield LD, Mcwillam IC (1976) Modern methods of chemical
analysis. Wiley, New York
Page 19 of 19
17. Sharma YR (1994) Elementary organic spectroscopy—principles and
chemical applications. S. Chand & Company Ltd., New Delhi, pp 92–93
18. Mohan J (2001) Organic spectroscopy principles and applications, 2nd
edn. Narosa Publishing House, New Delhi
19. Kalsi PS (2009) Spectroscopy of organic compounds. New Age International (P) Limited Publishers, New Delhi
20. Krishnakumar V, Xavier RJ (2003) Normal coordinate analysis of vibrational
spectra of 2-methylindoline and 5-hydroxyindane. Indian J Pure Appl
Phys 41:95–98
21. Varsanyi G (1969) Vibrational spectra of benzene derivatives. Akademiai
Kiado, Budapest
22. Coates J (2000) Interpretation of infrared spectra a practical approach. In:
Meyers RA (ed) Encyclopedia of analytical chemistry. Wiley, Chichester
23. Vein DL, Colthup NB, Fateley WG, Grasselli JG (1991) The handbook of
infrared and Raman characteristic frequencies of organic molecules.
Academic Press, San Diego
24. Matulkova I, Nemec I, Teubner K, Nemec P, Micka Z (2008) Novel
compounds of 4-amino-1,2,4-triazole with dicarboxylic acids—crystal
structures, vibrational spectra and non-linear optical properties. J Mol
Struct 873:46–60
25. Colthup NB, Daly LH, Wiberly SE (1990) Introduction of infrared and
Raman spectroscopy, 3rd edn. Academic Press, New York
26. Sundaraganesan N, Elango G, Sebastian S, Subramani P (2009) Molecular
structure, vibrational spectroscopic studies and analysis of 2-fluoro5-methylbenzonitrile. Indian J Pure Appl Phys 47:481–490
27. Handy NC, Masien PE, Amos RD, Andrews JS, Murry CW, Laming G (1992)
The harmonic frequencies of benzene. Chem Phys Lett 197:506–515
28. Powell BJ, Baruah T, Bernstein N, Brake K, McKenzie RH, Meredith P,
Pederson MR (2004) A first-principles density-functional calculation of
the electronic and vibrational structure of the key melanin monomers. J
Chem Phys 120:8608–8615
29. Thul P, Gupta VP, Ram VJ, Tandon P (2010) Structural and spectroscopic
studies on 2-pyranones. Spectrochim Acta A Mol Biomol Spectrosc
75:251–258
30. Sun YX, Hao QL, Wei WX, Yu ZX, Lu LD, Wang X, Wang YS (2009) Experimental and density functional studies on 4-(3,4-dihydroxybenzylideneamino) antipyrine, and 4-(2,3,4-trihydroxybenzylideneamino) antipyrine. J
Mol Struct THEOCHEM 904:74–82
31. Reis H, Papadopoulous MG, Munn RW (1998) Calculation of macroscopic
first-, second-, and third-order optical susceptibilities for the urea crystal. J
Chem Phys 109:6828–6838
32. Dharmalingam K, Ramachandran K, Sivagurunathan P (2007) Hydrogen
bonding interaction between acrylic esters and monohydric alcohols
in non-polar solvents: an FTIR study. Spectrochim Acta A Mol Biomol
Spectrosc 66:48–51
33. Osmiałowski B, Kolehmainen E, Gawinecki R (2001) GIAO/DFT calculated
chemical shifts of tautomeric species. 2-Phenacylpyridines and (Z)-2-(2hydroxy-2-phenylvinyl)pyridines. Magn Reson Chem 39:334–340