Morphologically controlled synthesis of ferric oxide nano/micro particles and their catalytic application in dry and wet media: A new approach
Bạn đang xem bản rút gọn của tài liệu. Xem và tải ngay bản đầy đủ của tài liệu tại đây (4.25 MB, 14 trang )
Janjua et al. Chemistry Central Journal (2017) 11:49
DOI 10.1186/s13065-017-0278-0
RESEARCH ARTICLE
Open Access
Morphologically controlled synthesis
of ferric oxide nano/micro particles and their
catalytic application in dry and wet media: a
new approach
Muhammad Ramzan Saeed Ashraf Janjua1*, Saba Jamil2*, Nazish Jahan2, Shanza Rauf Khan2 and Saima Mirza3
Abstract
Morphologically controlled synthesis of ferric oxide nano/micro particles has been carried out by using solvothermal
route. Structural characterization displays that the predominant morphologies are porous hollow spheres, microspheres, micro rectangular platelets, octahedral and irregular shaped particles. It is also observed that solvent has
significant effect on morphology such as shape and size of the particles. All the morphologies obtained by using different solvents are nearly uniform with narrow size distribution range. The values of full width at half maxima (FWHM)
of all the products were calculated to compare their size distribution. The FWHM value varies with size of the particles
for example small size particles show polydispersity whereas large size particles have shown monodispersity. The size
of particles increases with decrease in polarity of the solvent whereas their shape changes from spherical to rectangular/irregular with decrease in polarity of the solvent. The catalytic activities of all the products were investigated
for both dry and wet processes such as thermal decomposition of ammonium per chlorate (AP) and reduction of
4-nitrophenol in aqueous media. The results indicate that each product has a tendency to act as a catalyst. The porous
hollow spheres decrease the thermal decomposition temperature of AP by 140 °C and octahedral F e3O4 particles
decrease the decomposition temperature by 30 °C. The value of apparent rate constant ( kapp) of reduction of 4-NP has
also been calculated.
Keywords: Nanostructures, Chemical synthesis, Solvent effect, Thermo gravimetric analysis (TGA), Catalytic
properties, Nitrophenol, Pollutant, Reduction
Background
Magnetic nano materials possess unique prospects in
various fields of life due to their well-regulated size
and magnetic properties [1]. Iron oxide magnetic nano
spheres are inclined to be either paramagnetic or super
paramagnetic with a size fluctuating from a few nanometers to tens of nanometers. Iron oxide nanoparticles are
of pronounced curiosity for investigators from a wide
range of disciplines like magnetic fluids [2], catalysis
*Correspondence: ;
1
Department of Chemistry, King Fahd University of Petroleum
and Minerals (KFUPM), Dhahran 31261, Kingdom of Saudi Arabia
2
Laboratory of Superlight Materials and Nano Chemistry, Department
of Chemistry, University of Agriculture, Faisalabad 38000, Pakistan
Full list of author information is available at the end of the article
[3], biotechnology/biomedicine [4], magnetic resonance
imaging [5], data storage [6] and environmental remediation [7]. Functionalized nanoparticles are very encouraging for applications in catalysis [8], bio labeling [9], and
bio separation [10]. Specifically in liquid-phase catalytic
reactions, such small and magnetically separable particles are very useful because quasi homogeneous systems
possess advantage of high dispersion, high reactivity and
easy separation [11, 12]. These magnetic nanoparticles
possess high magnetic moment which helps to efficiently
bind the specific biomolecules under physiological conditions. These nanoparticles often display very stimulating electrical, optical, magnetic and chemical properties,
which cannot be attained by their bulk complements.
© The Author(s) 2017. This article is distributed under the terms of the Creative Commons Attribution 4.0 International License
( which permits unrestricted use, distribution, and reproduction in any medium,
provided you give appropriate credit to the original author(s) and the source, provide a link to the Creative Commons license,
and indicate if changes were made. The Creative Commons Public Domain Dedication waiver ( />publicdomain/zero/1.0/) applies to the data made available in this article, unless otherwise stated.
Janjua et al. Chemistry Central Journal (2017) 11:49
It is well-known that the properties of nano materials are
strongly dependent on their morphology and structure.
That’s why different morphologies including nanorods,
[13, 14] nanotubes [15] and nanospheres [16, 17] of ferric
oxide nano materials have gained considerable attention.
As one of the most important, non-toxic, nature-friendly,
corrosion-resistant and stable metal oxide, hematite
(Fe2O3) has become a very attractive material due to its
wide applications in various fields [18]. Hydrothermal [19],
microwave hydrothermal [20] and microwave solvothermal [21] methods are truly low temperature methods for
the preparation of nanoscale materials of different size and
shape. These methods save energy and are environmentally
benign because these reactions take place in closed system
conditions. Synthesis of monodisperse nanometer-sized
magnetic particles of metal alloys and metal oxides are an
active research area because of their potential technological ramifications ranging from ultrahigh-density magnetic
storage media to biological imaging. Size, size distribution,
shape, and dimensionality are important for the properties of these magnetic materials [22, 23]. Nanoparticles of
various iron oxides (Fe3O4 and ç-Fe2O3 in particular) have
been widely used in a range of applications. Iron oxide
nanoparticles have been used as catalyst for thermal degradation of ammonium perchlorate (AP) and reduction of
nitrophenols. Campos et al. studied the thermal degradation of AP in the presence of F
e2O3 catalyst [24]. Xu et al.
used Fe2O3 microoctahedrons and nanorods as catalyst for
thermal degradation of AP [25]. Alizadeh-Gheshlaghi et al.
compared the catalytic activity of copper oxide, copper
chromite and cobalt oxide nanoparticles [26]. They found
that copper chromite shows best catalytic activity among
all samples because these nanoparticles decrease the thermal decomposition temperature of AP by 103 °C. Scientists
have reported effect of size of nanoparticle on catalysis. But
they did not report the effect of nature and composition
of solvent on size and morphology of ferric oxide (Fe3O4)
particles and their catalytic properties. This is the novelty of
this work. Here we are introducing template free synthesis
of magnetite (Fe3O4) micro and nanoparticles at low temperature and effect of morphology and size of particles on
their catalytic properties.
In this article, nano/micro particles of different morphology are prepared by using different solvents and
mixture of solvents to carry out a comparative study.
Synthesized products are characterized by XRD, SEM
and TEM. A diverse range of products are obtained like
sphere, spherical aggregate, irregular, micro rectangular
platelet and octahedron. The catalytic activity of all particles is also studied in dry as well as in wet media. The
effect of morphology and size of F
e3O4 particles on catalytic activity is investigated and compared with each other.
Page 2 of 14
Experimental
Materials
All the chemicals are purchased commercially and
used without any further purification. Ferric chloride
(FeCl3•6H2O), sodium borohydride
(NaBH4), sodium
ethanoate, poly ethylene glycol, n-hexane, absolute alcohol, ammonium perchlorate, 4-nitrophenol (4-NP), and
ethylene glycol (EG) are utilized for the synthesis of
nano/micro particles. Deionized water is used throughout the experimental work.
Synthesis of different morphologies of ferric oxide nano/
micro particles
1.35 g of FeCl3•6H2O was dissolved in 30 mL of ethylene glycol and 3.6 g of sodium ethanoate was dissolved
in 30 mL of ethylene glycol separately. Then both solutions were stirred for 10 min separately. Later both solutions were mixed with each other and allowed to stir
for 30 min. After 30 min, a black liquid was transferred
to Teflon lined autoclave of 100 mL capacity. The autoclave was sealed at a constant temperature of 200 °C for
18 h. After heating, the autoclave is allowed to cool at
room temperature. Product was collected by centrifugation at 3000 rpm. The resulting product was washed
three times with deionized water and three times with
absolute alcohol. The washed precipitates were dried in
a vacuum oven at 60 °C for 12 h. In this way product
A was obtained. Similarly product B is synthesized by
using the same protocol as mentioned above but the
solvent ethylene glycol was replaced by deionized water
and ethylene glycol (1:1) ratio. The product C is prepared by using polyethylene glycol as solvent whereas
n-hexane is used as solvent for the synthesis of product
D. The product E was synthesized by using a mixture
of n-hexane and ethylene glycol (1:1) as solvent. The
details of solvents and their appropriate ratios are given
in Table 1.
Catalytic activity
Catalytic activity in thermal decomposition of AP is
studied for all the prepared samples by adding only 1%
catalyst in AP. A mixture of catalyst A and AP was prepared by mixing 0.1 g of catalyst and 9.9 g of AP. Mixture
of catalyst and AP was ground to ensure the proper mixing. Further thermal decomposition was monitored with
NEZSCH TGA.
1.8 mL of 0.111 mM 4-NP, 0.5 mL of 50 mM N
aBH4
and catalyst were added in a cuvette and spectrum was
scanned in 200–500 nm wavelength range. The spectra were scanned on UVD3500 spectrophotometer. The
spectra were scanned after every minute till absorbance
at 400 and 300 nm becomes constant.
Janjua et al. Chemistry Central Journal (2017) 11:49
Page 3 of 14
Table 1 Comparison of effect of nature and composition of solvent on morphology and size of Fe3O4 particles and their
catalytic properties
Product
Solvent (s)
Nano/micro structure (s)
Catalytic thermal decomposition of AP
kapp of catalytic
reduction of 4-NP
Composition
Ratio Morphology
Size
Final decomposi- Temperature
Decrease in final
tion temperature of maximum loss decomposition
(°C)
in mass percent- temperature (°C)
age (°C)
A
Ethylene glycol
100% Porous hollow
sphere
140 nm
310
285
140
0.4206/min
B
Deionised water:
ethylene glycol
1:1
415 nm
345
329
105
0.3073/min
C
Poly ethylene
glycol
100% Micro rectangular
platelet
~12 µm
390
373
60
0.3054/min
D
n-Hexane
100% Octahedron
~4.3 µm 420
387
30
0.2834/min
E
n-Hexane: ethylene glycol
1:1
~4 µm
360
50
0.2837/min
Microsphere
Irregular
400
Structural characterization
Results and discussion
Structural characterization
XRD analysis
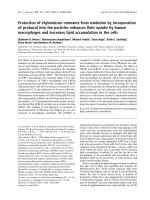
XRD patterns of all synthesized products are shown in
Fig. 1. XRD data analysis shows that product is F
e3O4.
The position and relative intensity of all diffraction lines
match well with those of the commercial magnetite powder (Aldrich catalog No. 31,006-9) reported by Sun et al.
[27]. Various parameters are obtained through XRD data
analysis whose detail is given in Table 2. Space group,
unit cell type, coordination number, position of atoms,
cell parameters, d-spacing and miller indices (hkl) values
are summarized in this table. Diffraction lines analysis
of Fig. 1a and b indicates that product A and B possess
monoclinic unit cell structure. Diffraction lines analysis of Fig. 1c and d indicates that product C and D possess face centered cubic unit cell structure. Lin et al. and
Mckenna et al. had also analyzed that Fe3O4 is made up
of cubic unit cells [28, 29]. Wright et al. had analyzed
that Fe3O4 is made up of monoclinic unit cells [30].
e
(620)
(440)
(511)
(400)
(220)
(422)
c
(222) (311)
d
(111)
Intensity/a.u
X-ray powder diffraction (XRD) patterns were obtained
on a Rigaku D/max Ultima III X-ray diffractometer with
a Cu-Kα radiation source (λ = 0.15406 nm) operated at
40 kV and 150 mA at a scanning step of 0.02° in the 2θ
range 10–80°. Scanning electron microscopy observation
was performed on a JEOL JSM-6480A scanning electron
microscope. Transmission electron microscopy (TEM)
observation was performed on an FEI Tecnai G2 S-Twin
TEM with an accelerating voltage of 200 kV. Thermo
gravimetric was taken on NEZSCH STA 409 PC with a
heating rate of 10 °C/min from 50 to 600 °C. UVD3500,
Shimadzu was used to monitor the catalytic reduction of
4-NP.
b
a
10
20
30
40
50
60
70
2theta/Degree
Fig. 1 XRD patterns of as-prepared Fe3O4. XRD patterns a, b, c, d and
e correspond to product A–E respectively
Absence of any extra peak in the XRD patterns shows
that obtained product obtained is highly pure. Sharp and
strong diffraction lines confirmed that product is highly
crystalline.
SEM and TEM observations
The morphology and structure of obtained products were
investigated by SEM and TEM as shown in Fig. 2 for five
different products prepared. The comparison of products
obtained on the basis of solvent used in solvothermal
process is given in Table 1.
Product A: porous hollow spheres of Fe3O4
SEM and TEM images of product A are given in Fig. 2.
Figure 2a shows an overview of the product. It seems
Janjua et al. Chemistry Central Journal (2017) 11:49
Page 4 of 14
Table 2 Summary of various parameters obtained from XRD pattern analysis of products A–E
Parameter
Product C and D
Product A and B
Name of compound
Magnetite
Magnetite
JCPDS no.
19-0629
28-0491
Crystal system
Cubic
Monoclinic
Type
Face centered
Primitive
Space group
Fd-3 m (227)
P12/m1 (10)
Crystallite size (Å)
282
282
a, b and c (Å)
8.3851, 8.3851 and 8.3851
5.9444, 5.9247 and 8.3875
α, β and γ (°)
90.0, 90.0 and 90.0
90.0, 90.237° and 90.0
0.125, 0.125 and 0.125
0.750, 0.500 and 0.125
0.500, 0.500 and 0.500
0.000, 0.500 and 0.000
Cell parameters
Atom coordinates
x, y and z of iron
0.250, 0.250 and 0.250
0.000, 0.000 and 0.500
0.500, 0.500 and 0.000
0.500, 0.000 and 0.500
0.750, 0.000 and 0.125
x, y and z of oxygen
0.253, 0.253 and 0.253
0.250, 0.260 and 0.005
0.510, 0.500 and 0.755
0.250, 0.240 and 0.495
0.010, 0.000 and 0.255
0.510, 0.000 and 0.745
0.010, 0.500 and 0.245
No. of formula units per unit cells (Z)
8.0
4.0
Density (g/cm3)
5.21600
5.2060
Volume (Å3)
591.9
225.6
Spacing (dhkl) (Å), 2-theta (°) and miller indices (hkl)
4.84743, 18.286 and (111)
5.43, 16.310 and (010)
2.96843, 30.079 and (220)
4.05653, 21.892 and (100)
2.53149, 35.429 and (311)
2.88045, 31.021 and (101)
2.42372, 37.061 and (222)
2.715, 32.963 and (020)
2.09900, 43.058 and (400)
2.69153, 33.259 and (002)
¯ )
2.59659, 34.513 and (102
1.9261, 47.144 and (331)
1.71383, 53.416 and (422)
¯ )
2.20488, 40.895 and (121
1.61581, 56.942 and (333)
¯
1.78442, 51.147 and (212)
1.48422, 62.527 and (440)
1.74586, 52.361 and (201)
1.41918, 65.743 and (531)
1.39933, 66.797 and (442)
1.65292, 55.551 and (130)
¯ )
1.63239, 56.311 and (131
1.32752, 70.934 and (620)
1.39209, 67.190 and (212)
1.28038, 73.969 and (533)
1.3575, 69.141 and (040)
1.26574, 74.970 and (622)
1.34287, 70.004 and (132)
1.30996, 72.033 and (123)
1.28733, 73.504 and (140)
¯ )
1.27756, 74.160 and (141
¯
1.24264, 76.613 and (124)
1.23355, 77.282 and (301)
1.21037, 79.047 and (320)
Janjua et al. Chemistry Central Journal (2017) 11:49
Page 5 of 14
b
c
d
e
f
g
90
70
3
Absorbed quantity (cm /g)
80
60
dV/ dD (cm3g-1nm-1)
a
0.06
0.04
0.02
0.00
0
50
30
60
Pore diameter (nm)
40
30
20
10
0.0
0.2
0.4
0.6
Relative prssure (P/Po)
0.8
1.0
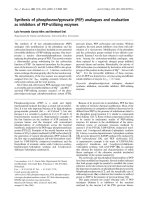
Fig. 2 a SEM images of F e3O4 prepared, b TEM image of product, c hollow spherical aggregates, d spherical aggregate, e and f HRTEM images of
the product. g Nitrogen adsorption–desorption isotherm and corresponding BJH pore-size distribution curve of product A
from this image that size of particles is very small and
formed aggregates. Therefore it is difficult to differentiate the morphology of the product and estimate the average size of particles by SEM. Thus TEM was carried out
to investigate the exact morphology. TEM micrographs
(Fig. 2b–d) show that the product is nearly spherical in
shape. It is also observed that very small nanoparticles
(~10 nm) have assembled together and formed a spherical morphology. But these spheres are not very uniform.
These aggregates of nanoparticles appear to be hollow
from inside. Figure 2b also confirms the presence of hollow spheres with a wide opening at the apical surface
(indicated by red arrow in the Fig. 2b). The product F
e3O4
is formed by loose packing of nanoparticles, thus small
pores have left behind (Fig. 2d). The average size of these
hollow spheres is approximately 140 nm. Few spheres
are also present in product whose size is smaller or bigger than 140 nm. Some of the spherical aggregates might
Janjua et al. Chemistry Central Journal (2017) 11:49
have broken because small nanoparticles are visible in
microscopic images.
HRTEM images of the Fe3O4 microspheres and nano
spheres obtained is shown in Fig. 2e and f. It can be seen
that the nanoparticles organized so well that they assembled into a single crystal by sharing identical lattices,
though some open pores and defects in HRTEM images
of the Fe3O4 microspheres are also observed. These are
obvious boundaries of the assembled small Fe3O4 nanoparticles. The particles of product A are hollow from
inside confirmed by SEM and TEM observations. This
result shows that the spherical morphology obtained
when ethylene glycol was used as solvent and the size
of product obtained is uniform. The hollow sphere
and porous structure might be result of carbon dioxide or methane gas trapped inside these spheres. With
the increase in heating time the gas pressure inside the
spheres increased that increased the size of spheres and
finally this gas comes out leaving behind an opening and
pores on the surface of these hollow porous spheres. The
porosity of these structures is also analyzed by nitrogen
adsorption–desorption isotherm. This isotherm is given
as Fig. 2g. This plot indicates that product is porous.
The specific surface area of this product is calculated as
35.63 m2/g.
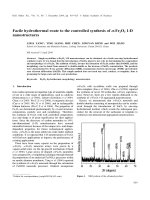
Product B: microspheres of Fe3O4
The product B is obtained by using deionized water and
ethylene glycol, in a ratio of 1:1, as solvent. The product B is characterized by using SEM and TEM and the
results are shown in Fig. 3. The SEM observation shows
that product is fairly spherical with no opening. The size
of these particles is in range of 140–415 nm but most of
them are about 415 nm. The product is appeared as bulk
and clustered together due to very large amount of spherical particles present among the product B as shown in
Fig. 3a–c.
TEM observations, shown in Fig. 3d–f, are in good
agreement with the results obtained by SEM images. The
product B is uniformly spherical with distinct boundaries
and compact shape. No irregularities have observed in
the morphology of the product. The average size of the
product measured by TEM micrograph is approximately
415 nm whereas a few nanospheres are also appeared
along with these microparticles.
The edges of these microparticles are very sharp with
no zigzag which confirms that the product B is uniformly
spherical in shape. The TEM images show the contrast
of light and dark colors that either confined to the presence of very thin walls/boundaries of the microspheres
or indicating the presence of cavity inside the spheres.
These spheres might be hollow from inside but no broken
microsphere has observed in SEM and TEM micrographs
Page 6 of 14
to confirm the presence of hollow microspheres. Nitrogen adsorption–desorption isotherm is used for analysis
of porosity of product B (Fig. 3g). This plot shows that
product is porous. BET pore size distribution is also calculated as 22.9 m2/g.
Product C: micro rectangular platelets of Fe3O4
The product obtained by using poly ethylene glycol as
solvent in solvothermal method named as product C. It
has characterized by SEM and TEM and obtained results
are shown as Fig. 4. It is evident from Fig. 4a and b that
the product is consisted of micro rectangular platelets
(flakes). It seems that particles align together in layer-bylayer assembly and form these platelets. The size of these
one dimensional rectangular platelets or petals is ranging from 10 to 20 µm in length and 8–12 µm in width.
These platelets are multi layered think that is approximately 5 µm as shown in Fig. 4c. These rectangular platelets show a specific trend of assembling, as indicated by
red arrow in Fig. 4a and b. This assembly of the platelets
is slightly appeared like some flower shaped morphology in which these platelets act as petals. These platelets are interlinked from the middle and give a shape as
that of cross as shown in Fig. 4a (at one end of two sided
red arrow). This cross followed by the addition of further platelets and acquires a shape of flower as shown
in Fig. 4b (another end of red arrow). This layer by layer
arrangement of these platelets finally leads to a flower
like morphology that appeared in Fig. 4d. The edges of
this flower shape Fe3O4 are very similar to that of original flowers and some of the platelets oriented upwards
acts as stamens (middle portion of original flowers).
There are two possibilities about this product C: (1) firstly
flower like structures are formed but by heating further
these structures are broken and give rise to the rectangular layer by layer assembled platelets: (2) the rectangular
platelets are formed and arrange in a specific pattern to
give rise to flower like structure. At the current conditions of experiment, the main product is micro rectangular platelet.
Product D: octahedra of Fe3O4
The product D was obtained by using n-hexane as solvent. It morphology was characterized by SEM. The
results are shown in Fig. 5a–d clearly indicate the presence of polyhedron morphology. The product consists
of uniform sized octahedral microparticles with eight
distinct faces. These particles are not present in the form
of aggregates but separated from each other as shown in
Fig. 5a but b shows the aggregate of these octahedral particles. These octahedral particles are aligned together in
the form of long cylinder. The size of these octahedrons is
uniform throughout the product with no variations.
Janjua et al. Chemistry Central Journal (2017) 11:49
Page 7 of 14
b
c
d
e
f
90
3
Absorbed quantity (cm /g)
g
60
dV/dD (cm3g-1nm-1)
a
0.04
0.02
0.00
0
30
60
Pore diameter (nm)
30
0
0.0
0.5
1.0
Relavtive pressure (P/Po)
Fig. 3 SEM and TEM images of product B, a–c SEM overview of the microspheres, d, e TEM overview of microspheres, and f a single microsphere.
g Nitrogen adsorption–desorption isotherm with the corresponding BJH pore-size distribution curve (the inset) of product B
Janjua et al. Chemistry Central Journal (2017) 11:49
Page 8 of 14
Fig. 4 SEM observations of micro rectangular platelets (product C) of Fe3O4, a and b an overview of the product, c micro rectangular platelets of
F e3O4, d flower like structure formed by discs
The size of each face of this octahedron is approximately 2.5 µm and the average diameter from one end to
another is almost 4.3 µm. A few nanometer sized particles attached on the surface of these micro octahedra are
observed in SEM micrograph Fig. 5. These micro octahedra appear to be very compact and rigid from outer
surface as well as from inner surface. The edges of these
octahedron are uniform and distinct with no irregularities are observed.
It might be some cubic shaped particles that appeared
first that further grows towards the edges (each face of
polyhedron). The lattice cell appeared at the initial of the
reaction and solvent molecule surrounds it in a specific
pattern that facilitates its growth to an octahedral micro
particles. It is concluded from the fact, n-hexane is utilized as solvent in solvothermal synthesis support the
octahedral morphology.
Product E: irregular morphology of Fe3O4
To prepare the product E, n-hexane and ethylene glycol
in a ratio of 1:1 was used as solvent under solvothermal conditions. The product obtained is further dealt
with structure characterization by using SEM and TEM
and the results are given as Fig. 6a–d. Product E shows
irregular geometry when it is examined through the
SEM. Some of the particles are irregular shaped embedded in some material. Under the low resolution of SEM,
it is not possible to differentiate between different shapes
appeared in the product rather than any uniform shape
and morphology. For a clear indication of the structure
of Fe3O4 particles, TEM is carried out. The results are
given as Fig. 6c and d. Some irregular shaped particles
are of few micrometers size and some of them are connected like net and run to several micro meters. Besides
these big particles, there are present a large number small
particles.
Effect of nature and composition of solvent on size and size
distribution of products
The size distribution histograms of products A–D are
given in Fig. 7. This figure shows that the particle size of
products is in order: A
non-polar solvent ethylene glycol was used for synthesis
of product A. Polarity of solvent used during synthesis
is decreases from product A to D. It means particles of
smaller size are synthesized using less non-polar solvent
and particles of larger size are synthesized using more
Janjua et al. Chemistry Central Journal (2017) 11:49
Page 9 of 14
Fig. 5 SEM observations of octahedral microparticles (product D), a an overview of the product, b octahedral particles aggregated together in the
form of cylindrical rod, c different octahedral particles, d single octahedral structure
non-polar solvent. The size distribution of products A–D
can be compared from Fig. 7. Size distribution histogram of product E is not given because product E possess
irregular reef like structures (as confirmed from SEM
images of Fig. 6). All the size distribution histograms
obeyed Gaussian distribution and possess one peak only.
It means the size of particles of products A–D vary in a
specific range only. Gaussian distribution shows that particles of products A–D possess homogenous size distribution. It means that products A–D are monodisperse.
The full width at half maxima (FWHM) value of all products was also calculated and given in Fig. 7. FWHM value
of product A and B can be compared with each because
both products contain particles above 100 nm. Similarly
FWHM value of product C and D can be compared with
each other because both products contain particles below
100 μm. (FWHM)B is smaller than (FWHM)A which
shows that product B possess narrower size distribution
than that of product A. This is due to the lesser polarity
of solvent of product A than that of product B. Mixture
of two solvents (ethylene glycol and water) was used for
synthesis of product B while pure ethylene glycol was
used for synthesis of product A. Microparticles of product B was synthesized on organic-water interface, that’s
why product B possess narrower distribution than that
of product A. On the other hand, value of (FWHM)D
is smaller that of (FWHM)C because polarity of solvent used for synthesis of product D is lesser than that
of product C. The size distribution of graphs is compared from their respective value of FWHM. It means
size of particles decreases with increase in polarity while
FWHM value increases with increase in polarity. If
smaller size is obtained then size distribution becomes
large and if narrow size distribution is achieved then size
of particles become greater. Hence compromise on size
or distribution of particles is to be made.
Catalytic activity
The catalytic activity of Fe3O4 nano/micro particles was
investigated for dry as well as wet media processes. F
e3O4
nano/micro particles was used to catalyze the thermal
degradation of AP as dry media process and reduction of
4-NP as wet media process.
Catalytic thermal of degradation of ammonium perchlorate
The catalytic thermal decomposition of AP is carried out
by using the thermal gravimetric analysis (TG) (Fig. 8a).
Thermal decomposition temperature of pure AP is
Janjua et al. Chemistry Central Journal (2017) 11:49
Page 10 of 14
Fig. 6 SEM and TEM observations of irregular shaped Fe3O4 particles, a and b SEM images of the product E, c and d TEM images of the product
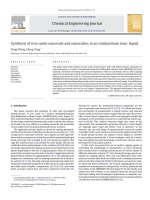
450 °C. It is observed that all the synthesized catalysts
have shown considerable catalytic activity. The thermal
degradation of AP is based on proton transfer mechanism. The degradation of the AP starts with the transfer
of charge among reactants. This charge transfer process
is a high energy phenomenon. The thermal energy provides energy to the charges to overcome the barrier and
transform the reactants into products. The F
e3O4 nano/
micro particles facilitate this charge transfer process. So
charges cross the barrier at low temperature in the presence of catalyst and convert the reactants into products.
The same mechanism is also proposed by Chaturvedi
et al. and Dey et al. for thermal degradation of AP in the
presence of metals [31, 32].
The catalyst A, porous hollow spheres with almost
140 nm diameter are proved to be the best among all of
these catalysts. It is shown in graph that final decomposition temperature for the porous hollow spheres is 310 °C.
There is almost 140 °C decrease in thermal decomposition temperature of AP when porous hollow are used as
catalyst. The thermal decomposition curve for this process is very smooth without any irregularities. Octahedral particles (catalyst D) showed lowest catalytic activity
among all catalysts. The final decomposition temperature of AP is measured to 420 °C in the presence of this
catalyst. There is a decrease of 30 °C in the final thermal
decomposition of AP. The other catalysts with their thermal decomposition temperatures are given in Table 1.
Loss in mass percentage of AP versus temperature is
shown in Fig. 8b. The extent of decomposition of AP is
clearly shown in this figure. This figure shows that the
temperature, at which maximum loss in mass percentage
AP has occurred, is different for different catalysts. Catalyst C (micro rectangular platelets) catalyzed decomposition is most significant because all the mass of AP
decomposed at once when temperature reached 373 °C.
While in case of remaining all the catalysts, decomposition of AP is not at once. After catalyst C, catalysts A
(hollow microspheres) and B (microspheres) also shows
a sharp loss in mass percentage of AP at temperature
329 and 286 °C respectively. But catalysts D and E show
no peak in Fig. 8b, it means a continuous decrease in
mass of AP occur over whole temperature range of
decomposition.
Catalyst A shows maximum decrease in thermal decomposition temperature of AP among all the
Janjua et al. Chemistry Central Journal (2017) 11:49
Page 11 of 14
Fig. 7 Size distribution histograms of synthesized product A–D
Fig. 8 a TG observations of decomposition of AP in the presence of Fe3O4 particles of different morphologies, and b temperature dependent plot
of loss in mass percentage of AP in the presence of Fe3O4 particles of different morphologies
Janjua et al. Chemistry Central Journal (2017) 11:49
catalysts. While catalyst C shows sharp loss in mass percentage of AP at temperature 373 °C among all the catalysts. Size of particles of catalyst A is smallest among
all catalysts and it shows good catalytic activity. Hence
product A can be considered as a best catalyst among all
the synthesized catalysts.
Catalytic reduction of 4‑nitrophenol
Reduction of 4-NP in aqueous media is used as a model
process to investigated the catalytic activity of F
e3O4
micro/nano particles in wet media. F
e3O4 nano/micro
particles catalyzed the reduction of 4-NP into 4-aminophenol (4-AP). 4-NP and 4-AP both absorb in UV–
Visible region because λmax of 4-NP and 4-AP are 400 and
300 nm respectively [33]. That is why the reduction of
4-NP is monitored by UV–Visible spectrophotometery.
Catalytic reduction of 4-NP in the presence of excess of
reducing agent NaBH4 obeys pseudo first order kinetics.
Its kinetic equation is ln(At/A0) = –kapp × t (where A0
and At are absorbance of 4-NP at time 0 and t and k app
is apparent rate constant of reduction). Time dependent UV–Visible spectra of reduction of 4-NP catalyzed
by catalyst A (hollow microsphere) is shown in Fig. 9a. It
is clearly visible from this figure that only one specie is
present in reaction mixture at time 0 min because spectra
possess only one peak at 400 nm. This shows that 4-NP
was present in reaction mixture initially. As soon as the
reduction of 4-NP progresses, the absorbance at 400 nm
is started to decrease while absorbance at 300 nm is
started to increase.
Page 12 of 14
The catalytic reduction of 4-NP is also studied in the
absence of catalyst (Fig. 10). It is observed that absorbance at 400 nm did not change appreciably till 26 min.
This shows that F
e3O4 catalyst facilitates the reduction of
4-NP, that is why the absorbance at 400 nm is decreased
to 0.6 after 26 min in the presence of catalyst (Fig. 9a).
Plot of ln(At/A0) as a function of time of reduction of
4-NP catalyzed by catalysts A–E is shown in Fig. 9b.
The reduction of 4-NP catalyzed by all catalysts A–E
was studied under same catalyst dosage, reactants concentration and temperature, so that the effect of particle
morphology on apparent rate constant (kapp) can be easily investigated. Initially the value of ln(At/A0) does not
decrease with time in all plots. This duration is known
as induction period. Then value of ln(At/A0) is started
to decrease with time which shows that catalytic reduction is in progress. Later the value of ln(At/A0) becomes
constant with the passage of time which shows that reaction has completed. The linear region of the plot of ln(At/
A0) versus time was used to calculate the value of k app of
reduction. The calculated values of kapp for the reactions
catalyzed by catalyst A–E are given in Table 1. These values of kapp are in the following order: A>B>C>D>E. This
might be due to the difference in their size and morphology. The size of product decreases in the following order:
A
with increase size. So number of active sites decrease
with increase in size. If small number of active sites are
present then small number of reactant molecules will
Fig. 9 a Time dependent UV–Visible spectra of reduction of 4-NP catalyzed by product A in aqueous medium. b Plot of ln(At/A0) versus time for
reduction of 4-NP catalyzed by product A–E [conditions: [4-NP] = 80 μM, [NaBH4] = 8 mM, [ Fe3O4] = 1 μg/L and temperature = 22 °C]
Janjua et al. Chemistry Central Journal (2017) 11:49
Page 13 of 14
0 min
1 min
2 min
3 min
4 min
5 min
6 min
7 min
8 min
9 min
10 min
11 min
26 min
1.2
Absorbance
1.0
0.8
0.6
0.4
0.2
0.0
250
300
350
400
Wavelength (nm)
450
500
Fig. 10 a Time dependent UV–Visible spectra of reduction of 4-NP in
the absence of catalyst [conditions: [4-NP] = 80 μM, [NaBH4] = 8 mM
and temperature = 22 °C]
adsorb and value of k app decrease resultantly. The value
of kapp of reduction catalyzed by catalyst A (porous hollow spheres) is greatest among all the products. Product
A is porous and possesses very small size, so it provides
very large surface area for catalysis. That is why it shows
maximum value of k app than that of all. The value of kapp
of catalysts D and E is almost same because their sizes
are almost same. This also confirms that value of k app
depends upon size.
Conclusions
The predominant morphologies of the F
e3O4 particles
synthesized are hollow nanospheres and microspheres.
Although other shapes including spherical aggregates,
octahedra, irregular structures and micro rectangular
platelets are also prepared by using different solvents
including ethylene glycol, water, n-hexane in different
ratios. Most of the products of F
e3O4 prepared are uniform in shape and size distribution, well separated from
each other and hollow from inside with thin but definite
boundaries. The catalytic activity of all the synthesized
catalysts is investigated for thermal decomposition of AP.
The results show that catalysts have very good surface
properties. Fe3O4 catalysts show a trend in catalytic thermal decomposition of AP. With increase in size of Fe3O4
particles, the catalytic properties gradually decrease and
particles with 140 nm size decrease the decomposition
temperature by 140 °C. It was also investigated that the
temperature at which maximum loss in mass percentage
of AP occurred. All the AP decomposed at once at 373 °C
by micro rectangular platelets catalyst. The rest of all
catalysts catalyzed the continuous decomposition of AP
over the complete range of temperature. All the catalysts
are also used as catalyst for reduction of 4-nitrophenol.
It is observed that value of k app of reduction is highest
for catalyst hollow microspheres and lowest for catalyst
rectangular platelets. It is also observed that value of kapp
is decreased with increase in size of particles. The above
results have shown that these catalysts can be efficiently
used for dry as well as wet processes.
Authors’ contributions
MRSAJ and SJ conceived and designed the study as well as performed
experiments for the synthesis and characterization. SRK and NJ performed the
experiments related to catalysis in wet and dry media. SJ and SRK wrote the
paper. SJ and NJ reviewed and edited the manuscript. All authors read and
approved the final manuscript.
Author details
1
Department of Chemistry, King Fahd University of Petroleum and Minerals
(KFUPM), Dhahran 31261, Kingdom of Saudi Arabia. 2 Laboratory of Superlight
Materials and Nano Chemistry, Department of Chemistry, University of Agriculture, Faisalabad 38000, Pakistan. 3 Punjab Bio Energy Project of Punjab
Government, University of Agriculture, Faisalabad 38000, Pakistan.
Acknowledgements
The authors would like to acknowledge the support provided by the Deanship of Scientific Research (DSR) at King Fahd University of Petroleum and
Minerals (KFUPM) for funding this work through Project No. SR161009.
Competing interests
The authors declare that they have no competing interests.
Publisher’s Note
Springer Nature remains neutral with regard to jurisdictional claims in published maps and institutional affiliations.
Received: 29 September 2016 Accepted: 25 May 2017
References
1. Abu-Youssef MA, Escuer A, Gatteschi D, Goher MA, Mautner FA, Vicente
R (1999) Synthesis, structural characterization, magnetic behavior, and
single crystal EPR spectra of three new one-dimensional manganese
azido systems with FM, alternating FM-AF, and AF coupling. Inorg Chem
38:5716–5723
2. Caneschi A, Gatteschi D, Lalioti N, Sangregorio C, Sessoli R, Venturi
G, Vindigni A, Rettori A, Pini MG, Novak MA (2001) Cobalt (II)-nitronyl
nitroxide chains as molecular magnetic nanowires. Angew Chem Int Ed
40:1760–1763
3. Beswick O, Yuranov I, Alexander DT, Kiwi-Minsker L (2015) Iron oxide nanoparticles supported on activated carbon fibers catalyze chemoselective
reduction of nitroarenes under mild conditions. Catal Today 249:45–51
4. Jain TK, Morales MA, Sahoo SK, Leslie-Pelecky DL, Labhasetwar V (2005)
Iron oxide nanoparticles for sustained delivery of anticancer agents. Mol
Pharm 2:194–205
5. Babes L, Denizot B, Tanguy G, Le Jeune JJ, Jallet P (1999) Synthesis of iron
oxide nanoparticles used as MRI contrast agents: a parametric study. J
Colloid Interf Sci 212:474–482
6. Rockenberger J, Scher EC, Alivisatos AP (1999) A new nonhydrolytic
single-precursor approach to surfactant-capped nanocrystals of transition metal oxides. J Am Chem Soc 121:11595–11596
7. Baalousha M, Manciulea A, Cumberland S, Kendall K, Lead JR (2008)
Aggregation and surface properties of iron oxide nanoparticles: Influence
of pH and natural organic matter. Environ Toxicol Chem 27:1875–1882
8. Obermayer D, Balu AM, Romero AA, Goessler W, Luque R, Kappe
CO (2013) Nanocatalysis in continuous flow: Supported iron oxide
Janjua et al. Chemistry Central Journal (2017) 11:49
9.
10.
11.
12.
13.
14.
15.
16.
17.
18.
19.
20.
nanoparticles for the heterogeneous aerobic oxidation of benzyl alcohol.
Green Chem 15:1530–1537
Freitas M, Viswanathan S, Nouws H, Oliveira M, Delerue-Matos C (2014)
Iron oxide/gold core/shell nanomagnetic probes and CdS biolabels for
amplified electrochemical immunosensing of Salmonella typhimurium.
Biosens Bioelectron 51:195–200
Hola K, Markova Z, Zoppellaro G, Tucek J, Zboril R (2015) Tailored functionalization of iron oxide nanoparticles for MRI, drug delivery, magnetic
separation and immobilization of biosubstances. Biotechnol Adv
33:1162–1176
Cantillo D, Moghaddam MM, Kappe CO (2013) Hydrazine-mediated
reduction of nitro and azide functionalities catalyzed by highly active and
reusable magnetic iron oxide nanocrystals. J Org Chem 78:4530–4542
Moghaddam MM, Pieber B, Glasnov T, Kappe CO (2014) Immobilized iron
oxide nanoparticles as stable and reusable catalysts for hydrazine-mediated nitro reductions in continuous flow. ChemSusChem 7:3122–3131
Mohapatra J, Mitra A, Tyagi H, Bahadur D, Aslam M (2015) Iron oxide
nanorods as high-performance magnetic resonance imaging contrast
agents. Nanoscale 7:9174–9184
Zhang S, Xu W, Zeng M, Li J, Li J, Xu J, Wang X (2013) Superior adsorption capacity of hierarchical ironoxide@ magnesium silicate magnetic
nanorods for fast removal of organic pollutants from aqueous solution.
Mater Chem A 1:11691–11697
Wu J, Liu L, Liu S, Yu P, Zheng Z, Shafa M, Zhou Z, Li H, Ji H, Wang ZM
(2014) High responsivity photoconductors based on iron pyrite nanowires using sulfurization of anodized iron oxide nanotubes. Nano Lett
14:6002–6009
Disch S, Wetterskog E, Hermann RP, Wiedenmann A, Vainio U, SalazarAlvarez G, Bergström L, Brückel T (2012) Quantitative spatial magnetization distribution in iron oxide nanocubes and nanospheres by polarized
small-angle neutron scattering. New J Phys 14:013025
Khosravi M, Azizian S (2014) Adsorption of anionic dyes from aqueous
solution by iron oxide nanospheres. J Ind Eng Chem 20:2561–2567
Jamil S, Janjua MRSA, Khan SR, Jahan N (2017) Synthesis, characterization
and catalytic application of polyhedron zinc oxide microparticles. Mater
Res Exp 4:15902–15910
Han S, Hu L, Liang Z, Wageh S, Al-Ghamdi AA, Chen Y, Fang X (2014) Onestep hydrothermal synthesis of 2D hexagonal nanoplates of α-Fe2O3/
graphene composites with enhanced photocatalytic activity. Adv Funct
Mater 24:5719–5727
Li H, Yin S, Wang Y, Sato T (2013) Microwave-assisted hydrothermal
synthesis of Fe2O3-sensitized SrTiO3 and its luminescent photocatalytic deNOx activity with CaAl2O4:(Eu, Nd) assistance. J Am Ceram Soc
96:1258–1262
Page 14 of 14
21. Gutierrez A, Manthiram A (2014) Microwave-assisted solvothermal
synthesis of spinel MV2O4 (M = Mg, Mn, Fe, and Co). Inorg Chem
53:8570–8576
22. Indira T, Lakshmi P (2010) Magnetic nanoparticles—A review. Int J Pharm
Sci Nanotechnol 3:1035–1042
23. Lu AH, Salabas EE, Schüth F (2007) Magnetic nanoparticles: synthesis,
protection, functionalization, and application. Angew Chem Int Ed
46:1222–1244
24. Campos EA, Cortez Fernandes MT, Kawachi EY, Sampaio de Oliveira JI,
de Cássia Lazzarini Dutra R (2015) Chemical and textural characterization
of iron oxide nanoparticles and their effect on the thermal decomposition of ammonium perchlorate. Prop Expl Pyrotech 40:860–866
25. Xu H, Wang X, Zhang L (2008) Selective preparation of nanorods and
micro-octahedrons of Fe2O3 and their catalytic performances for thermal
decomposition of ammonium perchlorate. Powder Technol 185:176–180
26. Alizadeh-Gheshlaghi E, Shaabani B, Khodayari A, Azizian-Kalandaragh Y,
Rahimi R (2012) Investigation of the catalytic activity of nano-sized CuO,
Co3O4 and CuCo2O4 powders on thermal decomposition of ammonium
perchlorate. Powder Technol 217:330–339
27. Sun S, Zeng H (2002) Size-controlled synthesis of magnetite nanoparticles. J Am Chem Soc 124:8204–8205
28. Lin AY, Young JK, Nixon AV, Drezek RA (2014) Encapsulated F e3O4/Ag
complexed cores in hollow gold nanoshells for enhanced theranostic magnetic resonance imaging and photothermal therapy. Small
10:3246–3251
29. McKenna KP, Hofer F, Gilks D, Lazarov VK, Chen C, Wang Z, Ikuhara Y (2014)
Atomic-scale structure and properties of highly stable antiphase boundary defects in Fe3O4. Nat Commun 5:9–10
30. Wright JP, Attfield JP, Radaelli PG (2002) Charge ordered structure of
magnetite Fe3O4 below the Verwey transition. Phys Rev B 66:214422
31. Dey A, Athar J, Varma P, Prasant H, Sikder AK, Chattopadhyay S (2015)
Graphene-iron oxide nanocomposite (GINC): an efficient catalyst for
ammonium perchlorate (AP) decomposition and burn rate enhancer for
AP based composite propellant. RSC Adv 5:1950–1960
32. Chaturvedi S, Dave PN (2013) A review on the use of nanometals as catalysts for the thermal decomposition of ammonium perchlorate. J Saudi
Chem Soc 17:135–149
33. Farooqi ZH, Khan SR, Begum R, Kanwal F, Sharif A, Ahmed E, Majeed S,
Ejaz K, Ijaz A (2015) Effect of acrylic acid feed contents of microgels on
catalytic activity of silver nanoparticles fabricated hybrid microgels. Turk J
Chem 39:96–107