RD-Metabolizer: An integrated and reaction types extensive approach to predict metabolic sites and metabolites of drug-like molecules
Bạn đang xem bản rút gọn của tài liệu. Xem và tải ngay bản đầy đủ của tài liệu tại đây (2.96 MB, 17 trang )
Meng et al. Chemistry Central Journal (2017) 11:65
DOI 10.1186/s13065-017-0290-4
Open Access
METHODOLOGY
RD‑Metabolizer: an integrated
and reaction types extensive approach
to predict metabolic sites and metabolites
of drug‑like molecules
Jiajia Meng1†, Shiliang Li1,2†, Xiaofeng Liu1, Mingyue Zheng3 and Honglin Li1*
Abstract
Background: Experimental approaches for determining the metabolic properties of the drug candidates are usually
expensive, time-consuming and labor intensive. There is a great deal of interest in developing computational methods to accurately and efficiently predict the metabolic decomposition of drug-like molecules, which can provide
decisive support and guidance for experimentalists.
Results: Here, we developed an integrated, low false positive and reaction types extensive metabolism prediction
approach called RD-Metabolizer (Reaction Database-based Metabolizer). RD-Metabolizer firstly employed the detailed
reaction SMARTS patterns to encode different metabolism reaction types with the aim of covering larger chemical
reaction space. 2D fingerprint similarity calculation model was built to calculate the metabolic probability of each site
in a molecule. RDKit was utilized to act on pre-written reaction SMARTS patterns to correct the metabolic ranking of
each site in a molecule generated by the 2D fingerprint similarity calculation model as well as generate corresponding structures of metabolites, thus helping to reduce the false positive metabolites. Two test sets were adopted to
evaluate the performance of RD-Metabolizer in predicting SOMs and structures of metabolites. The results indicated
that RD-Metabolizer was better than or at least as good as several widely used SOMs prediction methods. Besides, the
number of false positive metabolites was obviously reduced compared with MetaPrint2D-React.
Conclusions: The accuracy and efficiency of RD-Metabolizer was further illustrated by a metabolism prediction
case of AZD9291, which is a mutant-selective EGFR inhibitor. RD-Metabolizer will serve as a useful toolkit for the early
metabolic properties assessment of drug-like molecules at the preclinical stage of drug discovery.
Keywords: Sites of metabolism (SOMs), Metabolites, Reaction SMARTS patterns, 2D fingerprint similarity
Introduction
It is significant to know how drug candidates are metabolized in the body at early stages of the drug discovery
process, because both the drug safety and efficacy profiles
are greatly affected by human metabolism [1]. The druglike molecules can be either metabolized into their active
*Correspondence:
†
Jiajia Meng and Shiliang Li contributed equally to this work
1
State Key Laboratory of Bioreactor Engineering, Shanghai Key
Laboratory of New Drug Design, School of Pharmacy, East China
University of Science and Technology, Shanghai 200237, China
Full list of author information is available at the end of the article
forms to actually interact with the therapeutic targets,
or converted into inactively execrable metabolites [1]. In
addition, the metabolic modifications can also bring toxicity, which is one of the major reasons for failure in drug
development. Furthermore, metabolic liability is also
related to other critical issues, for example drug–drug
interactions, food–drug interactions and drug resistance
[2–4]. Therefore, it is of great importance to determine
the metabolic properties of the drug candidates earlier.
However, experimental approaches for determining those
properties are usually expensive, time-consuming and
labor intensive [5]. Thus, there is a great deal of interest
© The Author(s) 2017. This article is distributed under the terms of the Creative Commons Attribution 4.0 International License
( which permits unrestricted use, distribution, and reproduction in any medium,
provided you give appropriate credit to the original author(s) and the source, provide a link to the Creative Commons license,
and indicate if changes were made. The Creative Commons Public Domain Dedication waiver ( />publicdomain/zero/1.0/) applies to the data made available in this article, unless otherwise stated.
Meng et al. Chemistry Central Journal (2017) 11:65
in developing computational methods to accurately and
efficiently predict the metabolic decomposition of druglike molecules [6–9].
The investigations of SOMs and structures of metabolites are two main research directions of computer-aided
metabolism prediction methods, which can provide decisive support and guidance for experimentalists [10]. The
prediction methods of SOMs usually have higher prediction accuracy. For example, MetaSite [11], a commercial software package, utilizes GRID-derived molecular
interaction fields (MIFs) of protein and ligand, protein
structural information, and molecular orbital calculations to estimate the likelihood of metabolic reaction at a
certain atom position, with a success rate of 85% for tagging a known SOM among the top-2 ranked atom positions. Rydberg et al. [12–14] implemented SMARTCyp as
a fast SOMs predictor. The predictor contains a reactivity
lookup table of pre-calculated density functional theory
(DFT) activation energies for plenty of ligand fragments
that are undergoing a CYP3A4 or CYP2D6 mediated
transformation. SMARTCyp performs a fast reactivity
lookup for the query compound, in conjunction with a
topological accessibility descriptor to provide a final SOM
ranking. As a result, SMARTCyp identified 76% of SOMs
over a dataset of 394 compounds with the top-2 metric.
RegioSelectivity (RS)-predictor is developed by Zaretzki
et al. [15, 16], which employs a set of 392 quantum chemical atom-specific and 148 topological descriptors, and a
support vector machine (SVM)-like ranking in combination with a multiple instance learning method to determine potential SOMs. Using the top-2 metric, 78% of
SOMs were identified over a test set of 394 compounds.
MetaPrint2D [17–20] identifies the reaction center atoms
for the substrates recorded in biotransformation database
through the maximum common substructure method.
Each substrates atom and reaction center atom is encoded
in a six-level topological fingerprint. Therefore, two fingerprint databases are yielded in this process. For a query
molecule, it is firstly converted into fingerprints, then the
fingerprint of each atom is matched against the above
two fingerprint databases. By comparing the similarity of
fingerprint, the number of hits in each database can be
counted. Finally, the metabolic likelihood of each atom in
the query molecule is derived. About 70–80% of SOMs
in the test compounds are correctly predicted among the
three highest-scored atom positions. Quite impressive
results can be obtained by these computational methods,
however, most of these approaches are limited to CYP450
catalyzed reactions, and only labile sites rather than structures of metabolites can be predicted. Moreover, predicted SOMs are not equivalent to identifying the correct
biotransformation that would take place at a certain atom
position, and they provide no information about which
Page 2 of 17
reaction type will take place. Therefore, these limitations
make it difficult to draw any quantitative conclusions on
the metabolic liability of a certain molecule [10]. Besides,
these methods are also less suitable for routine use to support experimental identification of metabolites.
Predicting the structures of metabolites by computational approaches in advance can decisively help medicinal chemists analyze the experimentally-determined mass
spectrometry (MS) data or liquid chromatography/tandem mass spectrometry (LC–MS/MS) data to pinpoint
the actual SOMs [21]. However, only very few computational methods to predict structures of metabolites have
been developed so far. These prediction approaches are
usually clustered into three categories: expert systems,
fingerprint-based data mining approaches and combined approaches. Expert systems mainly employ generic
metabolic rules derived by expert to predict structures
of metabolites. Typical examples of expert systems are
META [22–24], MetabolExpert [25], Meteor [26], SyGMa
[27], TIMES [28]. For the fingerprint-based data mining approaches, MetaPrint2D-React [18], an extension
of MetaPrint2D, is a typical and representative method.
It is and allows users to predict structures of metabolites
on the basis of generic metabolic reaction rules. Tarcsay
et al. [29] firstly adopt the best setup of the expert system
MetabolExpert [25] to generate possible metabolites for
the query compound. Then the docking program GLIED
[30] as a postprocessing filter is employed to reduce the
false positive rate. This combined approach brings a success rate of 69% for identifying the correct metabolites
among the three highest-ranked structures. Although
these methods have an advantage in speed or correctly
generating structures of metabolites, there still exist several challenges. The main drawback of expert system is
the combinatorial explosion problem, because all possible combinations of metabolic rules permitted by the
reaction rule sets are considered. The disadvantage of fingerprint-based data mining method is that generic metabolic transformation rules are so simple that they cannot
describe complex reaction types and cannot cover larger
chemical reaction space. The method combined with
docking is impractical for many applications, due to its
time-consuming and structure-dependent features.
The main contribution of this work is a description of
Reaction Database-based Metabolizer (RD-Metabolizer),
an integrated, low false positive and reaction types extensive approach for predicting metabolic sites and metabolites of drug-like molecules. In order to cover larger
chemical reaction space, the detailed reaction SMARTS
patterns were firstly employed to describe simple and complex reactions recorded in the biotransformation databases.
2D fingerprint similarity calculation model was built to calculate the metabolic probability of each site in a molecule.
Meng et al. Chemistry Central Journal (2017) 11:65
Meanwhile, RDKit [31], an open-source chemical information software, was utilized to act on pre-written reaction SMARTS patterns to correct the metabolic ranking of
each site in a molecule and generate corresponding structures of metabolites. In comparison studies, RD-Metabolizer performed slightly better than or at least as good as
several widely used SOMs prediction methods in terms
of SOMs prediction accuracy. And compared with other
metabolite prediction method, the number of false positive
metabolites generated by RD-Metabolizer was also obviously reduced. A specific metabolism prediction example
of AZD9291 [32] further indicated its robustness in SOMs
identification and metabolites generation, and also confirmed its potential applications for metabolism prediction.
Experimental methods
The framework of RD-Metabolizer is illustrated in Fig. 1.
Firstly, the query molecule is converted into suitable fingerprint to fit for the fingerprint-based similarity calculation model. Secondly, the fingerprint of each atom in the
Page 3 of 17
query molecule is matched against two topological atom
fingerprint database. One database comprises all the
atomic fingerprints of the substrates, and the other one
contains all the reaction centers that marked with reaction SMARTS patterns. By calculation of the fingerprint
similarities, the total numbers of similar fingerprints in
the above two fingerprint databases are counted respectively, meanwhile, the corresponding reaction SMARTS
patterns are obtained from the latter database. Thirdly,
because the calculated similar fingerprints do not always
represent the similar chemical environment of the corresponding sites, RDKit is firstly applied to check whether
the calculated similar fingerprints are indeed similar
with each other. If the structures of metabolites can be
generated by RDKit through manipulating the reaction SMARTS patterns obtained from the previous step,
the calculated similar fingerprints are proved to be true
similar pairs. If not, they are identified as dissimilar fingerprints, and the number is counted. Finally, the reaction occurrence ratio of each site in the query molecule
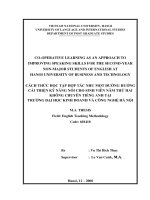
Fig. 1 Schematic representation of RD-Metabolizer workflow for SOMs and metabolites prediction. (A) Convert query compound to topological atom fingerprints; (B) search the two fingerprint databases by 2D fingerprint similarity calculation model, thus respectively get the number of
similar fingerprints from two databases and the corresponding reaction SMARTS patterns from the reaction center topological atom fingerprint
database; (C) check if RDKit can act on the reaction SMARTS patterns, then count the number of dissimilar fingerprint and generate corresponding
metabolite structures of each site; (D) adjust the number of similar fingerprints and calculate occurrence ratio of each site
Meng et al. Chemistry Central Journal (2017) 11:65
is calculated and normalized. Further details of the RDMetabolizer workflows are described below.
Data sources
Dataset used in the present study was extracted from MDL
metabolic reaction database [33] and integrity database
[34], which both included metabolic transformations of
xenobiotic compounds harvested from the literatures. The
dataset generation procedure was as follows: (1) repeated
reactions were handled (only used single-step and unique
reactions to avoid data redundancy); (2) molecules in reactions must have a complete chemical structure, thus reactions that reactant or product had “R” substituents or free
radical were excluded; (3) reactions that reactant or product was invalid were processed (i.e. reactant or product
was labeled with “No Structure”); (4) chelation reactions
and reactions with ambiguous reaction centers were also
excluded (No reaction SMARTS pattern could express
these reactions); (5) reactions that reactant or product
was a single element (i.e. metallic element) were removed.
Finally, 63,620 individual metabolic reactions were retained
as the metabolic reaction dataset for further study.
Preparation of test sets
We randomly selected 425 different substrate molecules
from the metabolic reaction dataset to be internal test set
(test set 1). After remove the metabolic reaction records
of these 425 substrate molecules, the rest of the metabolic
reaction records were used to generate the two topological fingerprint databases required by RD-Metabolizer.
The external test set (test set 2) compiled by Zaretzkiet
et al. [16] was used for further method validation. For the
external test set, some structures were found identical to
those in our training sets, and thus removed. As a result,
the external test set contained 173 compounds. Besides,
all the test compounds were carefully checked to ensure
the correctness of their 2D structures. Wrong structures
were corrected by manually searching different databases, such as DrugBank [35] and PubChem [36].
Identification of SOMs and generation of reaction SMARTS
patterns
For the databases, all data are curated in the form of metabolic reactions and no SOMs are explicitly reported, so the
SOMs information needs to be derived. A SOM refers to the
place in a molecule where the metabolic reaction occurs. In
order to identify a SOM, the exact or determinable biotransformation mechanism needs to be known. However, many
biotransformation mechanisms of metabolic reactions are
still beyond understanding and information on SOMs is
very sparse, especially for enzymes other than CYP450s
[37]. There are two main methods to identify SOMs. One
is maximum common substructure method. This method
Page 4 of 17
firstly examines the maximum common substructure of
the substrate and the product, and then deviations from
the maximum common substructure in either substrate
or product are identified as reaction sites [18]. The other
method is based on the calculation of activation energies
of ligand fragments. It is reported that the lower the activation energies are, the more likely a site is to be metabolized
[12]. In our study, for simple biotransformation reactions,
we manually compared structures of reactant and product
in each pair of metabolic reactions to determine SOMs. Any
positions of a reactant molecule where a heavy atom was
added, removed, or altered were intuitionistic regarded as
SOMs. For example, for O,N,S-demethylation reactions, we
took heteroatom (O,N,S) as metabolic reaction center atom.
However, for some complex biotransformation reactions,
we could not directly determine their SOMs by visual comparison. Therefore, we extracted the SOMs according to
the structural changes of reactant and product represented
in reaction SMARTS patterns. Reaction SMARTS pattern is analogous to Daylight SMARTS language [38] enabling description of biotransformation reactions. Reaction
SMARTS pattern can describe partial structures of reactant and product molecules, and specify atom mappings of
structures. Some examples of simple and complex biotransformation reactions by means of reaction SMARTS patterns
to identify SOMs are shown in Table 1.
Generation of fingerprint databases
For the purpose of modeling, we need two fingerprint databases: topological atom fingerprint database of all substrates
and topological atom fingerprint database of all reaction
centers with reaction SMARTS patterns. Molprint2D fingerprint [39, 40] was used in the present study because of its
ability in representing the chemical environment occupied
by atoms and satisfying requirement of quantitative calculation. The generation process of two fingerprint databases
was presented below. Firstly, Molprint2D fingerprints of all
substrates were generated by Pipeline Pilot 7.5 (Accelrys San
Diego, California) with the fingerprint layer of each atom set
to six. For the molecules whose fingerprint layers of some
atoms were less than six, the character “A” was added manually to the missing layers of the atoms in those molecules to
meet the requirement of quantitative calculation. Secondly,
the topological atom fingerprint database of all substrates
was generated by a python script, which counts occurrence
frequencies of atom types in each layer. In this work, atom
types were made up of the 33 Tripos mol2 atom types [41]
and other atom types that presented in the metabolic reactions, such as As, Pt, Co, Mn, Zn, Se, Ge, Sn, Gd and B.
Celecoxib [42], a non-steroidal anti-inflammatory drug, was
selected as an example of the construction of six layers topological atom fingerprints (Fig. 2). Thirdly, SOMs of all substrates were identified by using the method described above,
Meng et al. Chemistry Central Journal (2017) 11:65
Page 5 of 17
Table 1 Examples of identifying SOMs of simple and complex biotransformation reactions through reaction SMARTS pattern
Reaction description
Hydroxylation
Methylation
Acylation
Phase II Conjunction
Beta-oxidation
Dealkylation
Dehalogenation
Decarboxylation
Cyclization
Ring opening
Aromatization
Example transformations
Reaction SMARTS pattern
[c:1]>>[c:1][OH]
[C:1][N:2]([CH3])[CH3]
>>[C:1][N+:2]([O-])([CH3])[CH3]
[c:1][N;H2:2]
>>[c:1][N;H1:2]C(=O)C
[c:1][OH:2]
>>[c:1][O:2]S(=O)(=O)O
[C:1][C:2][C:3]([CH3])[C:4]
>>[C:1][C:2](=O)O.[C:3][C:4]
[c:1][O:2][C:3][C:4]
>>[c:1][O:2].[C:3][C:4]
[c:1]I>>[c:1]
[c:1]([C:2][O:3])[c:4]([C:5](=O)[OH])
>>[c:1]1[C:2][O][C:5](=O)[c:4]1.[O:3]
[c:1]([C:2][O:3])[c:4]([C:5](=O)[OH])
>>[c:1]1[C:2][O][C:5](=O)[c:4]1.[O:3]
[C:1]1[C:2][C:3][C:4](=O)[N:5]1
>>[C:1](=O)[C:2][C:3][C:4](=O)[N:5]
[C:1]1[C:2]=[C:3][N:4][C:5]=[C:6]1
>>[c:1]1[c:2][c:3][n:4][c:5][c:6]1
Meng et al. Chemistry Central Journal (2017) 11:65
Page 6 of 17
Table 1 continued
Reaction description
Example transformations
Reaction SMARTS pattern
[cH:1]1[c:2][c:3][cH:4][c:5]([OH])[c:6](O)
Tautomerization
>>[C:1]1=[C:2][C:3]=[C:4][C:5](=O)[C:6]1(=O)
[C:1]=[C:2][CH2:3][CH2:4]
Dehydrogenation
>>[C:1]=[C:2][CH:3]=[CH:4]
[c:1][C:2](=O)[N:3][C:4]
Hydrolyzation
>>[c:1][C:2](=O)[OH].[N:3][C:4]
[C:1][C:2]=[C:3]
Epoxidation
>>[C:1][C:2]1[C:3]([O]1)
[C:1][C:2][C:3][NH2]
Deamination
>>[C:1][C:2][C:3](=O)[OH].[NH2]
Bold red in the square brackets: atoms that have structural variations are represented in the reaction SMARTS pattern. Red circle in molecule: based on the reaction
SMARTS patterns, the corresponding reaction centers are labeled
then Molprint2D fingerprints of SOMs were extracted
and correspondingly compiled reaction SMARTS patterns
were subsequently added to the next layer. Molprint2D fingerprints of SOMs and corresponding reaction SMARTS
patterns were both stored in text files. Moreover, the topological atom fingerprint database of all reaction centers with
reaction SMARTS patterns was also built by a python script.
Occurrence ratio calculator
After generation of the topological atom fingerprints
for the query compound, the fingerprint of each atom
in query compound was matched against the two fingerprint databases. In the present work, we built a 2D
fingerprint similarity calculation model to calculate the
metabolic occurrence ratio of each atom in the query
compound. The similarity calculation model was composed of three similarity operators, namely Exact match
operator, Soergel metric operator [43, 44] and Hamming
metric operator [45], to compare the fingerprint matrices. In order to compute fast and ensure the existence of
cored substructures that are key for determining whether
the two fingerprint are similar, the Exact match operator
was firstly performed, which requires the layers in two
fingerprint matrices to be exactly the same (top three layers were adopted in our method), thus the fingerprints
that do not match top three layers can be rejected
quickly. Then, the Soergel metric operator and the Hamming metric operator were employed. Finally, the number
of similar fingerprints in each database was counted.
The Soergel metric and the Hamming metric between
two fingerprints a and b, for the jth row, were defined as
Eqs. (1) and (2). The finally scoring function can be represented by the sum of weighted scores for the each level,
which defined as Eq. (3).
33
a b
n=1 Fj,n Fj,n
2
2
a Fb
b
a
− Fj,n
+ Fj,n
Fj,n
j,n
dj = 1.0 −
(1)
33
a
b
Fj,n
− Fj,n
dHam,j =
(2)
n=1
5
dtotal =
j
dj × dHam,j
(3)
j=0
where
j is a weighting coefficient that can be used to
adjust the significance of each row of the fingerprints and
formulated as following:
Meng et al. Chemistry Central Journal (2017) 11:65
Page 7 of 17
Fig. 2 Construction of six layers topological atom fingerprint. The starting layer is an N atom (sybyl atom type: N.ar) in the red circle . The successive
layers range from orange to yellow, green, blue, and violet. Atoms lying far away from the six-layer are not considered. Below the fingerprint matrix
represents the counts of SYBYL atoms types and another 9 atoms that involved in metabolic reactions at each layer. The rows are colored according
to the same color scheme of the figure above
=
2
total
e
−1
+
total
2
−1
(4)
where λ ≥ 1 and the total number of levels, λtotal = 6 [43].
In this study, two fingerprints were considered to be
similar if the scoring function dtotal ≤ 3.5 [dtotal was range
from 0 (identity) to ∞ (maximum diversity)]. When dtotal ≤ 3.5, the false negatives were the least for a set of
tested fingerprints.
The calculations of occurrence ratios and normalized
occurrence ratio are the same as those applied by Boyer
et al. [18] and defined as Eqs. (5) and (6).
ri = (n − x)/(m − x)
(5)
p = ri /max(ri )
(6)
where m is the number of similar fingerprints that was
searched from the topological atom fingerprint database of all substrates for the ith atom; n is the number
of similar fingerprints that was searched from the topological atom fingerprint database of all reaction centers
for the ith atom, and x represents the number of dissimilar fingerprints, which is the corrected result by calling
RDKit to manipulate the pre-written reaction SMARTS
patterns.
In our study, we used the following division rules
to distinguish the metabolic possibilities [18]: very
unlikely, 0 ≤ p < 0.15; unlikely, 0.15 ≤ p < 0.33; likely,
0.33 ≤ p < 0.66; very likely, 0.66 ≤ p < 1.00.
Results and discussion
In order to correctly predict structures of possible
metabolites of the query compound, SOMs should be
correctly identified at first. Benefited by the combination of the 2D similarity calculation model and the
pre-written reaction SMARTS patterns, the SOMs and
metabolites prediction performance of RD-Metabolizer
are investigated.
Prediction of metabolic sites
There are two main methods to evaluate the prediction performance of SOMs: qualitative analysis and
Meng et al. Chemistry Central Journal (2017) 11:65
quantitative analysis [12, 16, 17, 46, 47]. Qualitative
analysis mainly rely on visual inspection, namely, the predicted results of a method is compared with the known
metabolic sites of the molecules. Quantitative analysis
refers to the percentage of molecules for which at least
one of the top k (usually k = 1–3) ranked sites is an
experimentally observed SOM. However, this index often
depends on the size of the molecules, and the number of
metabolic sites, which will result in a tendentious prediction. Prediction of SOMs can be treated as a classification
problem: each site in a molecule is either a metabolic site
or not. Therefore, in order to overcome the bias of top k
metric, an overall measurement index called area under
the curve (AUC) of the receiver operating characteristic
(ROC) for SOMs prediction assessment is proposed [17].
This method was also applied in our study.
We compared the performance of RD-Metabolizer
with some widely used SOMs prediction methods, such
as MetaPrint2D (version 1.0), SMARTCyp (version
2.4.2) and RS-predictor (combined model). Default settings were used for the three methods. For test set 1, our
method performed as well as MetaPrint2D, but better
than SMARTCyp and RS-predictor at all the top three
layers (Fig. 3a). Both RD-Metabolizer and MetaPrint2D
are fingerprint-based data mining approaches that depend
on the size of metabolite database, thus they have similar
performances. The poorer prediction ability of SMARTCyp is mainly attributed to its limited range of reactions
(only phase I redox reactions). Therefore, SMARTCyp is
less sensitive to the polar groups, which are easily conjugated with the endogenous cofactors and occur phase II
Page 8 of 17
metabolism. Although RS-predictor established different
CYP450 isoforms prediction models, we cannot know
in advance which isoforms of CYP450 will participate in
the metabolic reactions. Actually, one or more CYP450
isoforms may be involved in the metabolism of xenobiotic and endogenous compounds. That’s why we chose its
combined model to compare with our method rather than
a specific CYP450 isoform prediction model.
As for test set 2, the top-k (k = 1–3) prediction rates
of RD-Metabolizer are better than MetaPrint2D and RSpredictor (Fig. 3b). Although the top-1 prediction rate of
RD-Metabolizer for test set 2 is inferior to SMARTCyp,
both top-2 and top-3 prediction rates of RD-Metabolizer
are comparable with SMARTCyp. Compared to the top-2
and top-3 prediction rates, there may be three reasons
causing the difference in the top-1 prediction rate of
RD-Metabolizer and SMARTCyp. Firstly, the definition
of SOMs between RD-Metabolizer (reaction SMARTS
pattern-based) and SMARTCyp (mechanism-based) is
different. For example, in the case of N-/O-dealkylation,
RD-Metabolizer ranks the heteroatom higher than the
carbon atom, while SMARTCyp takes the carbon atom
that connect to the heteroatom as reaction center. Secondly, RD-Metabolizer is a fingerprint similarity-based
method, and predictions cannot be performed about
novel atomic sites where the topological fingerprint does
not exist in the two databases we built. Thirdly, after
examination, it is found that compounds in the test set
2 are mainly involved in phase I metabolism, while two
fingerprint databases of RD-Metabolizer we built contain
fingerprints of both phase I and phase II metabolic sites.
Fig. 3 Comparison of SOM prediction performance of RD-Metabolizer and other predictors. Histograms show the correct prediction ratios a for
test set 1 and b for test set 2 at the top-k (k = 1, 2, 3) metric, respectively
Meng et al. Chemistry Central Journal (2017) 11:65
Page 9 of 17
Therefore, some polar sites of the compounds in test set
2 may bring impact on the final metabolic site rankings.
ROC curve was made for test set 1 and 2 to discuss the
performance of RD-Metabolizer in terms of distinguishing metabolic sites from non-metabolic ones, and the
corresponding overall AUC values were obtained (Fig. 4).
Besides, the mean AUC and median AUC values were
also calculated. The ROC curves obtained by our method
are higher than the average diagonal, and the overall
AUC values for test set 1 and 2 are close to each other
(0.785 vs 0.790). Specifically, the mean AUC values for
test set 1 and 2 are 0.811 and 0.831 respectively; meanwhile, the corresponding median AUC values are 0.852
and 0.913. Collectively, the AUC values demonstrated
that our method has good performance in distinguishing
metabolic sites from non-metabolic ones.
Prediction of structures of metabolites
To quantitatively assess the performance of RD-Metabolizer in predicting structures of metabolites, we not only
measured its ability to reproduce the experimentally
determined metabolites (i.e. the recall) from the top-k
(k = 1, 3) ranking list, but also measured the enrichment
rates of these correct metabolites in the top-k (k = 1, 3)
positions, namely the precision. Besides, F1-Measure was
applied and served as comprehensive performance evaluation index. The corresponding calculation formulas are
defined as following:
top-k:recall
The number of real metabolites in the top-k position
=
The total number of experimental metabolites
(7)
top-k:precision
The number of real metabolies in the top-k position
The total number of predictive metabolites in the top-k position
=
(8)
top-k:F 1-Measure =
Fig. 4 ROC curve of SOMs predictions for test set 1 (blue) and test set
2 (green). Test set 1 is the internal test set that contains 425 different
randomly selected substrate molecules from the metabolic reaction
dataset. Test set 2 is the external test set that contains 173 compounds and was previously compiled by Zaretzkiet et al. [16]
2 ∗ precision ∗ recall
precision + recall
(9)
At the same time, because the development of RDMetabolizer was aimed at decreasing the number of false
positive metabolites in predictions, we counted the total
numbers of false positive metabolites for all molecules in
the test set, with corresponding SOMs of these metabolites ranking in the top-k (k = 1, 3) position.
MetaPrint2D-React, which is one of the most commonly
used methods for prediction of structures of metabolites, was selected to be compared with our method. Only
test set 1 was employed to evaluate the prediction performances of RD-Metabolizer and MetaPrint2D-React,
because test set 2 offered no information about the structures of metabolites. The prediction results for test set 1
are shown in Table 2. The two methods obtained similar
performance in recall: 21.7% (RD-Metabolizer) and 20.6%
(MetaPrint2D-React) of the metabolites were reproduced
from the top-1 position. But RD-Metabolizer performed
better than MetaPrint2D-React in precision: 30.6 and
22.9% of the predicted metabolites at rank 1 were experimentally observed. As a result, RD-Metabolizer exhibited
Table 2 Prediction results of the metabolites for test set 1
Test set 1
Top-1
Top-3
Recall
Precision
F1-Measure
RD-Metabolizer
0.217
0.306
0.254
MetaPrint2D-React
0.206
0.229
0.217
a
FPa
Recall
Precision
F1-Measure
FPa
802
0.355
0.241
0.287
1823
1133
0.349
0.162
0.221
2953
FP is the total number of predicted false positive metabolites in the top-k (k = 1, 3) position for all molecules in test set 1
Meng et al. Chemistry Central Journal (2017) 11:65
superior performances than MetaPrint2D-React, which
can be indicated by the value of F1-Measure. In addition,
similar results could also be found from the top three ranking position. When interpreting the low values of recall
and precision, the considerable variability in the metabolism reaction data for different parent molecules should
be taken into account. Some compounds have been widely
studied, resulting in the presence of more than 10 metabolites in test set 1. However, for the majority of compounds,
only fewer than three metabolites have been reported.
More importantly, the number of false positive metabolites generated by RD-Metabolizer was far lower than
the number that generated by MetaPrint2D-React, indicating that we have already realized the anticipated purpose of developing RD-Metabolizer (Table 2). Some
factors were responsible for the generation of false positive metabolites. RD-Metabolizer is one of the fingerprint-based data mining approaches, thus there may exist
combination explosion problems for some reactions. For
example, molecules containing phenolic hydroxyl group
will be cleared from the body by making conjunction
with one or more endogenous cofactors, such as glucose
acid, sulfonic acid, amino acid, acetyl coenzyme A and
glutathione. RD-Metabolizer was insensitive to the different chemical environments of the phenolic hydroxyl
groups. It applied all conjugation reactions about phenolic hydroxyl groups in the databases for the query
compound, and thus resulting in many unexpected
metabolites. Therefore, it was extremely important for
this category of metabolic reactions to be further refined
and split by reaction SMARTS patterns to decrease the
number of false positive metabolites. In additions, the
incorrectly predicted SOMs also became the causes of
the generation of unexpected metabolites. The accuracy
of our method was largely influenced by the diversity of
the fingerprint database we built. If the query molecule
had some novel atomic fingerprint environments that
are exactly the reaction centers, RD-Metabolizer would
assign these atoms a normalized occurrence ratio of 0.0.
Therefore, some other atoms in the molecule would have
higher (than zero) normalized occurrence ratio and be
top-ranked, even when the likelihood of their being a
metabolic sites is very low [17]. Subsequently, some false
positive metabolites would be generated.
Page 10 of 17
metabolic reaction occurs was usually affected by its surrounding environment. Therefore, the introduction of the
exact match operator was mainly to ensure the existence
of small and identical surrounding environments for the
reaction centers. Besides, the use of exact match operator
for the top three layers of the fingerprint matrices was in
accordance with the writing habit of the reaction SMARTS
patterns for the fingerprint environments of the reaction
centers, leading to improved computational efficiency.
To explore whether it’s the optimal option to keep the
top three rows of fingerprints the same for the exact
match, we tested the performances of RD-Metabolizer
with various layers of fingerprint to be identical using test
set 2. The AUC value for each molecule was calculated,
and the distributions of the AUC scores were analyzed
by kernel density estimation [48, 49]. The kernel density
estimation method analyzes the data distribution without using the prior knowledge of data distribution and
without making any assumptions to data distribution. It
studies data distribution from samples themselves, that’s
why we selected this method to present the AUC distributions. We can clearly find that when the number of exact
matching fingerprint levels is less (level = 1, 2, 3), the distribution is unimodal with the peak of AUC around 1.0,
and exact match of the top three fingerprint levels has
the highest probability density (Fig. 5). While the number
of exact matching fingerprint levels is more (level = 4, 5,
6), the distribution is predominantly bimodal, with the
peaks of AUC around 0.5 and 1.0. The estimation ability of RD-Metabolizer will be weakened, because such
a search requiring exact matches to so many fingerprint
levels returns little or no similar fingerprints for many
of the atom environments in the test set, leading to an
The influence of the number of fingerprint layers
on prediction results
Compared with the 2D fingerprint similarity model built
in SPORCalc (former version of MetaPrint2D) [43], an
exact match operator was introduced to establish the fingerprint similarity model in our method. The exact match
operator required that the corresponding top three rows in
two fingerprint matrices are exactly the same. A site where
Fig. 5 Kernel density estimation showing the changes in distribution of AUC scores for RD-Metabolizer predictions as the number of
fingerprint levels to match exactly is varied
Meng et al. Chemistry Central Journal (2017) 11:65
obvious peak of AUC around 0.5. The exact match of top
one or two fingerprint levels provides little surrounding
information, thus resulting in many false positive results
generated by RD-Metabolizer. Therefore, their probability
densities are lower than those of the exact match of top
three fingerprints levels at the peak around 1.0. Overall,
the results indicate that exact match of the top three fingerprint levels can bring best prediction results.
Influence of molecular size
The prediction of SOMs becomes gradually difficult as the
number of heavy atoms in a molecule increases. An ideal
model would be able to correctly identify SOMs independent on the size of a molecule [37]. Therefore, we investigated the influence of molecular size on the prediction
results of our method. Using the top-1 metric, the percentages of successfully predicted SOMs for the molecules
from test set 1 and 2 both decreased as the molecular sizes
increased (Fig. 6). When using the top-2 metric, the percentage of successfully predicted SOMs for the molecules
from test set 1 went up slightly first, and then went down
slightly, after the atom numbers are larger than 15. And the
prediction accuracy reached its local peak when the atom
numbers are increased to 35. A similar trend could also be
observed using the top-3 metric, with more than 90 and
80% of the SOMs for the molecules from test set 1 and test
set 2 being correctly predicted respectively. The results
directly indicated that with the top-3 metric, RD-Metabolizer has a good predicting ability for drug-like molecules
that have heavy atoms up to 35.
Significance of detailed reaction SMARTS pattern
In order to generate the structures of metabolites for the
drug-like molecules, RD-Metabolizer needed to call two
functions of RDKit to manipulate the pre-written detailed
reaction SMARTS patterns. The detailed reaction
Page 11 of 17
SMARTS patterns contributed significantly to the prediction accuracy of RD-Metabolizer. To our knowledge, the
current metabolites prediction methods usually utilized
a generic reaction SMARTS pattern to represent a certain kind of metabolic reactions. For example, they used
[*:1] ≫ [*:1]-[OH] to represent hydroxylation reaction.
This is convenient to express simple metabolic reactions,
but difficult to represent complex reactions in chemical
reaction space, such as ring reaction types. Therefore, we
employed the detailed reaction SMARTS pattern in our
study. On one hand, it can make up the defects of Molprint2D fingerprint, which ignores H atom and is unable
to identify ring structures. For example, the two N atoms
labeled with red circles (Fig. 7) have dissimilar chemical
environment, but the representations of Molprint2D fingerprint of those two N atoms are the same. If there is no
clear differentiation, it will produce false positive results.
However, the reaction SMARTS pattern enables flexible
definitions for element, valence, aromaticity, charge, ring
memberships of atoms, bond order and ring membership
of bonds, and allows definition of metabolism reaction
rules, which can describe specific chemical environment of reaction center. Therefore, the detailed reaction
SMARTS patterns are employed to successfully distinguish those two N atoms labeled with red circle (Fig. 7).
On the other hand, the detailed reaction SMARTS pattern can encode complex metabolism reaction types,
such as ring reaction types (Table 3). It is reported that
Quinapril has two metabolites (Fig. 8a), including Dioxopiperazine derivatives and quinaprilat [50, 51]. The two
metabolites’ structures were successfully predicted by
RD-Metabolizer (Fig. 8b), while MetaPrint2D-React only
generated the quinaprilat one (Fig. 8c). This case demonstrated that by using the detailed reaction SMARTS
pattern, RD-Metabolizer is capable to deal with more
complex metabolic reaction types and will no doubt has
a broader application.
Case study
Fig. 6 Percentage of correctly predicted molecules with respect to
their size for test set 1 and test set 2
RD-Metabolizer was applied to the compound AZD9291
to further illustrate its practical application in medicinal chemistry. AZD9291 (Osimertinib) is a novel, selective third-generation irreversible inhibitor of Epidermal
Growth Factor Receptor (EGFR), which can overcome
T790M-mediated resistance. A survey of the literatures
available showed that AZD9291 was metabolized into
two metabolite species: AZ5104 and AZ7550 (Fig. 9a)
[32, 52]. Among them, AZ5104 is the main metabolite and acts as another potent inhibitor of EGFR. The
results of prediction illustrate that the two metabolites
AZ5104 and AZ7550 can be found by RD-Metabolizer
with the corresponding metabolic probabilities of 1.00
and 0.42 (Fig. 9b). Besides, different predicted SOMs are
Meng et al. Chemistry Central Journal (2017) 11:65
Page 12 of 17
Fig. 7 Illustration of the role of detailed reaction SMARTS pattern. The Molprint2D fingerprints of two N atoms that marked with red circle in
compound A and B are the same, while the chemical environment of those two N atoms are dissimilar. The reaction SMARTS pattern is employed to
make up the intrinsic defects of Molprint2D fingerprints, such as unable to identify the ring structures, therefore, those two N atoms are distinguished by different detailed reaction SMARTS patterns
Table 3 Examples of the expressions of detailed reaction SMARTS pattern for complex ring reactions
Metabolism reactions
Reaction SMARTS pattern
[C:1]([NH2])[C:2][C:3][C:4](=O)O
>>[C:1]1[C:2][C:3][C:4](=O)N1
(Cyclization)
[C:1][N:2]1[C:3][C:4][C:5][C:6][C:7]1
>>[C:1][N:2][C:3][C:4][C:5][C:6][C:7](=O)O
(Ring opening)
[c:1]1[c:2][C:3]=[N:4][C:5](O)[C:6](=O)[N:7]1
>>[c:1]1[c:2][C:3]=[N:4][C:5](=O)[N:7]1.[C:6]
(Ring contraction)
[C:1]1[C:2][C:3][C:4][C:5]1(O)(C#C)
>>[C:1]1[C:2][C:3][C:4]C[C:5]1(O)
(Ring expansion)
(See figure on next page.)
Fig. 8 Comparison of prediction performance of RD-Metabolizer utilizing detailed reaction SMARTS pattern to generate structures of metabolites and MetaPrint2D-React using generic reaction SMARTS pattern to generate structures of metabolites. a The compound, Quinapril, has two
metabolites determined by experiment: a hydrolysis product and a cyclization product. b The metabolites are generated by RD-Metabolizer and
MetaPrint2D-React, respectively. The correctly predicted metabolites are marked with a red border. The prediction results of RD-Metabolizer based
on the detailed reaction SMARTS pattern to generate structures of metabolites outperforms the prediction results of MetaPrint2D-React based on
the generic reaction SMARTS pattern to generate structures of metabolites
Meng et al. Chemistry Central Journal (2017) 11:65
Page 13 of 17
a
Quinapril
b
Prediction of RD-Metabolizer
c
Prediction of MetaPrint2D-React
Meng et al. Chemistry Central Journal (2017) 11:65
a
Page 14 of 17
NH
N
NH
O
N
N
H
N
N
NH
O
N
N
N
N
O
N
H
AZ5104
O
N
N
NH
N
N
N
H
N
O
AZD9291
NH
O
AZ7550
b
NH
N
N
O
NH
N
N
N
H
N
NH
O
N
N+
p=1.0
13
14
15
O
2
24
6
N
N5
4
0
/2
/19
/18
17
28
27
8
29 O
16 11 7
1
12
30
9
10 N
23
p=0.4142
33
NH 26
22
34
N 31
21
N
p=0.768
p=0.5689
p=0.4196
37
p=0.6067
25
p=0.8982
36
35
32
20
N 18
19
H
17
24 O
3
N
N
O
9
NH
N
N
N
N
O
O
+
O
N
N
O
N
N
NH
O
N
N
N
N
H
N
N
NH
N
OH
N
H
N
NH
O
+
NH
N
N
N
H
N
O
+
+
N
N
O
NH
The prediction of RD-Metabolizer
O
N
N
N
H
N
NH 2
O
N+
O
+
-
NH
N
N
N
H
N
O
O
N+
O
OH
OH
HO
O
OH
c
N+
NH
O
NH
N
N
N
H
N
N
O
+
N
9/12
O
NH
N
N
N
H
O
N
9/12
+
O
N
O
N
N
N
N
H
O
N
N
N
N
H
+
N
H
14
13
15
9
10 N
1
2
12
30
6
N
3
N5
27
4
N
H
N
O
19
34
20
24 O
35
N
32
NH
24/25
NH
N
N
N
N
H
O
NH 2
O
37
p=1.0
p=0.517
25
p=0.480
35
N
N
O
+
NH
N
N
N
OH
O
+
OH
p=0.517
36
N
N
H
N
H
N
N
33
N 31
21
18
17
NH 26
22
23
p=0.590
N
N
N
28
8
29 O
16 11 7
N
NH
/37
36
p=0.436
O
O
12
p=0.372
N
NH
N
NH
N
N
N
HO
N
H
25
N
O
N
O
NH
N
N
N
H
N
O
+
NH
NH
N
N
N
N
H
O
NH 2
O
HO
+
+
N
The prediction of MetaPrint2D-React
O
N
N
NH
N
N
N
H
O
N+
O
-
O
+
NH
N
N
N
N
H
O
N+
O
O
HO
OH
OH
HO
Meng et al. Chemistry Central Journal (2017) 11:65
Page 15 of 17
(See figure on previous page.)
Fig. 9 Prediction of SOMs and metabolites for AZD9291 and comparison of the integrated prediction performance of RD-Metabolizer and
MetaPrint2D-React. a The experimental metabolism data of AZD9291. b The predicted results are generated by RD-Metabolizer. c The predicted
results are generated by MetaPrint2D-React. The sites with metabolic probability ranging from 0.33 to 1.00 are labeled by color-coded circles and
the corresponding values of metabolic probability are also labeled on the structure. The correctly predicted metabolites are marked with a red
border and the width of the arrows indicates the metabolic probability scale of sites in the molecule
distinguished by different colored circles according to the
metabolic probability division rules of RD-Metabolizer.
By calculation, the top-3 prediction precision and recall
of RD-Metabolizer are respectively 33.3 and 50%, while
the top-3 prediction precision and recall calculated by
MetaPrint2D-React are respectively 16.7 and 50%. Thus it
is proved directly that the number of false positive metabolites generated by RD-Metabolizer is lower than that
generated by MetaPrint2D-React. In addition, AZ5104
can be precisely ranked in the top-1 prediction position
of RD-Metabolizer, while the top-1 prediction position of
MetaPrint2D-React is AZ7550. Collectively, the prediction results of RD-Metabolizer adjusted by the detailed
reaction SMARTS patterns are superior to the prediction results of MetaPrint2D-React. In MetaPrint2DReact, one or two neighboring atoms of potential SOMs
are also treated as reaction center atoms (Fig. 9c). For
example, for the N-dealkylation reaction, MetaPrint2DReact generally flags the nitrogen and the connected carbon atoms as potential SOMs. MetaPrint2D-react thinks
that flagging one or two neighboring atoms of potential
SOMs can provide valuable hints about which metabolic
reactions may take place. However, from the prediction results of MetaPrint2D-React, the metabolic probability of the carbon atom (C12) in the indole N-methyl
group is higher than the nitrogen atom (N9), and the
corresponding metabolites of C12 contain not only the
metabolites of N9 but also a hydroxylated metabolite.
This inevitably leads to data redundancy and affects the
final ranking of the predicted SOMs. Besides, it is difficult for MetaPrint2D-React to distinguish between the
main metabolite and the subordinate metabolite, because
N35 rather than N9 has ranked first in the SOMs list predicted by MetaPrint2D-React. Nevertheless, these situations do not exist in RD-Metabolizer, suggesting itself as
an accurate and highly efficient toolkit for chemist and
medicinal chemists.
Conclusion
This work described RD-Metabolizer, an integrated, low false positive and reaction types extensive
approach to predict metabolic sites and metabolites of
drug-like molecules. The detailed reaction SMARTS
patterns were firstly employed to encode different
metabolism reaction types with the aim of covering
larger chemical reaction space. RDKit was utilized to
act on pre-written reaction SMARTS patterns to correct the metabolic ranking of each site in a molecule
generated by the 2D fingerprint similarity calculation
model as well as to generate the corresponding structures of metabolites. These are critical procedures, as
they can meet the integrated and low false positive
goals. By comparing with other widely used methods, it
is found that RD-Metabolizer has better or comparable
performance in predicting SOMs and produces fewer
false positive metabolites. In addition, a specific example concerning AZD9291, which is a mutant-selective
EGFR inhibitor, was conducted to further illustrate the
prediction accuracy and efficiency of RD-Metabolizer.
In summary, RD-Metabolizer will serve as a useful
toolkit for the early metabolic properties assessment of
lead compounds and drug candidates at the preclinical
stage of drug discovery.
Abbreviations
SOMs: site of metabolism; MIFs: molecular interaction fields; DFT: density functional theory; RS-predictor: RegioSelectivity-predictor; SVM: support vector
machine; MS: mass spectrometry; LC–MS/MS: liquid chromatography/tandem
mass spectrometry; EGFR: Epidermal Growth Factor Receptor.
Authors’ contributions
JM, SL developed the method and drafted the manuscript. JM, SL and XL
interpreted data and performed the evaluation. MZ and HL designed research
and approved the final manuscript. All authors read and approved the final
manuscript.
Author details
1
State Key Laboratory of Bioreactor Engineering, Shanghai Key Laboratory
of New Drug Design, School of Pharmacy, East China University of Science and Technology, Shanghai 200237, China. 2 Shanghai Key Laboratory
of Chemical Biology, School of Pharmacy, East China University of Science
and Technology, 130 Meilong Road, Shanghai 200237, China. 3 Drug Discovery
and Design Center, Shanghai Institute of Materia Medica, Chinese Academy
of Sciences, Shanghai 201203, China.
Acknowledgements
This work was supported by the National Natural Science Foundation of China
(Grant 81230090), the National Key Research and Development Program
(Grant 2016YFA0502304), and Special Program for Applied Research on Super
Computation of the NSFC-Guangdong Joint Fund (the second phase) under
Grant No. U1501501. Shiliang Li is supported by China Postdoctoral Science
Foundation (Grant 2016M600290).
Competing interests
The authors declare that they have no competing interests.
Publisher’s Note
Springer Nature remains neutral with regard to jurisdictional claims in published maps and institutional affiliations.
Meng et al. Chemistry Central Journal (2017) 11:65
Received: 22 March 2017 Accepted: 3 July 2017
References
1. Li J, Schneebeli ST, Bylund J, Farid R, Friesner RA (2011) RAIDSite: an
accurate approach to predict P450-mediated drug metabolism. J Chem
Theory Comput 7:3829–3845
2. Bailey DG, Malcolm J, Arnold O, Spence JD (1998) Grape fruit juice-drug
interactions. Br J Clin Pharmacol 46:101–110
3. Preskorn SH (1997) Clinically relevant pharmacology of selective serotonin reuptake inhibitors. Clin Pharmacokinet 32:1–21
4. Mahmood M, Malone DC, Skrepnek GH, Abarca J, Armstrong EP, Murphy
JE, Grizzle AJ, Ko Y, Woosley RL (2007) Potential drug–drug interactions within veterans affairs medical centers. Am J Health Syst Pharm
64:1500–1505
5. Tarcsay Á, Keseru GM (2011) In silico site of metabolism prediction of
cytochrome P450-mediated biotransformations. Expert Opin Drug Metab
Toxicol 7:299–312
6. Zheng M, Luo X, Shen Q, Wang Y, Du Y, Zhu W, Jiang H (2009) Site
of metabolism prediction for six biotransformations mediated by
cytochromes P450. Bioinformatics 25:1251–1258
7. Afzelius L, Arnby CH, Broo A, Carlsson L, Isaksson C, Jurva U, Kjellander
B, Kolmodin K, Nilsson K, Raubacher F, Weidolf L (2007) State-of-the-art
tools for computational site of metabolism predictions: comparative
analysis mechanistical insights and future applications. Drug Metab Rev
39:61–86
8. Langowski J, Long A (2002) Computer systems for the prediction of
xenobiotic metabolism. Adv Drug Deliv Rev 54:407–415
9. de Graaf C, Vermeulen NPE, Feenstra KA (2005) Cytochrome p450 in silico:
an integrative modeling approach. J Med Chem 48:2725–2755
10. Kirchmair J, Williamson MJ, Tyzack JD, Tan L, Bond PJ, Bender A, Glen RC
(2012) Computational prediction of metabolism: sites products SAR P450
enzyme dynamics and mechanisms. J Chem Inf Model 52:617–648
11. Cruciani G, Carosati E, De Boeck B, Ethirajulu K, Mackie C, Howe T, Vianello
R (2005) MetaSite: understanding metabolism in human cytochromes
from the perspective of the chemist. J Med Chem 48:6970–6979
12. Rydberg P, Gloriam DE, Zaretzki J, Breneman C, Olsen L (2010) SMARTCyp:
a 2D method for prediction of cytochrome P450-mediated drug metabolism. ACS Med Chem Lett 1:96–100
13. Rydberg P, Olsen L (2012) Predicting drug metabolism by cytochrome
P450 2C9: comparison with the 2D6 and 3A4 isoforms. Chem Med Chem
7:1202–1209
14. Rydberg P, Gloriam DE, Olsen L (2010) The SMARTCyp cytochrome P450
metabolism prediction server. Bioinformatics 26:2988–2989
15. Zaretzki J, Rydberg P, Bergeron C, Bennett KP, Olsen L, Breneman CM
(2012) RS-Predictor models augmented with SMARTCyp reactivities:
robust metabolic regioselectivity predictions for nine CYP isozymes. J
Chem Inf Model 52:1637–1659
16. Zaretzki J, Bergeron C, Rydberg P, Huang TW, Bennett KP, Breneman
CM (2011) RS-Predictor: a new tool for predicting sites of cytochrome
P450-mediated metabolism applied to CYP 3A4. J Chem Inf Model
51:1667–1689
17. Adams SE (2010) Molecular Similarity and Xenobiotic Metabolism. Ph.D
thesis, University of Cambridge, Cambridge UK
18. Boyer S, Arnby CH, Carlsson L, Smith J, Stein V, Glen RC (2007) Reaction site mapping of xenobiotic biotransformations. J Chem Inf Model
47:583–590
19. Carlsson L, Spjuth O, Adams S, Glen RC, Boyer S (2010) Use of historic
metabolic biotransformation data as a means of anticipating metabolic
sites using MetaPrint2D and Bioclipse. BMC Bioinformatics 11:362
20. MetaPrint2D version 1.0 (2010) Unilever Centre for Molecular Science
Informatics University of Cambridge, Cambridge UK
21. Hao CC Campbell S, Stranz D, McSweeney N (2004) Identification of
in vitro metabolites of indinavir using automated LC/MS/MS acquisition,
in-silico prediction and structure-based data analysis. In: Proceedings of
the 52nd ASMS conference 2004 Nashville (USA)
Page 16 of 17
22. Klopman G, Dimayuga M, Talafous J (1994) META. 1. A program for the
evaluation of metabolic transformation of chemicals. J Chem Inf Model
34:1320–1325
23. Talafous J, Sayre LM, Mieyal JJ, Klopman G (1994) META. 2. A dictionary
model of mammalian xenobiotic metabolism. J Chem Inf Comput Sci
34:1326–1333
24. Klopman G, Tu M, Talafous J (1997) META. 3. A genetic algorithm for
metabolic transform priorities optimization. J Chem Inf Comput Sci
37:329–334
25. Darvas F (1987) In MetabolExpert: an expert system for predicting
metabolism of substances. Kaiser KLE, D Reidel Publishing Co., Dordrecht
Holland, pp 71–81
26. Marchant CA, Briggs KA, Long A (2008) In silico tools for sharing data and
knowledge on toxicity and metabolism: DEREK for windows METEOR and
VITIC. Toxicol Mech Methods 18:177–187
27. Ridder L, Wagener M (2008) SyGMa: combining expert knowledge and
empirical scoring in the prediction of metabolites. ChemMedChem
3:821–832
28. Mekenyan OG, Dimitrov SD, Pavlov TS, Veith GD (2004) A systematic
approach to simulating metabolism in computational toxicology. I. The
TIMES heuristic modelling framework. Curr Pharm Des 10:1273–1293
29. Tarcsay Á, Kiss R, Keserű GM (2010) Site of metabolism prediction on
cytochrome P450 2C9: a knowledge-based docking approach. J Comput
Aided Mol Des 24:399–408
30. Friesner RA, Banks JL, Murphy RB, Halgren TA, Klicic JJ, Mainz DT, Repasky
MP, Knoll EH, Shelley M, Perry JK, Shaw DE, Francis P, Shenkin PS (2004)
Glide: a new approach for rapid accurate docking and scoring. 1. Method
and assessment of docking accuracy. J Med Chem 47:1739–1749
31. Landrum G RDKit: Open-source cheminformatics. .
Accessed 2 Sep 2014
32. Finlay MRV, Anderton M, Ashton S, Ballard P, Bethel PA, Box MR, Bradbury
RH, Brown SJ, Butterworth S, Campbell A (2014) Discovery of a potent
and selective EGFR inhibitor (AZD9291) of both sensitizing and T790M
resistance mutations that spares the wild type form of the receptor. J
Med Chem 57:8249–8267
33. Accelrys Metabolite Database version 2011.2 (2011) Accelrys Inc., San
Diego, CA
34. Unwalla RJ, Cross JB, Salaniwal S, Shilling AD, Leung L, Kao J, Humblet
C (2010) Using a homology model of cytochrome P450 2D6 to predict
substrate site of metabolism. J Comput Aided Mol Des 24:237–256
35. David SW, Craig K, An CG, Dean C, Savita S, Dan T, Bijaya G, Murtaza H
(2008) DrugBank: a knowledgebase for drugs drug actions and drug
targets. Nucleic Acids Res 36:901–906
36. Yanli W, Jewen X, Tugba OS, Jian Z, Jiyao W, Stephen HB (2009) PubChem:
a public information system for analyzing bioactivities of small molecules.
Nucleic Acids Res 37:623–633
37. Kirchmair J, Williamson MJ, Afzal AM, Tyzack JD, Choy APK, Howlett A,
Rydberg P, Glen RC (2013) FAst MEtabolizer (FAME): a rapid and accurate
predictor of sites of metabolism in multiple species by endogenous
enzymes. J Chem Inf Model 53:2896–2907
38. Daylight Chemical Information Systems Inc (2006) light.
com/dayhtml/doc/theory/index.html. Accessed 31 Jan 2015
39. Xing L, Glen RC (2002) Novel methods for the prediction of pKa, logP and
logD. J Chem Inf Comput Sci 42:796–805
40. Xing L, Glen RC, Clark RD (2003) Predicting pKa by molecular tree structured fingerprints and PLS. J Chem Inf Comput Sci 43:870–879
41. SYBYL Molecular Modeling Software: Tripos Associates Inc., St Louis, MO,
USA
42. Solomon SD, McMurray JJV, Pfeffer MA, Wittes J, Fowler R, Finn P, Anderson WF, Zauber A, Hawk E, Bertagnolli M (2005) Cardiovascular risk associated with celecoxib in a clinical trial for colorectal adenoma prevention. N
Engl J Med 17:1071–1080
43. James S, Viktor SS (2009) SPORCalc: a development of a database analysis
that provides putative metabolic enzyme reactions for ligand-based drug
design. Comput Biol Chem 33:149–159
44. Willett P, Barnard JM, Downs GM (1998) Chemical similarity searching. J
Chem Inf Comput Sci 38:983–996
45. Salim N, Holliday J, Willett P (2003) Combination of fingerprint-based similarity coefficients using data fusion. J Chem Inf Comput Sci 43:435–442
Meng et al. Chemistry Central Journal (2017) 11:65
46. Campagna-Slater V, Pottel J, Therrien E, Cantin LD, Moitessier N (2012)
Development of a computational tool to rival experts in the prediction of sites of metabolism of xenobiotics by P450s. J Chem Inf Model
52:2471–2483
47. Tyzack JD, Williamson MJ, Torella R, Glen RC (2013) Prediction of
cytochrome p450 xenobiotic metabolism: tethered docking and reactivity derived from ligand molecular orbital analysis. J Chem Inf Model
53:1294–1305
48. Rosenblatt M (1956) Remarks on some nonparametric estimates of a
density function. Ann Math Stat 27:832
49. Parzen E (1962) On estimation of a probability density function and
mode. Ann Math Stat 33:1065
Page 17 of 17
50. Abbara Ch, Aymard G, Hinh S, Diquet B (2002) Simultaneous determination of quinapril and its active metabolite quinaprilat in human plasma
using high-performance liquid chromatography with ultraviolet detection. J Chromatogr B Analyt Technol Biomed Life Sci 766:199–207
51. Goto N, Sato T, Shigetoshi M, Ikegami K (1992) Determination of dioxopiperazine metabolites of quinapril in biological fluids by gas chromatographymass spectrometry. J Chromatogr A 578:203–206
52. Cross DA, Ashton SE, Ghiorghiu S, Eberlein C, Nebhan CA, Spitzler PJ,
Orme JP, Finlay MR, Ward RA, Mellor MJ (2014) AZD9291 an irreversible
EGFR TKI overcomes T790M-mediated resistance to EGFR inhibitors in
lung cancer. Cancer Discov 4:1046–1061