Correlation and path analysis for yield and its component traits in NPT core set of rice (Oryza sativa L.)
Bạn đang xem bản rút gọn của tài liệu. Xem và tải ngay bản đầy đủ của tài liệu tại đây (401.46 KB, 12 trang )
Int.J.Curr.Microbiol.App.Sci (2018) 7(9): 97-108
International Journal of Current Microbiology and Applied Sciences
ISSN: 2319-7706 Volume 7 Number 09 (2018)
Journal homepage:
Original Research Article
/>
Correlation and Path Analysis for Yield and its Component Traits in NPT
Core Set of Rice (Oryza sativa L.)
Rachana Bagudam1,2*, K.B. Eswari1, Jyothi Badri2 and P. Raghuveer Rao2
1
Department of Genetics and Plant breeding, College of Agriculture, PJTSAU,
Hyderabad-030, Telangana, India
2
ICAR-Indian Institute of Rice Research, Hyderabad-030, Telangana, India
*Corresponding author
ABSTRACT
Keywords
Rice, Correlation,
PATH analysis,
New plant type,
Yield, Yield
components
Article Info
Accepted:
04 August 2018
Available Online:
10 September 2018
Grain yield in rice is considered as a complex trait, determined by the ultimate expression
of its individual component traits. Establishing an association between yield and its
component traits plays a vital role in stabilizing the trait ‘overall yield’. Correlation and
path analysis were examined in 46 rice genotypes including tropical japonica accessions,
indica land races and elite indica cultivars as New plant type (NPT) core set along with
checks during kharif 2017. The data was recorded on twelve quantitative traits viz., days to
50% flowering, plant height, number of tillers, number of panicles, panicle length, panicle
weight, grain number, test weight, single plant yield, plot yield, biomass and harvest index.
Correlation studies revealed highly significant and positive association of single plant yield
with days to 50% flowering, tillers per plant, productive tillers per plant and biomass,
indicating that these characters are very important for yield improvement and concurrent
selection will directly lead to high yield. Path coefficient analysis showed that productive
tillers per plant exerted highest positive direct effect followed by panicle length, number of
grains per panicle, test weight, panicle weight, harvest index and biomass on single plant
yield, indicating that selection for these characters is likely to bring about an overall
improvement in grain yield per plant directly. In view of the results obtained, it may be
concluded that characters like productive tillers per plant and biomass could be used as a
direct selection criteria for higher grain yield.
billion individuals in 2050 (Khush 2005 and
Ray et al., 2013). Crop yield is of prime
significance to satisfy the needs attributable to
steady increment in population.
Introduction
Rice is the most essential human nourishment
crop in the world for direct feeding a larger
number of individuals and continues to be an
important area of research on global level.
Asia represents 90 percent of worldwide rice
utilization and the aggregate rice demand
keeps on rising, which is insufficient to meet
the sustenance demand for the evaluated nine
Grain yield is an intricate character and
determination of superior genotypes in view of
yield is troublesome because of the
incorporated structure of plant, in which the
component characters are administered by a
97
Int.J.Curr.Microbiol.App.Sci (2018) 7(9): 97-108
large number of genes. It has been reported to
be influenced by productive tillers (Rashmi et
al., 2017 and Harsha et al., 2017), panicle
length and effective tillers per plant (Harsha et
al., 2017), plant height (Sarawagi et al., 2016),
the number of filled grains per panicle (Islam
et al., 2015), 1000-grain weight (Chouhan et
al., 2014), biomass, harvest index and number
of tillers per plant (Patel et al., 2014), panicle
weight and productive tillers (Rashmi et al.,
2017) and harvest index (Dhurai et al., 2016).
elucidation to the cause of association between
the dependent variable like yield and
independent variables like yield components.
This sort of data will be useful in formulating
the selection criteria, indicating the selection
for these characters is likely to bring about on
overall improvement in single plant yield
directly. Accordingly, present investigation
was framed to study the relationship between
yield related traits to build up suitable plant
attributes for selection to enhance the yield of
rice.
The degree of relationship between traits
conferring higher yield will be more helpful to
choose the traits to be given significance in
selection process. Positive relationship
between traits will bring about concurrent
change of both the traits while limiting
determination to any of the related attributes.
Negative
relationship
between
traits
necessitates equal weight on both the traits
amid selection. At genetic level, a positive
correlation occurs because of coupling period
of linkage and negative correlation emerges
because of repulsion phase of linkage of genes
controlling two different traits (Nadarajan and
Gunasekaran 2008).
Materials and Methods
46 rice genotypes comprising NPT core set
(Jyothi et al., 2018) of tropical japonica
accessions, indica land races along with
checks were evaluated for yield and
component traits during Kharif 2017 in
Randomized Block Design (RBD) with three
replications at ICAR-Indian Institute of Rice
Research (ICAR-IIRR), Ramachandrapuram
farm, ICRISAT campus, Hyderabad. Thirty
days old seedlings were transplanted by
adopting a spacing of 15 cm between plants
and 20 cm between rows. Recommended
agronomic and plant protection measures for
raising a healthy nursery and main crop were
taken up during the experiment.
Path coefficient investigation assists plant
breeders in identifying traits on which
selection pressure ought to be given for
enhancing yield. The relationship of different
component characters among themselves and
with yield is very imperative for devising an
effective selection criterion for yield. The total
correlation between yield and component
characters may be some times misleading, as it
may be an over-estimate or under-estimate as
a result of its relationship with other
characters. Thus, indirect selection by
correlated response may not be productive
some times. At the point, when numerous
characters are influencing a given character,
splitting the total correlation into direct and
indirect effects of cause as contrived by
Wright (1921) would give more significant
Observations were recorded on five randomly
selected plants in each genotype in each
replication for twelve quantitative traits viz.,
days to fifty percent flowering (DFF), plant
height (PH) (cm), tillers per plant (TN),
number of panicles (PN), panicle length (PL)
(cm), panicle weight (PW) (g), grain number
(GN), thousand grain weight (TW) (g), single
plant yield (SPY) (g), plot yield (PY) (kg m-2),
biomass (BM) (g) and harvest index (HI) (%).
The mean of five plants for each metric trait
was considered for statistical analysis using
WINDOSTAT
software
version
9.2.
Correlation coefficients were calculated
following Falconer and Mackay (1964) and
98
Int.J.Curr.Microbiol.App.Sci (2018) 7(9): 97-108
path analysis by Dewey and Lu (1959). By
keeping single plant yield as dependent
variable and other eleven traits as independent
variables, simultaneous equations which
express the basic relationship between path
coefficients were solved to estimate the direct
and indirect effects.
Plant height was significantly and positively
correlated with panicle weight, biomass,
panicle length, test weight and number of
grains per panicle. Similar results were
reported by Ranawake and Amarasinghe
(2014) for panicle weight, Solomon and
Wegary (2016) for biomass, Dhurai et al.,
(2016) and Harsha et al., (2017) for panicle
length, Babu et al., (2012) and Ramya et al.,
(2017) for test weight and Rahman et al.,
(2014) for number of grains per panicle.
Significant and negative correlation of plant
height was observed with harvest index and
number of panicles per plant. Similar findings
were earlier reported by Solomon and Wegary
(2016) for harvest index and Ravindra Babu et
al., (2012) for number of panicles per plant.
Results and Discussion
Correlation
Selection based on magnitude and direction of
association between yield and its component
traits is very important in identifying the key
characters, which can be exploited for crop
improvement through suitable breeding
programme. Correlation between yield and
yield components were computed and the
results are presented in (Table 1). In the
present investigation, single plant yield
exhibited positive and significant association
with tillers per plant, days to 50% flowering,
biomass and productive tillers per plant.
Similar results were reported by Veni et al.,
(2013), Khare et al., (2014), Islam et al.,
(2015) for days to 50% flowering, Sanghera et
al., (2013), Norain et al., (2014) for tillers per
plant, Awaneet and Senapati (2013), Harsha et
al., (2017) for productive tillers per plant and
Konate et al., (2016) for biomass. These traits
could be considered as the selection criteria
for the improvement of grain yield in rice.
Tillers per plant was significantly and
positively correlated with plot yield, as
reported by Sanghera et al., (2013), Norain et
al., (2014) and productive tillers per plant as
reported earlier by Aditya and Anuradha
(2013) and Konate et al., (2016), whereas
significantly and negatively correlated with
panicle weight and test weight.
The results are in conformity with Padmaja et
al., (2011) for test weight, Laxuman et al.,
(2011) for panicle weight.
The trait ‘productive tillers per plant’ were
significantly and negatively correlated with
panicle weight and test weight as reported by
Padmaja et al., (2011) and Rahman et al.,
(2014). Significant and positive correlation
was observed between panicle length and two
traits, panicle weight and biomass. Similar
results were reports by Solomon and Wegary
(2016) for panicle length and biomass and
Laxuman et al., (2011) for panicle length and
panicle weight. However, significant and
negative correlation was observed between
panicle length and harvest index and similar
such correlations were reported earlier by Li et
al., (2012).
Days to 50 % flowering exhibited positive and
significant correlation with plant height,
panicle length, plot yield, biomass and panicle
weight. The results are in conformity with
Aditya and Anuradha (2013) for plant height,
grain yield per plant and panicle length, Patel
et al., (2014) for biomass.
At the same time, DFF was significantly and
negatively correlated with harvest index as
reported previously by Solomon and Wegary
(2016).
99
Int.J.Curr.Microbiol.App.Sci (2018) 7(9): 97-108
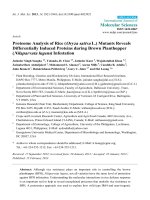
Fig.1 Phenotypic path diagram for single plant yield in rice
100
Int.J.Curr.Microbiol.App.Sci (2018) 7(9): 97-108
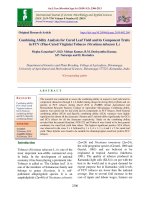
Fig.2 Genotypic path diagram for single plant yield in rice
101
Int.J.Curr.Microbiol.App.Sci (2018) 7(9): 97-108
Table.1 Correlations between yield and its component traits
Traits
DFF PH
DFF
1.00
PH
TN
PN
PL
PW
TN
PN
PL
PW
GN
TW
SPY
PY
BM
HI
0.51 **
0.10
0.06
0.26 **
0.32 *
0.27
-0.02
0.40 **
0.55 **
0.58 **
-0.47 **
1.00
-0.26
-0.29 *
0.49 **
0.58 **
0.34 *
0.32 *
0.06
0.14
0.38 **
-0.60 **
1.00
0.96**
-0.32
-0.46 **
-0.19
-0.48 **
0.47 **
0.46 **
0.26
0.01
1.00
-0.39
-0.49 **
-0.25
-0.53 **
0.43 **
0.40 **
0.20
0.00
1.00
0.57**
0.28
0.23
0.018
0.22
0.13 **
-0.47 **
1.00
0.59 **
0.40 **
-0.03
0.03
0.12
-0.20
1.00
-0.16
0.15
0.23
0.15
-0.08
1.00
-0.23
-0.24
-0.21
0.01
1.00
0.99 **
0.57 **
0.04
1.00
0.58 **
0.04
1.00
-0.68 **
GN
TW
SPY
PY
BM
1.00
HI
* Significant at 5%
** Significant at 1%
DFF- Days to 50% flowering, PH- Plant height, TN- Tillers per plant, PN- number of panicles or productive tillers per plant, PL- Panicle length, PW- Panicle
weight, GN- Grain number, TW- Test weight, SPY- Single plant yield, PY- Plot yield, BM- Biomass, HI- Harvest index
102
Int.J.Curr.Microbiol.App.Sci (2018) 7(9): 97-108
Table.2 Phenotypic and Genotypic path coefficients of yield and its component traits in rice
Traits
DFF
PH
TN
PN
PL
PW
GN
TW
PY
BM
HI
G
P
G
P
G
P
G
P
G
P
G
P
G
P
G
P
G
P
G
P
G
P
DFF
PH
TN
PN
PL
PW
GN
TW
PY
BM
HI
SPY
-1.280
-0.136
0.484
0.001
-1.197
-0.012
1.153
0.014
0.802
0.010
-0.470
-0.007
0.677
0.005
-0.039
-0.001
0.209
0.443
0.308
0.148
-0.532
-0.056
-0.660
-0.068
-0.939
-0.002
5.150
0.053
-5.982
-0.072
1.465
0.017
-0.845
-0.013
0.864
0.006
0.604
0.015
0.053
0.107
0.203
0.096
-0.687
-0.071
-0.088
-0.008
-0.278
-0.001
-0.081
-0.007
-0.306
-0.001
-17.24
-0.198
18.34
0.271
-1.222
-0.013
0.756
0.010
-0.667
-0.004
-1.037
-0.022
0.158
0.293
0.111
0.049
0.013
0.001
-0.406
-0.030
0.543
0.001
6.976
0.059
-8.857
-0.078
2.533
0.044
-0.825
-0.009
0.490
0.002
0.841
0.015
0.011
0.017
0.079
0.027
-0.268
-0.020
-0.420
-0.044
0.553
0.001
8.548
0.092
-9.669
-0.125
1.458
0.017
-0.347
-0.036
0.325
0.001
3.694
0.040
-4.897
-0.063
0.496
0.005
-0.854
-0.013
2.500
0.017
-0.297
-0.007
0.088
0.187
0.079
0.038
-0.089
-0.009
0.027
0.002
0.309
0.001
9.050
0.094
-10.35
-0.127
1.159
0.015
-0.578
-0.009
-0.405
-0.003
1.836
0.046
-0.093
-0.192
-0.114
-0.054
0.015
0.002
-0.710
-0.074
0.131
0.000
-7.932
-0.084
7.710
0.098
0.071
0.001
-0.041
-0.001
0.586
0.004
-0.452
-0.011
0.377
0.812
0.305
0.145
0.035
0.006
-0.755
-0.079
0.365
0.001
-4.177
-0.046
3.907
0.053
0.383
0.005
-0.174
-0.003
0.377
0.003
-0.401
-0.010
0.220
0.465
0.522
0.253
-0.612
-0.065
0.607
0.064
-0.575
-0.001
-0.152
-0.001
0.205
0.002
-0.606
-0.007
0.284
0.004
-0.198
-0.001
0.025
0.001
0.012
0.038
-0.285
-0.137
0.411
0.401
0.062
0.054
0.481
0.415
0.467
0.393
0.023
0.015
-0.036
-0.034
0.156
0.152
-0.243
-0.230
0.905
0.900
0.582
0.567
0.085
0.101
-17.42
-0.207
18.15
0.259
-1.014
-0.013
0.703
0.010
-0.530
-0.003
-0.954
-0.021
0.171
0.328
0.125
0.057
0.010
0.000
1.434
0.022
1.489
0.010
0.740
0.018
0.011
0.023
0.063
0.031
-0.222
-0.023
Bold values are direct effects; G – Genotypic correlation coefficient; P – Phenotypic correlation coefficient
103
1.123
0.120
Int.J.Curr.Microbiol.App.Sci (2018) 7(9): 97-108
Panicle weight was significantly and
positively correlated with number of grains
per panicle and test weight. The results are in
conformity with Akinwale et al., (2011) and
Ranwake and Amarasighe (2014) for number
of grains per panicle and Gour et al., (2017)
for test weight. Single plant yield was
significantly and positively correlated with
plot yield and biomass. The results are in
conformity with Konate et al., (2016) for
biomass. Plot yield was significantly and
positively correlated with biomass. Biomass
was significantly and negatively correlated
with harvest index as also reported earlier by
Solomon and Wegary (2016).
correlation coefficient is negative but direct
effect is positive and high, a restriction has to
be imposed to nullify the undesirable indirect
effects in order to make use of direct effect.
Path coefficient analysis (Table 2) revealed
that productive tillers per plant exerted
highest positive direct effect followed by
panicle length, number of grains per panicle,
test weight, panicle weight, harvest index and
biomass on the single plant yield indicating
that selection for these characters is likely to
bring about an overall improvement in grain
yield per plant directly. The phenotypic and
genotypic path diagrams are presented in
figures 1 and 2 respectively. The results are in
conformity with Kole et al., (2008), Ambili
and Radhakrishnan (2011), Rangare et al.,
(2012), Awaneet and Senapati (2013),
Berhanu et al., (2013), Chouhan et al., (2014),
Naseem et al., (2014), Sarawagi et al., (2016)
and Rashmi et al., (2017) for productive tiller
number, Chakraborty et al., (2010), Yadav et
al., (2011), Rangare et al., (2012), Awaneet
and Senapati (2013), Chouhan et al., (2014),
Dhurai et al., (2016), Sarawagi et al., (2016),
Rashmi et al., (2017), Gour et al., (2017) and
Harsha et al., (2017) for panicle length,
Chakravorty and Ghosh (2012), Awaneet and
Senapati (2013), Rashmi et al., (2017) and
Gour et al., (2017) for panicle weight, Kole et
al., (2008), Khan et al., (2009), Pankaj et al.,
(2010), Aditya and Anuradha (2013), Naseem
et al., (2014), Patel et al., (2014), Islam et al.,
(2015), Dhurai et al., (2016) and Rashmi et
al., (2017) for grain number, Kole et al.,
(2008), Chakraborty et al., (2010), Yadav et
al., (2011), Rangare et al., (2012), Chouhan et
al., (2014), Dhurai et al., (2016) and Rashmi
et al., (2017) for test weight, Ambili and
Radhakrishnan (2011) and Patel et al., (2014)
for biomass and Ambili and Radhakrishnan
(2011), Yadav et al., (2011), Rangare et al.,
(2012), Rai et al., (2014), Patel et al., (2014),
Dhurai et al., (2016) and Gour et al., (2017)
for harvest index.
Path coefficient analysis
The genetic architecture of grain yield is
based on the overall net effect delivered by
various yield components interacting with one
another. The association of different
component characters among themselves and
with yield is quite important for conceiving an
efficient selection criterion for yield.
Correlation gives only the relation between
two variables, whereas path coefficient
analysis allows separation of the direct effect
and their indirect effects through other
attributes by partitioning the correlations
(Wright, 1921). In view of the data presented
the genotypic and phenotypic correlations
were estimated to determine direct and
indirect effects of yield and yield contributing
characters. If the correlation coefficient
between a casual factor and the effect is
almost equal to its direct effect, it explains the
true relationship and a direct selection
through this trait may be useful.
If the correlation coefficient is positive, but
the direct effect is negative or negligible, the
indirect effects appear to be the cause of that
positive correlation. In such circumstance, the
other factors are to be considered
simultaneously for selection. However if the
104
Int.J.Curr.Microbiol.App.Sci (2018) 7(9): 97-108
The traits days to 50% flowering, plant height
and tillers number exerted negative direct
effect on single plant yield. The results are in
conformity with Ambili and Radhakrishnan
(2011), Yadav et al., (2011), Babu et al.,
(2012), Rashmi et al., (2017) and Gour et al.,
(2017) for days to 50% flowering, Babu et al.,
(2012), Awaneet and Senapati (2013) for
plant height and Gour et al., (2017) for tillers
number. The residual effect at phenotypic
level was 0.386 and genotypic level was
0.826.
Odiyi, A.C. 2011. Heritability and
correlation coefficient analysis for yield
and its components in rice. African
Journal of Plant Science. 5(3): 207-212.
Ambili, S.N and Radhakrishnan, V.V. 2011.
Correlation and path analysis of grain
yield in rice. Gregor Mendel
Foundation Proceedings. 1-6.
Awaneet, K and Senapathi, B.K. 2013.
Genetic parameters and association
studies for important quantitative traits
in advanced lines of Sambamahsuri
derivatives. Journal of Crop and Weed.
9(1): 156-163.
Berhanu, D.B., Naveen, G.K., Rakhi, S and
Shashidhar, H. E. 2013. Genetic
evaluation of recombinant inbred lines
of rice for grain zinc concentrations,
yield related traits and identification of
associated SSR markers. Pakistan
Journal of Biological science. 16(23):
1714-1721.
Chakraborty, S., Das, P.K., Guha, B., Sarmah,
K.K and Barman B. 2010. Quantitative
genetic analysis for yield and yield
components in boro rice (Oryza sativa
L.). Notulae Scientia Biologicae. 2(1):
117-120.
Chakravorty, A and Ghosh, P.D. 2012. An
analysis on genetic parameters of
different Land races of rice of West
Bengal. Journal of Crop and Weed.
7(2): 59-63.
Chouhan, S.K., Singh, A.K., Singh, A., Singh,
N.K. Yadav, S.K and Singh, P.K. 2014.
Genetic variability and association
analysis in wild rice (Oryzav nivara and
Oryza rufipogon). Annals of Plant and
Soil Research. 16(3): 219-223.
Dhurai, S.Y., Reddy, D.M and Ravi, S. 2016.
Correlation and path analysis for yield
and quality characters in rice (Oryza
sativa L.). Rice Genomics and Genetics.
7(4): 1-6.
Gour, L., Koutu, G.K., Singh, S.K., Patel,
D.D., Shrivastava, A and Singh, Y.
The correlation studies revealed that single
plant yield exhibited significant positive
association with days to 50% flowering, tillers
per plant, productive tillers per plant and
biomass, indicating that these characters are
very important for yield improvement and
simultaneous selection will ultimately lead to
high yield. Path coefficient analysis revealed
that productive tillers per plant exerted
highest positive direct effect followed by
panicle length, number of grains per panicle,
test weight, panicle weight, harvest index and
biomass on single plant yield, indicating that
selection for these characters is likely to bring
about an overall improvement in grain yield
per plant directly. Further, studies on
correlation and path co-efficient analysis
revealed the importance of productive tillers
per plant and biomass, which showed highly
significant positive correlation and positive
direct effect with single plant yield, thus can
be used as selection criteria for effective yield
improvement.
References
Aditya, J.P and Anuradha, B. 2013. Genetic
variability, correlation and path analysis
for quantitative characters in rain-fed
upland rice of Uttarakhand hills.
Journal of Rice Research. 6(2): 24-34.
Akinwale, M.G., Gregorio, G., Nwilenel, F.,
Akinyele, B.O., Ogunbayo, S.A and
105
Int.J.Curr.Microbiol.App.Sci (2018) 7(9): 97-108
2017. Genetic variability, correlation
and path analyses for selection in elite
breeding materials of rice (Oryza sativa
L.) genotypes in Madhya Pradesh. The
Pharma Innovation Journal. 6(11): 693696.
Harsha, Deo, I., Kumar, S and Talha, M.
2017.
Assessment
of
Genetic
Variability
and
Inter-Character
Association Studies in Rice Genotypes
(Oryza sativa L.). International Journal
of Current Microbiology and Applied
Sciences. 6(9): 2041-2046.
Islam, M.A., Raffi, S.A., Hossain, M.A and
Hasan,
A.K.
2015.
Character
Association and Path Coefficient
Analysis of Grain Yield and Yield
Related Traits in Some Promising Early
to Medium Duration Rice Advanced
Lines.
International
Journal
of
Experimental Agriculture. 5(1): 8-12.
Jyothi, B., Divya, B., Subba Rao, L. V.,
Laxmi Bhavani, P., Revathi, P.,
Raghuveer Rao, P., Rachana, B.,
Padmavathi, G., Aravind Kumar, J.,
Gireesh, C., Anantha, M. S., Abdul
Fiyaz, R., Suvarna Rani, C and
Ranganatha, A.R.G. 2018. New plant
type
trait
characterization
and
development of core set among indica
and tropical japonica genotypes of rice.
Plant
Genetic
Resources.
1–9.
doi:10.1017/S1479262118000084.
Khan, A.S., Imran, M and Ashfaq, M. 2009.
Estimation of genetic variability and
correlation for grain yield components
in rice. American-Eurasian Journal
Agriculture & Environmental Science.
6(5): 585-590.
Khare, R., Singh, A.K., Eram, S and Singh,
P.K.
2014.
Genetic
variability,
association and diversity analysis in
upland Rice (Oryza sativa L). SAARC
Journal of Agriculture. 12(2): 40-51.
Khush, G.S. 2005. What it will take to feed
5.0 billion rice consumers in 2030.
Plant Molecular Biology. 59(1):1–6.
Kole, P.C., Chakraborty, N.R and Bhat, J.S.
2008.
Analysis
of
variability,
correlation and path coefficients in
induced mutants of aromatic nonbasmati rice. Eco-friendly Agriculture
Journal. 113: 60-64.
Konate, A.K., Zongo, A., Kam, H., Sanni, A
and Audebert, A. 2016. Genetic
variability and correlation analysis of
rice (Oryza sativa L.) inbred lines based
on agro-morphological traits. African
Journal of Agricultural Research.
11(35): 3340.
Krishna Veni, B., Vijaya Lakshmi, B and
Ramana, J.V. 2013. Variability and
Association
Studies
for
Yield
Components and Quality Parameters in
Rice Genotypes. Journal of Rice
Research. 6(2): 16-23.
Laxuman, Salimath, P.M., Shashidar, H.E.,
Mohankumar, H.D., Patil, S.S.,
Vamadevaiah, H.M and Janagouder,
H.M. 2011. Character association and
path coefficient analysis among the
backcross inbred lines derived from
indica x NERICA cross for productivity
traits in rice (Oryza sativa L.).
Karnataka Journal of Agricultural
Sciences. 24(5): 626-628.
Li, X., Yan, W., Agrama, H., Jia, L., Jackson,
A., Moldenhauer, K and Wu, D. 2012.
Unraveling the Complex Trait of
Harvest Index with Association
Mapping
in
Rice
(Oryza
sativa L.). PLoSONE. 7(1).
Nadarajan N and Gunasekaran M. 2008.
Quantitative genetics and biometrical
techniques in plant breeding. Kalyani
Publishers, Ludhiana. pp 207.
Naseem, I., Khan, A.S and Akhter, M. 2014.
Correlation and path coefficient studies
of some yield related traits in rice
(Oryza sativa L.). International Journal
106
Int.J.Curr.Microbiol.App.Sci (2018) 7(9): 97-108
of Scientific and Research Publications.
4(4): 2250-3153.
Norain, M.N., Shamsiah, A., Abdul, R.H.,
NorAishah, H., Haslinda, A.M and Wan
Aminuddin, W.A. 2014. Correlation
analysis on agronomic characters in F2
population derived from MR64 and
pongsu seribu2. Journal of Applied
Science and Agriculture. 9(18): 143147.
Padmaja, D., Radhika, K., Rao, L.V.S and
Padma, V. 2011. Correlation and path
analysis in rice germplasm. Oryza.
48(1): 69-72.
Pankaj, G., Pandey, D.P and Dhirendra, S.
2010. Correlation and path analysis for
yield and its components in rice (Oryza
sativa L.). Crop Improvement. 37(1):
46-51.
Patel, J.R., Saiyad, M.R., Prajapati, K.N.,
Patel, R.A and Bhavani, R.T. 2014.
Genetic variability and character
association studies in rainfed upland
rice (Oryza sativa L.). Electronic
Journal of Plant Breeding. 5(3): 531537.
Rahman, M.M, Syed, M.A, Akter, A., Alam,
M.M and Ahsam, M.M. 2014. Genetic
variability, correlation and path
coefficient analysis of morphological
traits in transplanted aman-rice (Oryza
sativaL.). American-Eurasian Journal
of Agricuture & Environmental Science.
14(5): 387-39.
Rai, S.K., Suresh B.G., Rai, P.K., Lavanya,
G.R., Kumar, R and Sandhya. 2014.
Genetic Variability, Correlation and
Path Coefficient Studies for Grain Yield
and Other Yield Attributing Traits in
Rice (Oryza sativa L.). Indian
Journal of Life Sciences. 2(4): 229234.
Ramya, R., Sanjeeva Rao, D., Ravindra Babu,
V and Bharathi, M. 2017. Correlation
and Path Coefficient Analysis for Yield,
Yield Attributing and Nutritional Traits
in Rice (Oryza sativa L.). International
Journal of Current Microbiology and
Applied Sciences. 6(11): 183-188.
Ranawake, A.L and Amarasinghe, U.G.S.
2014. Relationship of yield and yield
related traits of some traditional rice
cultivars in Srilanka as described by
correlation
analysis.
Journal
of
Scientific Research & Reports. 3(18):
2395-2403.
Rangare, N.R., Krupakar, A., Ravichandra,
K., Shukla, A.K and Mishra, A.K. 2012.
Estimation of characters association and
direct and indirect effects of yield
contributing traits on grain yield in
exotic and Indian rice germ-plasm.
International Journal of Agricultural
Science. 2(1): 54-61.
Rashmi, D., Saha, S., Loitongbam, B., Singh,
S and Singh, P.K. 2017. Genetic
Variability Study for Yield and Yield
Components in Rice (Oryza sativa L.).
International Journal of Agriculture,
Environment and Biotechnology. 10(2):
171-176.
Ravindra Babu, V., Shreya, K., Kuldeep, S.
D., Usharani, G and Siva Shankar, A.
2012. Correlation and path analysis
studies in popular rice hybrids of India.
International Journal of Scientific and
Research Publications. 2(3): 1-5.
Ray, D.K., Mueller, N.D., West, P.C and
Foley, J.A. 2013. Yield trends are
insufficient to double global crop
production by 2050. PLoS One. 8(6):
e66428.
Sanghera, G.S., Kashyap, S.C., Parray, G.A.
2013. Genetic variation for grain yield
and related traits in temperate red rice
(Oryza sativa L.) ecotypes. Notulae
Scientia Biologicae. 5(3): 400-406.
Sarawagi A. K., Ojha G.C., Koshta, N and
Pachauri, A. 2016. Genetic Divergence
and Association Study for Grain Yield
in Rice (Oryza sativa L.) Germplasm
accessions. The Ecoscan. 9(2): 217-223.
107
Int.J.Curr.Microbiol.App.Sci (2018) 7(9): 97-108
Singh, C.M., Suresh Babu, G., Kumar, B and
Mehandi, S. 2013. Analysis of
quantitative variation and selection
criteria for yield improvement in exotic
germplasm of upland rice (Oryza Sativa
L.). The Bioscan. 8(2): 485-492.
Solomon, H and Wegary, D. 2016.
Phenotypic Correlation and Path
Coefficient Analysis of Yield and Yield
Component in Rice (Oryza sativa).
International Journal of Research and
Review. 3(7): 1-5.
Wright, S. 1921. Correlation and causation.
Journal of Agricultural Research. 20:
557-585.
Yadav, S.K., Pandey, P., Kumar, B and
Suresh, B.G. 2011. Genetic architecture,
Inter-relationship and selection criteria
for yield improvement in rice. Pakistan
Journal of Biological Sciences. 14(9):
540-545.
How to cite this article:
Rachana Bagudam, K.B. Eswari, Jyothi Badri and Raghuveer Rao, P. 2018. Correlation and
Path Analysis for Yield and its Component Traits in NPT Core Set of Rice (Oryza sativa L.).
Int.J.Curr.Microbiol.App.Sci. 7(09): 97-108. doi: />
108

![Genetic variability studies in F2 segregating populations for yield and its component traits in Okra [Abelmoschu sesculentus (L.)Moench]](https://media.store123doc.com/images/document/2020_01/13/medium_nxs1578931693.jpg)