Proteome analysis of rice (oryza sativa l ) mutants reveals
Bạn đang xem bản rút gọn của tài liệu. Xem và tải ngay bản đầy đủ của tài liệu tại đây (3.96 MB, 25 trang )
Int. J. Mol. Sci. 2013, 14, 3921-3945; doi:10.3390/ijms14023921
OPEN ACCESS
International Journal of
Molecular Sciences
ISSN 1422-0067
www.mdpi.com/journal/ijms
Article
Proteome Analysis of Rice (Oryza sativa L.) Mutants Reveals
Differentially Induced Proteins during Brown Planthopper
(Nilaparvata lugens) Infestation
Jatinder Singh Sangha 1,2, Yolanda, H. Chen 1,3, Jatinder Kaur 2, Wajahatullah Khan 2,4,
Zainularifeen Abduljaleel 4, Mohammed S. Alanazi 4, Aaron Mills 5, Candida B. Adalla 6,
John Bennett 1, Balakrishnan Prithiviraj 2, Gary C. Jahn 1,7 and Hei Leung 1,*
1
2
3
4
5
6
7
Plant Breeding, Genetics and Biochemistry Division, International Rice Research Institute,
DAPO Box 7777, Metro Manila, Philippines; E-Mails: (J.S.S.);
(Y.H.C.); (J.B.); (G.C.J.)
Department of Environmental Sciences, Faculty of Agriculture, Dalhousie University, Truro,
Nova Scotia B2N 5E3, Canada; E-Mails: (J.K.); (B.P.)
Department of Plant and Soil Sciences, University of Vermont, 63 Carrigan Drive, Burlington,
VT 05405, USA
Genome Research Chair Unit, Biochemistry Department, College of Science, King Saud University,
PO Box 2455, Riyadh 11451, Saudi Arabia; E-Mails: (W.K.);
(Z.A.); (M.S.A.)
Crops and Livestock Research Center, Agriculture and Agri-Food Canada, 440 University Ave.,
Charlottetown, Prince Edward Island C1A4N6, Canada; E-Mail:
Department of Entomology, College of Agriculture, University of the Philippines, Los Banos,
Laguna 4031, Philippines; E-Mail:
Georgetown University Medical Center, Department of Microbiology and Immunology, Washington,
DC 20057, USA
* Author to whom correspondence should be addressed; E-Mail: ;
Tel.: +63-234-555-1212; Fax: +63-234-555-1213.
Received: 17 September 2012; in revised form: 20 January 2013 / Accepted: 22 January 2013 /
Published: 15 February 2013
Abstract: Although rice resistance plays an important role in controlling the brown
planthopper (BPH), Nilaparvata lugens, not all varieties have the same level of protection
against BPH infestation. Understanding the molecular interactions in rice defense response
is an important tool to help to reveal unexplained processes that underlie rice resistance to
BPH. A proteomics approach was used to explore how wild type IR64 and near-isogenic
Int. J. Mol. Sci. 2013, 14
3922
rice mutants with gain and loss of resistance to BPH respond during infestation. A total of
65 proteins were found markedly altered in wild type IR64 during BPH infestation.
Fifty-two proteins associated with 11 functional categories were identified using mass
spectrometry. Protein abundance was less altered at 2 and 14 days after infestation (DAI)
(T1, T2, respectively), whereas higher protein levels were observed at 28 DAI (T3). This
trend diminished at 34 DAI (T4). Comparative analysis of IR64 with mutants showed
22 proteins that may be potentially associated with rice resistance to the brown planthopper
(BPH). Ten proteins were altered in susceptible mutant (D1131) whereas abundance of
12 proteins including S-like RNase, Glyoxalase I, EFTu1 and Salt stress root protein
“RS1” was differentially changed in resistant mutant (D518). S-like RNase was found in
greater quantities in D518 after BPH infestation but remained unchanged in IR64 and
decreased in D1131. Taken together, this study shows a noticeable level of protein
abundance in the resistant mutant D518 compared to the susceptible mutant D1131 that
may be involved in rendering enhanced level of resistance against BPH.
Keywords: rice resistance; brown planthopper; proteomics; S-like RNase; molecular docking
1. Introduction
Plants resist herbivorous insects through a combination of constitutive or induced defenses that are
generally manifested through poor feeding, abnormal development, low fecundity or even mortality.
Various molecular and biochemical approaches can be used to determine the role of constitutive or
induced plant defense responses against herbivory [1–3]. These approaches are equally useful to reveal
complex plant-insect interactions that may assist in identification of candidate genes involved in plant
defense response [4,5].
Rice is susceptible to a number of insect pests that affect its yield and quality; consequently, several
modern rice varieties have so far selectively been developed with resistance to insect pests [6].
Resistant varieties differ considerably in their responses to guard against pests particularly due to the
presence of resistant (R) genes. For instance, rice varieties may be bred with R genes for resistance to
stem borers, planthoppers or a combination of genes for resistance against multiple pests.
Nevertheless, the induction of plant defense mechanisms that includes the production of nutritional and
defensive proteins, phenolic compounds or protease-inhibitors and so will strongly contribute towards
protecting the plants against insect damage [4,7,8]. Although the presence of R genes potentiates rice
defense mechanisms against herbivores, the role of other non-R gene like mechanisms and their
mutual interaction with R genes during herbivory cannot be excluded [6–9]. Broadly speaking, the
overall resistance to insect infestation will be a cumulative response of different cellular processes in
the plant, including input of R and non-R genes that may be interacting particularly during stress to
help the plant express their defense response. Elucidating the complex phenomena of rice defense is
will be important to plan rice resistance strategies for existing and emerging pests.
The brown planthopper (BPH), Nilaparvata lugens Stål (Hemiptera: Delphacidae), is a secondary
pest of rice and causes significant economic loss to susceptible rice cultivars [10,11]. Continuous
Int. J. Mol. Sci. 2013, 14
3923
feeding by BPH populations for several days on rice in the field may lead to hopperburn, a condition
resulting from wilting of tillers [9]. Growing resistant varieties of rice is considered the most
effective and environment friendly way to control the BPH. So far, more than 20 rice genes and
quantitative trait loci (QTLs) have been identified and introduced to various cultivars through breeding
in order to confer BPH resistance [11,12]. Rice resistance through the introduction of QTLs has been
shown to be effective against BPH [13]. However, due to the genetic complexity between resistant rice
cultivars, it has been difficult to explain the function QTLs play in the resistance mechanisms against
BPH that further hinders the performance of resistance cultivars in different environments. Expression
analysis of global genes and proteins is one strategy to understand molecular responses of rice plants
during BPH stress to elucidate how different genes and proteins involve and interact during defense
activities and help their selection for use in breeding rice resistance against BPH.
Rice defense against BPH has been well documented and the factors involved in rice resistance
against BPH are usually associated with the differential regulation of genes and proteins during
infestation [7,10,11,14,15]. Many studies revealed physiological and metabolic changes in rice plants
during BPH feeding [4,7–11]. Such alterations in rice plant with BPH infestation also accompany
transcriptional activation or repression of plant genes and reorganization of the gene expression profile
during stress [7,8,14]. It seems that not only the genes associated with cell defense are induced by
BPH, genes that are involved in plant metabolism are also altered possibly through reallocation
of necessary metabolites required for growth, reproduction, and storage towards defense activities
instead [11]. In this process, the genes associated with abiotic stress, pathogen stress and signaling
pathways are reduced, whereas photosynthesis and defense related genes are increased [7,8,14].
Extensive expression analysis of genes and proteins has facilitated the identification of several distinct
genes affected by BPH feeding in rice that helped to differentiate susceptible vs. resistant rice
cultivars [9,11,15–17]. For example, 160 unique genes were identified that responded to BPH
infestation [15]. Similarly, proteomics approach differentiated a susceptible line from a resistant line
carrying a resistance gene BPH15 and identified additional eight genes differentially expressed in rice
with BPH infestation [9]. Advances in these tools and the ability to differentiate plant reaction to BPH
stress suggests for a significant role expression analysis can play in developing rice resistance to BPH.
Mutational approach can play significant role in identifying proteins involved in rice response under
specific physiological conditions such as abiotic and biotic stress [18]. A comparative proteome
analysis involving wild type rice and the mutants revealed contrasting differences in proteins induced
in contrasting genotypes [19,20]. Rice blast lesion mimic mutant (blm) was differentiated from wild
type plants based on pathogenesis-related class 5 and 10 proteins including a novel OsPR10d protein
specific to the mutants’ response. This study also reported increase in phytoalexins and oxidative stress
related marker proteins in blm mutant [20]. In another study, more than 150 protein spots were
identified as differentially regulated between normal leaves of wild type and spotted leaves of the spl6
rice mutant, indicating the potential of proteomics to elucidate molecular response of rice [21].
Proteomics of rice mutants, will certainly help to elucidate different proteins potentially involved in
rice interaction with BPH and explain rice defense strategies against biotic stress [22] This approach
could be useful to explore QTL dependent resistance in rice cultivars such as IR64 and its mutants.
IR64 is a modern rice variety developed at International Rice Research Institute (IRRI) that carries the
major gene Bph1 and other minor genes located in a QTL responsible for resistance to BPH. The
Int. J. Mol. Sci. 2013, 14
3924
durable nature of BPH resistance in IR64 is thought to be due to synergy with minor genes, which
contribute to a combined resistance through the mechanisms of antixenosis, antibiosis and tolerance [13].
The mutants of this cultivar have been developed at IRRI [23] and used for elucidating various
physiological responses of rice.
The objective of the present study is to describe the proteomic responses of indica rice IR64 and
two of its chemically generated mutants, one resistant and one susceptible to BPH infestation. Previous
study with these IR64 mutants found no growth or yield penalty under normal field conditions [23].
The contrasting phenotypes expressed by mutants that are essentially near-isogenic offer an
opportunity to perform genetic analysis in response to BPH infestation and identify specific genes or
proteins related to rice resistance. We performed a time-series analysis of gradual BPH stress on IR64
to identify BPH induced proteins. These proteins were further compared between wild type IR64 and
the mutants to explain potential role of differentially altered proteins with BPH infestation.
2. Results
2.1. Rice Phenotype during BPH Stress
Using a modified seedbox screening technique [13] ten-day-old seedlings were uniformly infested
with 3–4 second-instar BPH nymphs with free choice to settle on their preferred host. Hopperburn
symptoms were observed at different intervals (Table 1). Following infestation, continuous feeding by
growing second generation BPH nymphs caused wilting of the seedlings, leading to hopperburn
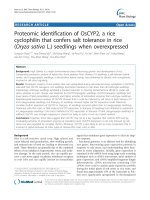
(browning of stem and leaves) symptoms first on D1131, followed by IR64 and finally on D518
(Figure 1). Early on infestation (T1 and T2), damage symptoms were not detected on infested plants.
This is likely due to a low number of nymphs that were initially released on plants, which did not
cause enough damage and plants were able to overcome low level of insect stress. The difference in
phenotype among the mutants and IR64 was more obvious at T3 and T4 (28 DAI and 34 DAI,
respectively). The average leaf damage rate was recorded on a modified 1–9 scale (1 = resistant,
9 = highly susceptible) [23]. Leaf damage at T3 was lowest for D518 (3.5), intermediate for IR64 (5.2),
and highest for D1131 (6.8).
Table 1. Comparative reaction of IR64 and mutants to brown planthopper (BPH) infestation
at different times (T1 = 2 days; T2 = 14 days; T3 = 28 days; T4 = 34 days). The infested plants
were observed for BPH feeding damage and rated using a 1–9 scale (1 = Resistant, no damage
symptoms; 3 = Slight damage, pale outer leaves; 5 = wilting on 50% leaves, slight stunting;
recovery possible if insects removed; 7 = Severe hopperburn, only one or two leaves green,
no recovery possible; 9 = Highly susceptible, complete wilting). (n = 15, Mean ± SE).
Rice line
IR64
D518
D1131
T1
1.0 ± 0.0
1.0 ± 0.0
1.0 ± 0.0
BPH damage (1–9 scale)
T2
T3
1.6 ± 0.55
3.6 ± 0.55
1.4 ± 0.48
3.0 ± 0.76
1.8 ± 0.59
4.8 ± 0.65
T4
5.2 ± 0.85
3.6 ± 0.56
6.8 ± 0.66
Figure 1. Phenotype of wild type IR64 and mutant plants exposed to brown planthopper
(N. lugens) infestation under greenhouse conditions during seedbox screening (free choice).
Int. J. Mol. Sci. 2013, 14
3925
Pre-germinated seeds were sown in the heat sterilized soil in seed boxes a density of 15
seedlings per row. Hopperburn symptoms appeared first on D1131, followed by IR64 and
lastly on D518. The experiment was repeated 3 times.
2.2. Proteome Analysis of BPH Induced Proteins in IR64
The proteome response of wild type IR64 during BPH infestation over 5-week period after
infestation was first studied. This is a condition that simulates natural infestation on rice under field
conditions. Among 1500 protein spots visualized on silver stained 2-D polyacrylamide gel (3–10 pH),
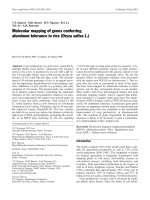
65 protein spots were found altered (p < 0.001) with BPH infestation (Figure 2) at pI 4–7, whereas the
remaining spots were detected with pI > 7.0 (figure not shown). Mixed models ANOVA using BPH
induced proteins in the control and BPH infested IR64 treatments shows that a larger cohort of these
proteins was changed only during T3 and T4 stage, indicating higher stress response at the later stage
(Figure 3). Since the effect of BPH stress was more evident at T3 (28 DAI), we compared the protein
abundance at T3 in isolation using control and BPH infested plants. Comparison of protein abundance
(spot volume of infested/control at T3 showed that a total of 36 proteins increased >1.5 fold while
29 proteins showed <0.5 fold decrease with BPH infestation. The protein abundance showed a
reduction through time as the plants entered senescence at T4 (34 DAI).
Int. J. Mol. Sci. 2013, 14
Figure 2. 2-D gel electrophoresis of IR64 leaf sheath proteins following brown
planthopper (N. lugens) infestation (left panel) and control (right panel) condition. Total
plant proteins extracted using TCA-Acetone method were separated on 15% SDS PAGE
using non linear (NL) 18-cm IPG strips. The gels were stained with silver nitrate for
protein detection. The red boxes represent down regulated proteins whereas green boxes
represent up regulated proteins after BPH infestation.
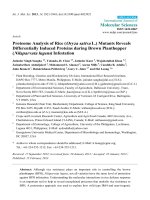
Figure 3. Abundance of brown planthopper (N. lugens) responsive proteins in IR64 at
different days after BPH infestation (DAI) (T1 = 2 DAI; T2 = 13 DAI; T3 = 28 DAI; T4 = 34
DAI). The figure shows log2 values of proteins [BPH infested (T)/control (C)] at different
time points. (n = 3; p < 0.05). The protein legends in the figure represent induction
response of IR64 proteins (log 2 value) after BPH infestation
3926
Int. J. Mol. Sci. 2013, 14
3927
Figure 3. Cont.
Based on matrix assisted laser desorption ionization time-of-flight (MALDI-TOF) and quadrupole
time-of-flight (Q-TOF) mass spectrometry, the identity of 52 proteins was generated; 27 proteins with
increased abundance and 25 proteins with decreased abundance (Table 2). Peptide mass of the
remaining 13 of total 65 protein spots did not match with any known proteins in the NCBI protein
database. These BPH responsive proteins were classified into 11 functional categories [24] of which
39% belonged to energy category, whereas 16% were stress and plant defense related. The identity and
function of 20% of BPH responsive protein spots in IR64 are not known. In general, the dominating
category of BPH affected the functional group involved photosynthesis and metabolism related
proteins. BPH induced proteins related to photosynthetic processes were identified as Rubisco activase
(Ract), various rubisco large subunits, ferredoxin [(flavodoxin-NADP(H)] reductase (FNR) and
oxygen evolving enhancer protein 3 (OEE3) in IR64. This indicates that photosynthesis was one of the
common responses to BPH infestation. Likewise, oxidative stress response proteins such as ascorbate
peroxidase (APX), GSH dependent dehydro-ascorbate reductase, and CuZn superoxide dismutase
(SOD) were identified as BPH stress response proteins in IR64. Abundance of multiple spots of
ribulose bisphosphate carboxylase large (rubisco, rbcl) subunits (4 spots), ascorbate peroxidase (APX)
(5 spots), unnamed protein (2 spots), oxygen evolving enhancer protein 3 (2 spots), and enolase
(2 spots) may represent post translational modifications during BPH stress or presence of multiple
gene copies of these proteins in rice.
Table 2. List of 52 leaf sheath proteins induced during BPH stress on rice variety IR64.
Spot
PM
(%C)
Identity/source
Accession
Exp.
(Theo.) Mr
Exp.
(Theo.) pI
Mascot
score
Fold
change
P-value
gi11955
gi476752
gi11466795
17.2(52.8)
17.3(45.1)
17.2(52.8)
4.5(6.13)
4.6(8.4)
5.1(6.2)
64
104
98
>10 ↑
>10 ↑
4.56 ↑
0.047
0.006
0.008
gi37533338
23.7(52.8)
5.4(6.4)
128
1.53 ↑
0.130
gi476752
24.9(45.1)
6.1(8.4)
174
>10 ↑
0.005
Energy/pentose phosphate
1
2
3
2(4)
1(4)
2(5)
5
3(9)
10
5(13)
Rubisco large subunit
Rubisco large subunit
Ribulose bisphosphate
carboxylase/oxygenase
large chain
Rubisco large subunit
from chromosome 10
chloroplast insertion
Rubisco large subunit
Int. J. Mol. Sci. 2013, 14
3928
Table 2. Cont.
Spot
PM
(%C)
Identity/source
Accession
Exp.
(Theo.) Mr
Exp.
(Theo.) pI
Mascot
score
Fold
change
P-value
RA*
–
P93431
47(42.07)
5.0(5.0)
–
11.45 ↓
0.0019
Rb
3(9)
Ribulose bis
phosphate
carboxylase/
oxygenase activase
Rubisco large subunit
gi2734976
34.1(43.7)
6.3
332
3.35 ↑
0.006
gi50938199
18.7(22.9)
9.8(9.8)
114
Ind ↑
0.0053
Q6ZFJ3_
ORYSA
gi50938199
36.0(40.8)
5.9(7.9)
90
4.21 ↓
0.0114
14.5(22.9)
9.9(9.8)
400
2.57 ↓
0.0053
gi33113259
gi780372
37.8(47.9)
39.9(47.9)
5.5(5.4)
6.7(5.4)
77
104
Ind ↑
7.95 ↑
0.0009
0.0522
P48494
27.5(27.1)
5.6(5.4)
70
<10 ↓
<0.0001
G3PC_
HORV
37.4(33.2)
6.7(6.2)
258
9.6 ↓
0.0090
gi34894800
57.0(52.6)
6.6(7.2)
111
<10 ↓
0.0011
gi51536124
41.2(41.3)
6.6(6.7)
100
<10 ↓
0.0005
Q40677
37.7(36.4)
5.7(5.8)
–
1.31 ↓
0.1620
gi50912809
25.5(26.2)
4.3(4.9)
305
3.57 ↓
0.202
gi50905037
28.1(27.2)
5.5(6.5)
300
4.89 ↓
0.0007
Energy/photosynthesis
61
1(33)
34
13
(38)
3(44)
63
Putative oxygen
evolving enhancer
protein 3-1
chloroplast precursor
Ferredoxin-NADP
(H) oxidoreductase
Putative oxygen
evolving enhancer
protein 3-1
chloroplast precursor
Energy/glycolysis
32
37
TP
2(8)
14
(49)
8(25)
9
6(33)
44
6(27)
35
3(17)
FB*
–
Enolase
Enolase
Triose phosphate
isomerase, cytosolic
Glyceraldehyde-3phosphate
dehydrogenase,
cytosolic
Putative
dihydrolipoamide
dehydrogenase
precursor
Formate
dehydrogenase
Fructose
bisphosphate aldolase
Energy/electron transport
58
3(34)
30
8(50)
Putative H(+)−
transporting ATP
synthase
Probable ATP
synthase 24 kDa
subunit
Int. J. Mol. Sci. 2013, 14
3929
Table 2. Cont.
Spot
PM
(%C)
Identity/source
Accession
Exp.
(Theo.) Mr
Exp.
(Theo.) pI
Mascot
score
Fold
change
P-value
L-Ascorbate
peroxidase 2,
cytosolic Oryza
sativa subsp. japonica
(Rice)
Putative ascorbate
peroxidase
Ascorbate peroxidase
Putative ascorbate
peroxidase
Ascorbate peroxidase
Superoxide dismutase
APX2_
ORYSJ
26.3(27.1)
5.3(5.2)
65
>10 ↑
0.0005
gi50920595
26.2(27.1)
5.2(5.4)
94
3.16 ↑
0.0604
gi50940199
gi50920595
28.0(27.1)
22.6(27.1)
5.5(5.2)
6.5(5.4)
239
71
5.55 ↑
3.49 ↓
0.0007
0.0041
gi50940199
P93407
29.1(27.1)
17.7(15.7)
5.2(5.2)
5.8(5.3)
419
–
<10 ↓
1.47 ↓
<0.0001
0.0652
gi17105171
28.2(28.4)
5.1(5.2)
187
1.6 ↓
0.1033
gi34904362
29.1(21.8)
4.9(4.9)
153
Ind ↑
0.0003
BAA90672
27.0(27.1)
6.1(5.4)
–
4.03 ↓
0.0009
gi34904362
30.3(21.8)
4.9(4.9)
179
4.6 ↓
0.0029
gi50910077
43.7(50.4)
4.3(6.19)
306
Ind ↑
0.0012
gi50934241
17.2(14.8)
5.3(5.3)
290
2.64 ↑
0.0390
XP_
478772.1
26.4(29.7)
6.0(9.3)
66
2.77 ↓
0.0007
OS02g42290
gi51091339
30.2(31.9)
27.2(25.4)
5.7(6.7)
4.9(5.9)
70
60
1.77--↑
4.58 ↓
0.0051
0.0148
ACT_MESVI
68.3(41.5)
5.8(5.3)
181
7.27 ↑
0.0097
Plant defense
13
6(32)
14
5(36)
28
49
5(39)
5(36)
12
SOD *
5(50)
–
Stress induced
LD7
3(23)
27
4(38)
21 *
–
23
3(40)
Drought induced
S-like RNase protein
Unnamed protein
product (Salt stress
induced protein)
GSH-dependent
dehydro ascorbate
reductase
Unnamed protein
product (Salt stress
induced protein)
Protein synthesis
64
3(23)
4
3(45)
22
8(34)
Chloroplast
translation elongation
factor Tu1
Putative ribosomal
protein s12
Putative ribosome
recycling factor,
chloroplast precursor
Protein destination and storage
CP
24
6(23)
3(20)
Putative clp protease
Putative chaperonin
21 precursor
Growth and division
41
4(20)
(O65316) Actin
(Mesostigma viride)
Int. J. Mol. Sci. 2013, 14
3930
Table 2. Cont.
Spot
PM
(%C)
Identity/source
Accession
Exp.
(Theo.) Mr
Exp.
(Theo.) pI
Mascot
score
Fold
change
P-value
Putative
1,4-benzoquinone
reductase
Putative
NADPH-dependent
mannose 6-phosphate
reductase
Glyoxalase I
gi34910128
24.7(21.7)
6.3(6.0)
79
Ind ↑
0.0004
gi50904895
36.3(35.4)
6.2(5.9)
142
>10 ↓
0.0106
gi16580747
34.0(32.5)
5.5(5.5)
173
9.12 ↓
0.0004
Putative
proteophosphoglycan
Putative defective
chloroplasts and
leaves (DCL) protein
Oryza sativa
Putative FH protein
NFH2.-Oryza sativa
(japonica
cultivar-group)
Hypothetical protein
P0677B10.12
Putative
glyceraldehyde-3phosphate
dehydrogenase
(Phosphorylating)
Oryza sativa
hypothetical protein
OsJ_015102
[Oryza sativa]
hypothetical protein
OsJ_012934
Vitellogenin
[Nilaparvata lugens]
Chain E,
Leech-Derived
Tryptase Inhibitor
TRYPSIN COMPLEX
Putative DREPP2
protein
hypothetical protein
OsI_021661
gi50918953
74.0(96.8)
4.4 (10.5)
104
Ind ↑
0.0001
Q6UUF7_
ORYSA
30.8(21.3)
6.9(9.0)
69
Ind ↑
0.04
Q8S0F0_
ORYSA
13.3(10.2)
4.7(8.9)
66
Ind ↑
0.0099
Q67VJ8_
ORYSA
gi115459078
52.5(12.5)
5.1(9.3)
68
Ind ↑
0.0185
37.2(36.5)
7.8(7.68)
94
1.75 ↑
0.0341
gi125591269
70.0(25.3)
6.4(11.0)
66
Ind ↑
0.0185
gi125589101
32.0(35.2)
6.1(5.3)
76
1.37 ↓
0.0277
gi342318865
72.5(22.7)
7.9(8.5)
64
Ind ↑
0.0372
gi3318722
97.5(23.4)
6.7
240
Ind ↑
0.0139
gi50906969
32.0(24.0)
4.8(4.7)
105
8.47 ↓
0.0003
Q5Z6P9_
ORYSA
47.0(43.0)
4.7(4.7)
109
3.55 ↓
0.0095
Secondary metabolism
47
3(21)
26
4(20)
31
4(23)
Miscellaneous
20
9(15)
53
8(41)
59
18
(27)
60
4(53)
69
12
(44)
40
9(40)
B
6(24)
39
5(3)
39a
9(12)
17
2(18)
62
11
(36)
Int. J. Mol. Sci. 2013, 14
3931
Table 2. Cont.
Spot
PM
(%C)
Identity/source
Accession
Exp.
(Theo.) Mr
Exp.
(Theo.) pI
Mascot
score
Fold
change
P-value
38
19
(26)
Q3P3H8_
9GAMM
70.0(81.6)
6.6(5.9)
78
Ind ↑
0.0050
42
12
(38)
gi115488340
68.7(41.5)
6.3(8.5)
135
1.87 ↓
0.0476
68
8(22)
ATP-dependent DNA
helicase UvrD
Shewanella
denitrificans OS217
Os12g0420200
[Oryza sativa
(japonica
cultivar-group)]
Succinyl-CoA ligase
[ADP-forming]
subunit beta OS =
Mesorhizobium sp.
(strain BNC1)
SUCC_
MESSB
35.5(42.2)
7.5(5.0)
74
1.59 ↓
0.0327
Notes: * = Proteins identified by Salekdeh et al. 2002 [25]; PM = Peptides matched; %C = Percent coverage;
Exp. = Experimental; Theo. = Theoretical; Mr = molecular weight; pI = isoelectric point; Ind = Proteins induced only in
BPH infested plants.
Abundance of several oxidative stress-response proteins, drought (#LD7) and two salt stress
(#23 and #27) response proteins was altered with BPH stress as observed at T3 (Figure 4). Repeated
measures analysis with individual spot abundance in control and BPH infested plants indicated that the
spots #13, #14 and #28 were consistently increased (p < 0.05) with BPH stress over time whereas spots
#12, #21, #23, #49 and #LD7 showed significant decrease as compared to the control (p < 0.05) over
time (Figure 4). Although the protein “#LD7” (S-like RNase) was less changed with BPH infestation
as compared to the control plants, protein levels increased through time during infestation (p < 0.05).
The abundance of protein spots #23 and #27, which showed similarity to salt stress root protein “RS1”
(Gi34904362) [25], also changed differentially with BPH infestation at different times, particularly at
T3 and T4 (p < 0.05). At T3, the abundance of protein #23 decreased > 2 times (p < 0.05) than in
control plants, while the protein spot #27 which remained suppressed in control plants, was however
more abundant with infestation through all four time points (Figure 4).
2.3. Rice Proteins Induced in BPH Infested Plants
The abundance of 16 protein spots (spot #20, #32, #38, #39, #-39a, #40, #43, #45, #47, #50, #53,
#57, #59-61 and #64) was observed (Figure 5) at different time points only in BPH infested plants.
Interestingly, a change in the protein levels of the spot #20 (proteophosphoglycan, PPG), spot #50 and
spot #64 (EFTu1) was also observed at T1 and or T2 indicating that these proteins accumulate in IR64
during early BPH-induced stress (Figure 5). Induction of proteophosphoglycan (#20), putative
1,4-benzoquinone reductase (#47), Putative defective chloroplasts and leaves (DCL) protein (#53),
Putative FH protein NFH2 (#59), hypothetical protein P0677B10.12 (#60), putative oxygen evolving
enhancer protein 3-1, chloroplast precursor (#61) and chloroplast translation elongation factor Tu1
(#64) have not been reported earlier in BPH-rice interactions and may have role in rice resistance to
Int. J. Mol. Sci. 2013, 14
3932
BPH infestation. The highest levels of these proteins was observed with spot #64 (spot density =
12.58 ± 1.52) at T3 as compared to the abundance of other proteins whereas the spot #39 (0.20 ± 0.06)
was least induced with BPH infestation. The abundance of all these BPH induced proteins, except
spots #32 (enolase), #43 (unknown), and #47 (putative 1,4-benzoquinone reductase) showed declining
trend at T4 as the plants started to senesce.
Figure 4. Relative protein abundance of brown planthopper (N. lugens) altered stress- and
defense-related proteins in BPH infested and control IR64 at different days after infestation
(DAI) (T1 = 2 DAI; T2 = 13 DAI; T3 = 28 DAI; T4 = 34 DAI). The protein abundance
was quantified with Melanie3 software. Mixed models ANOVA was used for repeated
measures analysis of proteins. Mean ± SE (n = 3).
A few proteins identified in this study were also non-rice proteins (#38, #39, #39a and #68). Spot
#38 was identified as “ATP-dependent DNA helicase UvrD (Shewanella denitrificans OS217)”. Also
#39a with molecular weight of 97.5 kDa showed similarities to leech derived protease inhibitor
protein (LDPI) and #39 showed a similarity with “Vitellogenin” from BPH. Spot #68 matched to
“Succinyl-CoA ligase [ADP-forming] subunit beta OS = Mesorhizobium sp. (strain BNC1)”. These
proteins could be either BPH associated proteins injected into rice sheath during feeding or
environmental contaminants that colonized BPH wounded rice plants.
2.4. Comparative Proteomics of IR64 and Mutants
To understand the defense response of rice against BPH infestation, the protein levels in control and
BPH infested IR64 were compared with gain (D518) and loss of resistance (D1131) mutants of IR64 at
T3. These mutants were previously identified during a screening of chemically generated IR64 mutants
against BPH using a modified seedbox screening technique [23]. Field performance of these mutants
did not show compromise in agronomical traits due to mutations.
Int. J. Mol. Sci. 2013, 14
3933
Figure 5. Relative abundance of brown planthopper (N. lugens) responsive proteins in
IR64 at different days after BPH infestation (DAI) (T1 = 2 DAI; T2 = 13 DAI; T3 = 28 DAI;
T4 = 34 DAI)). Mean ± SE (n = 3).
By comparing the protein abundance (protein volume in BPH infested/control) between IR64 and
the mutants, 22 proteins were identified that showed differential abundance (Table 3). Ten proteins
were altered in a unique manner in the susceptible mutant (D1131) when compared to IR64 and
resistant mutant (D518). Among these proteins, eight proteins (spot #7, #43, #45, #47, #53, #57, #59, #B)
were significantly increased (p < 0.05) whereas two proteins (#21 and #32) were highly decreased in
D1131 (p < 0.05) than in D518 and IR64. The protein #27 generally increased with BPH stress,
however showed little change in D1131 whereas comparatively, the abundance of this protein was in
greater quantities in IR64 and D518 following BPH infestation (p = 0.018). In contrast, twelve proteins
were linked to a D518 related response to BPH (Table 3). Three proteins (#35; #38 and #40) were
significantly (p < 0.05) reduced in D518 during BPH stress; another five proteins (#9, #21; #29, #30
and #31) were least affected in D518 whereas the same proteins were decreased in IR64 and D1131
(p < 0.05). Similarly, two proteins (#27 and #LD7) showed higher levels (p < 0.05) in D518 as
compared to IR64 and D1131 The abundance of protein #64 was higher than D1131 but this difference
was not significant than IR64. Two proteins (#8 and #41) though increased in abundance, but to a
Int. J. Mol. Sci. 2013, 14
3934
lesser extent (p < 0.05) in D518 compared to IR64 and D1131. The abundance of spot “LD7”
exceptionally increased in D518 but reduced in IR64 and D1131 with BPH stress. When compared
over time after BPH infestation, the protein spot #LD7 remained unchanged at T1 and T2, increased to
greater quantities at T3 and decreased thereafter at T4 in D518.
From the biplot analysis, it is clear that the variation in the levels of specific proteins was associated
with specific factors. For example, the variation in the abundance of proteins #12, #29, #23, #35, #48
and #49 were associated with the control. Furthermore, all proteins whose eigenvectors are travelling
in the same direction as the thick eigenvectors, are associated with that factor. Likewise, #LD7 was
associated with D518 and to a lesser extent IR64. Several proteins including #64, #28, #13, #32 were
associated with the “BPH infested” treatment. Variability in the protein 11 (unknown protein) was the
only one clearly associated with D1130 (Figure 6a). Similarly, broader random experimental factors
can be included to evaluate responses to covariates (Figure 6b). Variation in the abundance of proteins
located on the right side of the biplot (Figure 6b) indicates that change in protein levels was associated
with the progression of “time” and the presence of “BPH infestation”, whereas proteins on the left side
of the biplot were associated with the lack of treatment or control as well as the earlier time points.
Interestingly, levels of protein #a (unknown protein) was strongly associated with D518 and
conversely, variation in the induction of protein #4 (Putative ribosomal protein s12) was associated to
a lesser degree with D1131 and to a greater degree BPH infestation. IR64 did not explain a significant
proportion of variation in the protein abundance data.
Figure 6. Redundancy analysis (RDA) biplot of protein abundance over the duration of the
experiment. All factors are illustrated as thick vectors and include Control, Treatment
(BPH infested), Loss of resistance (D1131), Gain of Resistance (D518), Wild type (IR64),
and Time. Proteins are illustrated as thin vectors and consist of the proteins levels which
are listed as a number as described in Table 2. Eigen values (lambda) are 0.324, 0.050,
0.010, and 0.004 using data at T3 (a) and all 4-time points (b) Monte Carlo test
(1000 permutations) for all canonical axes: F-ratio = 8.490, P = 0.001.
(a)
(b)
Int. J. Mol. Sci. 2013, 14
3935
Table 3. Comparative abundance of BPH induced proteins between IR64 and the mutants
(D518 and D1131) at 28 DAI (Time 3). Superscript letters indicate significant difference in
abundance between IR64 and the mutants. Values with same superscript letters are not
different (p > 0.05), (n = 3, Mean ± SE).
Protein
Unknown
GSH-dependent dehydro
ascorbate reductase
Enolase
Unknown
Unknown
Putative
1,4-benzoquinone reductase
Putative defective
chloroplasts and leaves
(DCL) protein Oryza sativa
Unknown
Putative FH protein NFH2
Oryza sativa
(japonica cultivar-group)
Hypothetical protein
OsJ_012934
S-like Rnase
Unknown
Glyceraldehyde-3-phosphate
dehydrogenase, cytosolic
Salt stress root protein “RS1”
Unknown
Probable ATP synthase
24kDa subunit
Glyoxalase I
Formate dehydrogenase
ATP-dependent DNA
helicase UvrD Shewanella
denitrificans OS217
Hypothetical protein
OsJ_015102
(O65316) Actin
(Mesostigma viride)
EFTu1
Spot
D518
D1131
b,
7
1.06 ± 0.07 *
21
0.81 ± 0.11 a,▼
32
43
45
2.18 ± 0.30
IR64
a,▲
Prob. > F
b,
1.17 ± 0.14 *
0.014
0.47 ± 0.12 b,▼▼
0.73 ± 0.01 a,▼
0.059
0.77 ± 0.19 a,▼
1.04 ± 0.20 b,*
1.68 ± 0.34 a,b,▲
0.31 ± 0.12 b,▼▼
1.81 ± 0.11 a,▲
3.46 ± 0.67 a,▲▲
1.24 ± 0.15 a,*
1.10 ± 0.21 b,*
1.58 ± 0.54 b,▲
0.011
0.042
0.085
47
0.89 ± 0.19 b,*
1.85 ± 0.20 a,▲
0.62 ± 0.05 b,▼
0.004
53
0.67 ± 0.19 b,▼
1.76 ± 0.17 a,▲
0.72 ± 0.25 b,▼
0.018
57
0.51 ± 0.06 b,▼
3.10 ± 1.42 a,▲
0.58 ± 0.13 b▼
0.008
59
0.61 ± 0.06 a,▼
1.14 ± 0.10 b
0.55 ± 0.12 b,▼
0.011
B
1.18 ± 0.09 b,*
1.67 ± 0.10 a,▲
0.74 ± 0.07 c,▼
0.002
LD7
8
2.07 ± 0.37 a,▲
2.58 ± 0.42 b,▲
0.37 ± 0.07 b,▼
9.15 ± 1.08 a,▲▲▲
0.62 ± 0.15 b,▼
9.71 ± 2.44 a,▲▲▲
0.005
0.030
9
0.27–0.05 a,▼▼
0.11 ± 0.01b▼▼▼
0.10 ± 0.02 b,▼▼▼
0.024
27
29
4.09 ± 0.24 a,▲▲
0.37 ± 0.05 a,▼
1.95 ± 1.36 b,▲
0.19 ± 0.03 b,▼▼▼
2.75 ± 0.17 a,b,▲
0.08 ± 0.02 b,▼▼▼
0.018
0.008
30
0.43 ± 0.01 a,▼
0.18 ± 0.02 b,▼▼▼
0.20 ± 0.02 b,▼▼▼
0.061
31
35
0.94 ± 0.09 a,*
0.46 ± 0.09 b,▼
0.47 ± 0.07 a,b,▼▼
1.28 ± 0.17 a,*
0.33 ± 0.01 b,▼▼
1.16 ± 0.21 a,*
0.087
0.015
38
0.49 ± 0.15b,▼
1.39 ± 0.21a,▲
1.04 ± 0.32 a,*
0.011
40
0.33 ± 0.07 b,▼
1.20 ± 0.12 a,*
0.99 ± 0.29 a,*
0.041
41
1.81 ± 0.36 b,▲
5.94 ± 1.08 a,▲▲
7.27 ± 1.33 a,▲▲
0.021
64
14.05 ± 1.49 a,▲▲▲
7.78 ± 0.83 b,▲▲
12.58 ± 1.52 a,▲▲▲
0.065
▲
* No significant change in protein abundance compared to 1 (protein volume in BPH infested/control); ( ) Increase in
protein abundance; (▲▲▲) Highly increased in abundance; (▼) Decrease in protein abundance; (▼▼▼) Highly decreased
in abundance.
Int. J. Mol. Sci. 2013, 14
3936
3. Discussion
Rice resistance to brown planthopper (BPH) is intricate involving genetically controlled defense
mechanisms. Despite the existing knowledge of a large collection of rice genes, the molecular response
involved in rice stress physiology particularly during interactions with BPH remained elusive. Mutants
are valuable source of genetic diversity for gene discovery that could provide valuable information to
explain plant defense mechanisms [18–20,26]. We used mutants of the indica rice IR64 that differ in
their response to BPH infestation to facilitate the understanding of rice resistance mechanisms to this
economically important pest of rice. The time dependent differential change in the levels of BPH
response proteins in rice helped to discriminate wild type with the mutants and revealed candidate
proteins involved in plant resistance against BPH infestation.
Initially, the response of wild type IR64 was determined during BPH infestation, and proteins
related to various functional categories were identified in BPH infested IR64; nevertheless
photosynthesis, metabolism, and oxidative stress related proteins were predominantly altered (Table 2).
It has been reported that BPH infestation reduces photosynthetic activity in rice due to excessive loss
of plant assimilates, decreased leaf area and wilting [11,27]. Phloem feeding insects are generally
known to alter the expression of genes required for photosynthesis [14,28]. However, the role of
housekeeping proteins such as those related to photosynthesis cannot be ruled out in defense against
insects as housekeeping genes could shift their role towards defense metabolism to manage the
increased energy demands during stress [29,30]. For instance, photosynthesis-related genes altered
during plant-insect interaction contributed towards defense needs while protecting the basic
photosynthetic capacity [29,30]. We also found a number of Rubisco large subunit fragments (RLSU)
with BPH infestation. Similar observations have been reported with abiotic and biotic stresses in
rice [31,32]. Presence of several Rubisco large fragments (rbcl) with various experimental molecular
weights and pIs could also be due to oxidative stress induced fragmentation of the major Rubisco
protein which is an abundant source of macronutrients such as nitrogen in senescing leaves [31,33,34].
This supply of nitrogen during stress might serve as fuel for metabolic processes increased during BPH
feeding stress.
We also observed changes in the levels of several antioxidant proteins that are known to scavenge
excessive reactive oxygen species generated under stress [9,31,35,36]. Some of these oxidative
enzymes can be antinutritive to insects [37,38]. Increased levels of oxidative enzyme activity might
have adverse effect on the BPH performance thus helping to reduce damage. Similarly, generation of
ROS can also act as stress signals to induce defense related genes during insect infestation [39]. Few
ascorbate peroxidase (APX) isoforms were found to be induced as early as 13 DAI (Figure 4),
indicating their primary importance during BPH infestation and implication in defense signaling.
Moreover, we observed differential levels of APX related proteins in BPH infested IR64 as three of the
APXs were increased whereas two were decreased during the infestation which is in agreement with
previous studies on differentially induced ascorbate peroxidase isozymes during oxidative stress [40].
Induction of proteins during stress is important in dealing with the stress-induced metabolic
homeostasis through readjusting metabolic pathways and reallocation of plants’ resources for
defense [41–43]. During such response, proteins may be reduced or increased in activity as evidenced
in this study. We observed 64 proteins induced with BPH infestation and 52 of these were identified
Int. J. Mol. Sci. 2013, 14
3937
(Table 2), some of these might have role in higher energy demands during stress. This seems plausible
as many of these proteins (Table 2, Figures 4 and 5), except for few non-rice proteins (#20, #38, #39,
#39a, #40, #41, #68), are plant stress response proteins. These induced proteins could be by-products
of stress metabolism or post translation modification but may also represent molecules needed in
signal transduction or acclimation response of plants during stress [42]. Fifteen proteins (Figure 5)
were observed only in BPH infested plants whereas these proteins were absent in controls. BPH
induced proteins, some of which are still unknown, are potentially involved in rice defense during
BPH stress. Induction of several other proteins (#23, #27 and #LD7) during BPH stress showed rice
response similar to that observed in abiotic stress such as drought and salinity [25]. Excessive loss of
phloem sap and impaired water movement during BPH infestation leads to wilting like condition
“hopperburn” which is the susceptible response of rice to BPH [9,11]. Phloem feeding insects
generally reduce foliar water potential in plants as a result of extensive feeding and results in the
induction of transcripts associated with water stress [28,44,45]. Any counter activity such as altered
levels of abiotic stress related proteins that could to delay wilting may help to overcome BPH stress.
Up-regulation of drought induced S-like RNase and salt stress induced proteins in BPH infested rice
points the need for exploring these proteins in rice defense response to BPH stress.
Comparative analysis was performed to differentiate the proteome response of mutants from the
IR64. Defensive response of mutants was demonstrated by differential pattern of proteins induced with
BPH infestation. For example, abundance of stress induced glyoxalase I, known with plant defense
activity [46], was reduced in D1131 and IR64 but not to the same extent in D518 (Table 3). A similar
response was evident with GSH-dependent dehydro ascorbate reductase in D518. The protein EFTu1,
similar to 45- kDa heat shock proteins with chaperone like activity [47,48], was induced earlier (T2)
and more intensely in D518 and IR64 (S Figure 1) and its abundance was greater in D518 followed by
IR64 and then D1131. EFTu1 has been reported as an important component of thermo-tolerance in
maize and other environmental stresses [48]. Another two proteins, S-like RNase and spot #27 were
also more abundant in D518 in contrast to moderate levels of these proteins in IR64 and susceptible
mutant D1131 (Table 3). Higher levels of these proteins in D518 could be important in providing
defense to D518 against increasing BPH stress. Similarly, abundance of certain proteins was highly
reduced in D518 during BPH infestation whereas the decrease in protein levels was slow in IR64 and
D1131 suggesting for higher metabolic shift or adjustment of metabolic pathways in the resistant
mutant. On the contrary, some proteins were in greater quantities in D1131 than IR64 and D518 and
may represent a susceptible response during BPH infestation (Figure S1). Several antioxidant enzymes
and their isoforms were affected with BPH stress. Differential modulation of antioxidant proteins in a
resistant and susceptible rice line infested with BPH was previously reported [9]. However, we could
not differentiate IR64 resistance solely from its mutants based on antioxidant proteins such as APX as
levels of these proteins were not different.
Differential induction of drought induced S-like RNase and salt stress induced proteins (spot #23
and #27) suggests for the relationship between rice resistance to BPH and abiotic stress that urges for
exploring abiotic stress tolerant varieties against BPH and vice versa. S-like RNase genes constitute an
important family of RNA-degrading enzymes that have been associated with phosphate starvation,
ethylene responses, senescence and programmed cell death and defense against multiple
stresses [25,49–51]. Sticky digestive liquid from a carnivorous plant, Drosera adelae, contained an
Int. J. Mol. Sci. 2013, 14
3938
abundant amount of S-like RNase which assists plants to obtain phosphates from trapped insects which
help to defend them against microbes [52]. Induced S-like RNase has shown to prevent the growth of
fungal hypha in tobacco [53]. It is likely that increased abundance of S-like RNase may play a role to
protect the resistant cultivar D518 from BPH perhaps by inhibiting stylet or ovipositor movement in
phloem sheath and reduced settling, feeding and egg laying has previously been observed [23]. Further
studies in this area will elucidate mechanisms that S-like RNase and other proteins might play in rice
resistance to BPH. One option is to investigate the interaction of BPH induced rice proteins with
in silico structure analysis and molecular docking (to reveal complexity of rice response to BPH stress
particularly for possible links to phosphate (Pi) starvation, plant-microbe interaction and drought.
Further experiments with in silico and transgenic approach will help to elucidate the precise role of
BPH induced proteins in rice defense to BPH.
4. Experimental Section
4.1. Insect Culture and Plant Material
Brown planthopper (BPH), Nilaparvata lugens (Stal) populations were continuously maintained on
the susceptible variety “Taichung Native 1” (TN1) at the International Rice Research Institute (IRRI),
Los Baños, Philippines. The parent BPH population was collected from rice fields around IRRI,
Laguna. Gravid females were used to get a synchronized hopper stage for infestation.
The Indica rice cultivar IR64 along with its two mutants, i.e., D518 (gain-of resistance) and D1131
(loss-of-resistance) generated through the chemical and radioactive mutagenesis of IR64 [23] were
used for this study. The mutant D518 shows enhanced resistance during BPH infestation whereas
D1131 is susceptible. The mutants were used following six generations of selfing and after confirmed
field evaluation showing absence of any deleterious effect of mutations. The field trials of these
mutants revealed no agronomical differences from IR64 [23] whereas analysis using IR64 specific
molecular markers suggested that the mutants are essentially near-isogenic (unpublished data). The
experimental plants were maintained under greenhouse conditions at 28 ± 2 °C with a photoperiod of
16 h day/8 h night cycle.
4.2. Plant Phenotype to BPH Infestation
Phenotypic response of IR64 to BPH infestation was determined using a modified seedbox
screening technique under greenhouse conditions [13]. This technique provides free choice to BPH
nymphs to colonize the plants in the seedbox. Briefly, pre-germinated seeds were sown in seedboxes
(45 cm × 35 cm ×15 cm) containing heat-sterilized soil in six equally spaced rows (two rows for each
entry) and 15 seedlings per row. Each row (mutant or wild type) was randomized within a seedbox and
replicated in three independent seedboxes. Ten-day-old seedlings were uniformly infested with
3–4 second-instar BPH nymphs per plant and allowed to settle on plants of their choice. Hopperburn
symptoms were observed 34 days after infestation (DAI).
Int. J. Mol. Sci. 2013, 14
3939
4.3. Proteomics Response after BPH Infestation
Since phenotypic response of IR64 differed with two mutants, a no-choice setup was planned to
allow equal number of BPH stress to feed on these genotypes. Fifteen seeds of mutants or wild type
plants were sown in individual nine inch circular pots using three technical and three biological
replicates. The seedlings were maintained in the greenhouse and before infestation with three nymphs
per plant 10 days after sowing, pots were randomized between entries and covered with mylar cage
and infested. Control plants were not infested but were covered with mylar cage and arranged
randomly. For protein extraction, the plants from three experimental and biological replicates were
sampled at four time points after infestation. For the first sample (T1), plant tissue was harvested
2 DAI when the infested nymphs were still in 3rd-4th instar stage; the second sampling (T2) was done
at 13 DAI when the majority of nymphs were at the adult stage; the third sampling (T3) was performed
28 DAI following the emergence of second generation nymphs; the fourth sampling (T4) was done
when the susceptible mutant (D1131) started wilting (34 DAI). For protein analysis, a 10 cm sample
above ground portion of leaf sheath was harvested and stored immediately in liquid nitrogen. For
control, plants were harvested at same time points using non-infested plants.
4.4. Protein Analysis
Protein extraction. Total leaf sheath proteins were extracted in a precipitation solution
(10% Trichloroacetic acid, 89.93% Acetone, 0.07% Dithiothreitol) using a modified method of
Damerval et al. [54]. The protein concentration was determined using a Protein-Assay-Kit (Bio-Rad)
following the manufacturer’s instructions.
Protein separation and image analysis of 2D Gels. Gel electrophoresis was performed using
non-linear (NL) 18-cm IPG strips with pH 4–7 and 3–10 (Amersham Pharmacia Biotech, Uppsala,
Sweden).The IPG strips were rehydrated overnight in 350 µL of rehydration buffer and 100 µg of
sample protein. The isoelectric focusing (IEF) of proteins was performed on a Multiphor II
Electrophoresis unit (Amersham Biosciences) at 20 °C with constant 200 V for the first hour, 500 V
for next 2 h and finally 16 h at 2950 V. Proteins from DTT/IAA equilibrated IEF strips were separated
on 15% sodium dodecyl sulfate (SDS) polyacrylamide gels using a Protean-II Multi cell (Bio Rad:
Hercules, CA, USA) at 4 °C.
The gels were stained with silver nitrate (Sigma Aldrich) for scanning or spot quantification
analysis whereas coomassie blue stain (Sigma Aldrich) was used for protein identification with mass
spectrometry using standard staining protocols. The gels were scanned with a GS-800 Calibrated
Densitometer (Bio-Rad) at a resolution of 600. For spot detection, protein quantification and spot
analysis, Melanie-3 image analysis software (GeneBio, Geneva, Switzerland) was used. Spot detection
parameters were as follows: number of smooths, 5; Laplacian threshold, 5; partial threshold, 1;
saturation, 90; peakness increase, 100; minimum perimeter, 10. The Melanie software automatically
normalized the spot intensity (the relative volume) i.e., the volume divided by the total volume over
the whole image (Melanie 3 user manual). The percent spot volume detected by software was used to
match spots for intensity differences and predict BPH induced proteins.. The protein spots were
categorized as BPH altered (increased or decreased in abundance) if protein abundance in a rice line
Int. J. Mol. Sci. 2013, 14
3940
increased or decreased with BPH infestation compared to mean control value. Abundance ratio
(protein volume in infested plants/control plants) was compared with control at a time point to
determine fold change in proteins. An arbitrary cutoff was used to express highly altered proteins [>1.5
(increased), <0.5 (decreased) or >0.5 and <1.5 (least altered)].
4.5. Protein Identification
The proteins spots from Coomassie Brilliant Blue (G-250) stained gels were manually excised using
a sterilized scalpel and submitted to the Australian Proteome Analysis Facility (APAF) Macquarie
University, Sydney, Australia [55] for characterization. Protein samples were analyzed with matrix
assisted laser desorption ionization time of flight (MALDI-TOF) mass spectrometry using a
Micromass Tofspec time-of-flight mass spectrometer (Micromass, Manchester, UK) at APAF
following standard procedures. If proteins could not be identified with MALDI-TOF, a further analysis
was performed on Q-TOF LCMS. For protein identification, peak lists were used and peptide masses
were searched against SWISS-PROT and NCBInr databases using the Mascot search engine [56]
supported by Matrix Science Ltd., London. In MS/MS Ion Search, following parameters were used for
database queries on monoisotopic peptide masses using the Viridiplantae and Oryza sativa as
taxonomic categories; peptide mass tolerance of 150 ppm; fragment mass tolerance: ±0.6 Da; variable
modifications: Oxidation (M), Propionamide (C); and the maximum number of missed tryptic cleavages,
1. Peptide masses that yielded a significant ion score (p < 0.05) were considered positively identified.
4.6. Statistical Analysis
Data analysis was performed with Statistical Analysis Software (SAS) (Version 9.1) and JMP-IN
(Version 5.1) (SAS Institute, Cary, NC, USA) using protein abundance values in control and BPH
infested plants of three genotypes (wild type IR64 and two mutants) and compared at each respective
time point. Protein abundance ratio in relation to each control group (IR64 or mutants) was calculated
by dividing the spot abundance in the BPH infested plants by the mean spot abundance of the control
plants and expressed as fold change with statistical significance at p-value lower than 0.05. A 2-way
ANOVA was used to compare the protein abundance between IR64 and the mutants and the means
were separated with the Tukey’s HSD multiple means comparison test (p < 0.05). Ordination statistics
were performed on protein abundance and genotypes to measure interactions between the BPH and
rice proteins (Canoco V.4.5) [57]. Initially, detrended correspondence analysis (DCA) was performed
to measure eigenvector length of expressed proteins variables (control, infested) [26]. Redundancy
analyses (RDA) were performed and the significance of the first two axes, as well all four axes, were
tested using a Monte Carlo test with 1000 permutations in reduced space. The reason RDA was chosen
in this particular instance rather than another multivariate method, is that the variable data showed
linear responses as opposed to unimodal responses. Multivariate biplots allow one to explore trends
through numerical data analysis above and beyond simple hypothesis testing. Where relationships and
covariation between variables is not evident with simple univariate statistics, multivariate methods
clearly show the abundance of specific proteins as variables in relation to experimental factors. In this
case it is clear that specific proteins covary with specific treatments, and the treatments themselves
also show covariation.
Int. J. Mol. Sci. 2013, 14
3941
5. Conclusions
BPH infestation on rice cv. IR64 altered the induction of several proteins involved in various
functional categories. A differential induction in proteins was evident both in resistant and susceptible
mutant of IR64. Overall, D518 essentially resists against BPH attack via increased activity of proteins
related to metabolism (Glyoxalase I, Probable ATP synthase 24 kDa subunit, Enolase), stress response
(S-like RNAse, GSH-dependent dehydro ascorbate reductase, Salt stress root protein “RS1”) and
protein synthesis (Chloroplast translation elongation factor Tu1) (Table 3). Altered abundance of
proteins, in particular lower levels of stress related proteins might have role in susceptibility of D1131
(Table 3). Moreover, the resistant plant also appears to compensate through a timely induction of some
of these proteins thus providing a leading edge over the susceptible plants. Differential response of the
mutants to BPH feeding thus leads to altered hopperburn symptoms on the rice plants (Figure 7). The
complex plant response to BPH also insists on refocusing the research for rice defense towards other
metabolic pathways like photosynthesis and their possible interaction to understand rice resistance
mechanisms to BPH infestation and to develop resistance breeding program. Further experiments to
explore a defined biological interaction between differentially induced proteins with other housekeeping
proteins may explain how resistant mutant would overcome BPH stress than susceptible mutant D1131
or moderately susceptible IR64.
Figure 7. A summarized figure of brown planthopper (N. lugens) induced IR64 proteins.
Abundance of various proteins associated with rice resistance is altered following BPH
infestation. The resistant lines such as D518 may induce specific genes earlier and more
intensely than susceptible lines that interact with other proteins thus leading to their
enhanced level of resistance against BPH.
Int. J. Mol. Sci. 2013, 14
3942
Acknowledgments
The authors would like to thank Swiss Agency for Development and Cooperation (SDC) for Ph.D.
support to JSS. We are also grateful to Reyeul Quintana, Rodante Abas, and Alberto Naredo,
Carmencita Bernal, and Angelita Romena for their help with the insect colony maintenance and with
the greenhouse screening of rice mutants.
References
1.
2.
3.
4.
5.
6.
7.
8.
9.
10.
11.
12.
13.
14.
Walling, L.L. The myriad plant responses to herbivores. J. Plant Growth Regul. 2000, 19, 195–216.
Wu, J.; Baldwin, I.T. Herbivory-induced signalling in plants: Perception and action. Plant Cell
Environ. 2009, 32, 1161–1174.
Sarmento, R.A.; Lemos, F.; Dias, C.R.; Kikuchi, W.T.; Rodrigues, J.C.P.; Pallini, A.;
Sabelis, M.W.; Janssen, A. A herbivorous mite down-regulates plant defence and produces web to
exclude competitors. PLoS One 2011, 6, doi:10.1371/journal.pone.0023757.
Rakwal, R.; Komatsu, S. Role of jasmonate in the rice (Oryza sativa L.) self defense mechanism
using proteome analysis. Electrophoresis 2000, 21, 2492–2500.
Wu, J.; Baldwin, I.T. New insights into plant responses to the attack from insect herbivores.
Ann. Rev. Genet. 2010, 44, 1–24.
Brar, D.S.; Khush, G.S. Utilization of Wild Species of Genus Oryza in Rice Improvement. In
Monograph on Genus Oryza. Plymouth; Nanda, J.S., Sharma, S.D., Eds.; Science Publishers:
Enfield, UK, 2003; pp. 283–309.
Zhang, F.; Zhu, L.; He, G. Differential gene expression in response to brown planthopper feeding
in rice. J. Plant Physiol. 2004, 161, 53–62.
Wang, X.-L.; He, R.F.; He, G.C. Construction of suppression subtractive hybridization libraries
and identification of brown planthopper-induced genes. J. Plant Physiol. 2005, 162, 1254–1262.
Wei, Z.; Hu, W.; Lin, Q.; Cheng, X.; Tong, M.; Zhu, L.; Chen, R,; He, G. Understanding rice
plant resistance to the Brown Planthopper (Nilaparvata lugens): A proteomic approach.
Proteomics 2009, 9, 2798–2808.
Park, D.S.; Lee, S.K.; Lee, J.H.; Song, M.Y.; Song, S.Y.; Kwak, D.Y.; Yeo, U.S.; Jeon, N.S.;
Park, S.K.; Yi, G.; et al. The identification of candidate rice genes that confer resistance to
the brown planthopper (Nilaparvata lugens) through representational difference analysis.
Theor. Appl. Genet. 2007, 115, 537–547.
Liu, C.; Hao, F.; Hu, J.; Zhang, W.; Wan, L.; Zhu, L.; Tang, H.; He, G. Revealing different
systems responses to brown planthopper infestation for pest susceptible and resistant rice plants
with the combined metabonomic and gene-expression analysis. J. Proteome Res. 2010, 9, 6774–6785.
Zhang, Q. Strategies for developing green super rice. Proc. Natl. Acad. Sci. USA 2007, 104,
16402–16409.
Alam, S.N.; Cohen, M.B. Detection and analysis of QTLs for resistance to the brown planthopper,
Nilaparvata lugens in a double-haploid rice production. Theor. Appl. Genet. 1998, 97, 1370–1379.
Yuan, H.; Chen, X.; Zhu, L.; He, G. Identification of genes responsive to brown planthopper
Nilaparvata lugens Stål (Homoptera: Delphacidae) feeding in rice. Planta 2005, 221, 105–112.
Int. J. Mol. Sci. 2013, 14
3943
15. Wang, Y.Y.; Wang, X.L.; Yuan, H.; Chen, R.; Zhu, L.; He, R.; He, G. Responses of two
contrasting genotypes of rice to brown planthopper. Mol. Plant Microbe Interact. 2008, 21, 122–132.
16. Hao, P.; Liu, C.; Wang, Y.; Chen, R.; Tang, M.; Du, B.; Zhu, L.; He, G. Herbivore-induced
callose deposition on the sieve plates of rice: an important mechanism for host resistance.
Plant Physiol. 2008, 146, 1810–1820.
17. Agrawal, G.K.; Rakwal, R. Rice proteomics: A move toward expanded proteome coverage to
comparative and functional proteomics uncovers the mysteries of rice and plant biology.
Proteomics 2011, 11, 1630–1649.
18. Kim, S.T.; Kim, S.G.; Kang, Y.H.; Wang, Y.; Kim, J.Y.; Yi, N.; Kim, J.K.; Rakwal, R.;
Koh, H.J.; Kang, K.Y. Proteomics analysis of rice lesion mimic mutant (spl1) reveals tightly
localized probenazole-induced protein (PBZ1) in cells undergoing programmed cell death.
J. Proteome Res. 2008, 7, 1750–1760.
19. Tsunezuka, H.; Fujiwara, M.; Kawasaki, T.; Shimamoto, K. Proteome analysis of programmed cell
death and defense signaling using the rice lesion mimic mutant cdr2. Mol. Plant Microbe Interact.
2005, 18, 52–59.
20. Jung, Y.H.; Rakwal, R.; Agrawal, G.K.; Shibato, J.; Kim, J.A.; Lee, M.O.; Choi, P.K.; Jung, S.H.;
Kim, S.H.; Koh, H.J.; et al. Differential expression of defense/stress-related marker proteins in
leaves of a unique rice blast lesion mimic mutant (blm). J. Proteome Res. 2006, 5, 2586–2598.
21. Kang, S.G.; Matin, M.N.; Bae, H.; Natarajan, S. Proteome analysis and characterization of
phenotypes of lesion mimic mutant spotted leaf 6 in rice. Proteomics 2007, 7, 2447–2458.
22. Lee, J.; Bricker, T.M.; Lefevre, M.; Pinson, S.R.; Oard, J.H. Proteomic and genetic approaches to
identifying defence-related proteins in rice challenged with the fungal pathogen Rhizoctonia solani.
Mol. Plant Pathol. 2006, 7, 405–416.
23. Sangha, J.S.; Chen, Y.H.; Palchamy, K.; Jahn, G.C.; Maheswaran, M.; Adalla, C.B.; Leung, H.
Categories and inheritance of resistance to Nilaparvata lugens (Hemiptera: Delphacidae) in
mutants of indica rice ‘IR64’. J. Econ. Entomol. 2008, 101, 575–583.
24. Schiltz, S.; Gallardo, K.; Huart, M.; Negroni, L.; Sommerer, N.; Burstin, J. Proteome reference
maps of vegetative tissues in pea. An investigation of nitrogen mobilization from leaves during
seed filling. Plant Physiol. 2004, 135, 2241–2260.
25. Salekdeh, H.G.; Siopongco, J.; Wade, L.J.; Ghareyazie, B.; Bennett, J. Proteomic analysis of rice
leaves during drought stress and recovery. Proteomics 2002, 2, 1131–1145.
26. Kraepiel, Y.; Pédron, J.; Patrit, O.; Simond-Côte, E.; Hermand, V.; van Gijsegem, F. Analysis of
the Plant bos1 Mutant Highlights Necrosis as an Efficient Defence Mechanism during D.
dadantii/Arabidospis thaliana Interaction. PLoS One 2011, 6, doi:10.1371/journal.pone.0018991.
27. Watanabe, T.; Kitagawa, H. Photosynthesis and translocation of assimilates in rice plants
following phloem feeding by the planthopper Nilaparvata lugens (Homoptera: Delphacidae).
J. Econ. Entomol. 2000, 93, 1192–1198.
28. Zhu-Salzman, K.; Salzman, R.A.; Ahn, J.-E.; Koiwa, H. Transcriptional regulation of sorghum
defense determinants against a phloem-feeding aphid. Plant Physiol. 2004, 134, 420–431.
29. Scheideler, M.; Schlaich, N.L.; Fellenberg, K.; Beissbarth, T.; Hauser, N.C.; Vingron, M.;
Slusarenko, A.J.; Hoheisel, J.D. Monitoring the switch from housekeeping to pathogen defense
metabolism in Arabidopsis thaliana using cDNA arrays. J. Biol. Chem. 2002, 277, 10555–10561.
Int. J. Mol. Sci. 2013, 14
3944
30. Bilgin, D.D.; Zavala, J.A.; Zhu, J.; Clough, S.J.; Ort, D.R.; DeLucia, E.H. Biotic stress globally
downregulates photosynthesis genes. Plant Cell Environ. 2010, 33, 1597–1613.
31. Nakano, R.; Ishida, H.; Makino, A.; Mae, T. In vivo fragmentation of the large subunit of
ribulose-1,5-bisphosphate carboxylase by reactive oxygen species in an intact leaf of cucumber
under chilling-light conditions. Plant Cell Physiol. 2006, 47, 270–276.
32. Navarre, D.; Wolpert, T.J. Victorin induction of an apoptotic/senescence-like response in oats.
Plant Cell 1999, 11, 237–250
33. Matile, P. Chloroplast Senescence. In Crop Photosynthesis: Spatial and Temporal Determinant;
Baker, N.R., Thomas, H., Eds.; Elsevier: Amsterdam, The Netherlands, 1992; pp. 413–440.
34. Evans, J.R.; Seeman, J.R. The Allocation of Protein Nitrogen in the Photosynthetic Apparatus:
Cost, Consequence and Control. In Photosynthesis; Briggs, W.R., Ed.; Alan R. Liss Inc.:
New York, NY, USA, 1989; pp. 183–205.
35. Asada, K. Ascorbate peroxidase: A hydrogen peroxidase scavenging system in plants.
Physiol. Plant 1992, 85, 235–241.
36. Kocsy, G.; von Ballmoos, P.; Ruegsegger, A.; Szalai, G.; Galiba, G.; Brunold, C. Increasing the
glutathione content in a chilling-sensitive maize genotype using safeners increased protection
against chilling-induced injury. Plant Physiol. 2001, 127, 1147–1156.
37. Zhu-Salzman, K.; Luthe, D.S.; Felton, G.W. Arthropod-inducible proteins: Broad spectrum
defenses against multiple herbivores. Plant Physiol. 2008, 146, 852–858.
38. Barbehenn, R.; Dukatz, C.; Holt, C.; Reese, A.; Martiskainen, O.; Salminen, J.P.; Yip, L.; Tran, L.;
Constabel, C.P. Feeding on poplar leaves by caterpillars potentiates foliar peroxidase action in
their guts and increases plant resistance. Oecologia 2010, 164, 993–1004.
39. Kerchev, P.I.; Fenton, B.; Foyer, C.H.; Hancock, R.D. Plant responses to insect herbivory:
Interactions between photosynthesis, reactive oxygen species and hormonal signalling pathways.
Plant Cell Environ. 2012, 35, 441–453.
40. Yoshimura, K.; Yabuta, Y.; Ishikawa, T.; Shigeoka, S. Expression of spinach ascorbate
peroxidase isoenzymes in response to oxidative stresses. Plant Physiol. 2000, 123, 223–234.
41. Kim, J.K.; Bamba, T.; Harada, K.; Fukusaki, E.; Kobayashi, A. Time-course metabolic profiling
in Arabidopsis thaliana cell cultures after salt stress treatment. J. Exp. Bot. 2007, 58, 415–424.
42. Shulaev, V.; Cortes, D.; Miller, G.; Mittler, R. Metabolomics for plant stress response.
Physiol. Plant. 2008, 132, 199–208.
43. Baxter, C.J.; Redestig, H.; Schauer, N.; Repsilber, D.; Patil, K.R.; Nielsen, J.; Selbig, J.; Liu, J.;
Fernie, A.R.; Sweetlove, L.J. The metabolic response of heterotrophic arabidopsis cells to
oxidative stress. Plant Physiol. 2007, 143, 312–325.
44. Cabrera, H.M.; Argandona, V.H.; Corcuera, L.J. Metabolic changes in barley seedlings at
different aphid infestation levels. Phytochemistry 1994, 35, 317–319.
45. Divol, F.; Vilaine, F.; Thibivilliers, S.; Amselem, J.; Palauqui, J.C.; Kusiak, C.; Dinant, S.
Systemic response to aphid infestation by Myzus persicae in the phloem of Apium graveolens.
Plant Mol. Biol. 2005, 57, 517–540.
46. Veena-Reddy, V.S.; Sopory, S.K. Glyoxalase I from Brassica juncea: Molecular cloning,
regulation and its over-expression confer tolerance in transgenic tobacco under stress. Plant J.
1999, 17, 385–395.
Int. J. Mol. Sci. 2013, 14
3945
47. Caldas, T.D.; El Yaagoubi, A.; Richarme, G. Chaperone properties of bacterial elongation factor
EF-Tu. J. Biol. Chem. 1998, 273, 11478–11482.
48. Bhadula, S.K.; Elthon, T.E.; Habben, J.E.; Helentjaris, T.G.; Jiao, S.; Ristic, Z. Heat stress
induced synthesis of chloroplast protein synthesis elongation factor (EF-Tu) in a heat-tolerant
maize line. Planta 2001, 212, 359–366.
49. Bariola, P.A.; Howard, C.J.; Taylor, C.B.; Verburg, M.T.; Jaglan, V.D.; Green, P.J. The
Arabidopsis ribonuclease gene RNS1 is tightly controlled in response to phosphate limitation.
Plant J. 1994, 6, 673–685.
50. Galiana, E.; Bonnet, P.; Conrod, S.; Keller, H.; Panabières, F.; Ponchet, M.; Poupet, A.; Ricci, P.
RNase activity prevents the growth of a fungal pathogen in tobacco leaves and increases upon
induction of systemic acquired resistance with elicitin. Plant Physiol. 1997, 115, 1557–1567.
51. Lers, A.; Sonego, L.; Green, P.J.; Burd, S. Suppression of LX ribonuclease in tomato results in a
delay of leaf senescence and abscission. Plant Physiol. 2006, 142, 710–721.
52. Okabe, T.; Yoshimoto, I.; Hitoshi, M.; Ogawa, T.; Ohyama, T. An S-like ribonuclease gene is
used to generate a trap-leaf enzyme in the carnivorous plant Drosera adelae. FEBS Lett. 2005,
579, 5729–5733.
53. Hugot, K.; Ponchet, M.; Marais, A.; Ricci, P.; Galiana, E. A tobacco S-like RNase inhibits hyphal
elongation of plant pathogens. Mol. Plant-Microbe Interact. 2002, 15, 243–250.
54. Damerval, C.; de Vienne, D.; Zivy, M.; Thiellement, H. Technical improvements in
two-dimensional electrophoresis increase the level of genetic variation detected in wheat-seedling
proteins. Electrophoresis 1986, 7, 52–54.
55. Australian Proteome Analysis Facility. Available online: />Mass-Spectrometry/default.aspx (accessed on 4 February 2013).
56. Mascot Search Engine. Available online: (accesses on 4 February
2013).
57. Ter Braak, C.J.F.; Smilauer, P. CANOCO Reference Manual and CanoDraw for Windows User’s
Guide: Software for Canonical Community Ordination (version 4.5); Microcomputer Power:
Ithaca, NY, USA, 2002; p. 500.
© 2013 by the authors; licensee MDPI, Basel, Switzerland. This article is an open access article
distributed under the terms and conditions of the Creative Commons Attribution license
( />
![Chemical and functional components in different parts of rough rice (oryza sativa l[1] ) beforeandaftergermination](https://media.store123doc.com/images/document/14/rc/qa/medium_qab1394872940.jpg)