Prognostic model based on the geriatric nutritional risk index and sarcopenia in patients with diffuse large B-cell lymphoma
Bạn đang xem bản rút gọn của tài liệu. Xem và tải ngay bản đầy đủ của tài liệu tại đây (1.12 MB, 10 trang )
Go et al. BMC Cancer
(2020) 20:439
/>
RESEARCH ARTICLE
Open Access
Prognostic model based on the geriatric
nutritional risk index and sarcopenia in
patients with diffuse large B-cell lymphoma
Se-Il Go1,2, Hoon-Gu Kim1,2, Myoung Hee Kang1,2, Sungwoo Park3 and Gyeong-Won Lee2,3*
Abstract
Background: Systemic inflammation and cachexia are associated with adverse clinical outcomes in diffuse large Bcell lymphoma (DLBCL). The Geriatric Nutritional Risk Index (GNRI) is one of the main parameters used to assess
these conditions, but its efficacy in DLBCL is inconclusive.
Methods: We retrospectively reviewed 228 DLBCL patients who were treated with R-CHOP immunochemotherapy
(rituximab plus cyclophosphamide, doxorubicin, vincristine, and prednisone). The patients were stratified according
to GNRI score (> 98, 92 to 98, 82 to < 92, and < 82) as defined in previous studies. Additionally, the extent of
sarcopenia was categorized as sarcopenia-both, sarcopenia-L3/PM alone, and non-sarcopenia-both according to
skeletal muscle index.
Results: Survival curves plotted against a combination of GNRI and sarcopenia scores revealed two clear groups as
follows: high cachexia risk (HCR) group (GNRI < 82, sarcopenia-both, or GNRI 82–92 with sarcopenia-L3/PM alone)
and low cachexia risk (LCR) group (others). The HCR group had a lower complete response rate (46.5% vs. 86.6%)
and higher frequency of treatment-related mortality (19.7% vs. 3.8%) and early treatment discontinuation (43.7% vs.
8.3%) compared with the LCR group. The median progression-free survival (PFS) (not reached vs. 10.3 months,
p < 0.001) and overall survival (OS) (not reached vs. 12.9 months, p < 0.001) were much shorter in the HCR group
than in the LCR group. On multivariable analyses, the HCR group was shown to be an independent negative
prognostic factor for PFS and OS after adjusting the National Comprehensive Cancer Network-International
Prognostic Index (NCCN-IPI).
Conclusions: A combined model of GNRI and sarcopenia may provide prognostic information independently of
the NCCN-IPI in DLBCL.
Keywords: Lymphoma, large B-cell, diffuse, Serum albumin, Body weight, Cachexia, Sarcopenia
* Correspondence: ;
2
Institute of Health Science, Gyeongsang National University College of
Medicine, Jinju, Republic of Korea
3
Division of Hematology-Oncology, Department of Internal Medicine,
Gyeongsang National University Hospital, Gyeongsang National University
College of Medicine, Gangnam-ro 79, Jinju 52727, Republic of Korea
Full list of author information is available at the end of the article
© The Author(s). 2020 Open Access This article is licensed under a Creative Commons Attribution 4.0 International License,
which permits use, sharing, adaptation, distribution and reproduction in any medium or format, as long as you give
appropriate credit to the original author(s) and the source, provide a link to the Creative Commons licence, and indicate if
changes were made. The images or other third party material in this article are included in the article's Creative Commons
licence, unless indicated otherwise in a credit line to the material. If material is not included in the article's Creative Commons
licence and your intended use is not permitted by statutory regulation or exceeds the permitted use, you will need to obtain
permission directly from the copyright holder. To view a copy of this licence, visit />The Creative Commons Public Domain Dedication waiver ( applies to the
data made available in this article, unless otherwise stated in a credit line to the data.
Go et al. BMC Cancer
(2020) 20:439
Background
Diffuse large B-cell lymphoma (DLBCL) is the most
common subtype of adult non-Hodgkin lymphoma. Despite its aggressive nature, DLBCL is a potentially curable
disease when treated with immunochemotherapy consisting of rituximab plus cyclophosphamide, doxorubicin, vincristine, and prednisone (R-CHOP) [1–3]. The
International Prognostic Index (IPI) and its variations
are well-known prognostic markers for DLBCL [4–6];
however, these indices remain limited in their ability to
predict disease prognosis in disease such as this, where
survival remains < 50%. Inability to predict clinical outcomes may be due, in part, to the heterogeneous nature
of the disease, consisting of several molecular subtypes
including germinal center B-cell-like (GCB) and activated B-cell-like (ABC) types [7]. Recently, five robust
DLBCL subsets were detected using whole-exome sequencing. These subsets were shown to be a better predictor of disease prognosis relative to IPI scores [8].
Furthermore, comprehensive geriatric assessment could
identify non-fit patients in whom curative intent treatment did not improve the prognosis [9]. Development of
such novel prognosticators for disease outcomes remains
a significant unmet need, allowing doctors to individualize
treatment strategies for DLBCL patients.
Cancer cachexia is a multifactorial syndrome characterized by ongoing loss of skeletal muscle mass, malnutrition, and progressive functional impairment [10].
Cancer cachexia is associated with increased treatmentrelated toxicity and poor prognosis in cancer patients
[11–13]. Given the high tumor burden of DLBCL and
the favorable response rate with substantial treatmentrelated toxicities of R-CHOP treatment, the prognostic
role of cancer cachexia is also likely to be observed in
DLBCL patients. Several markers for malnutrition and
cachexia such as body mass index (BMI), sarcopenia,
adipopenia, and serum albumin level have been studied and
suggested to be prognostic factors in DLBCL [14–17]. Additionally, the clinical value of the Geriatric Nutritional Risk
Index (GNRI), which was originally developed to predict
nutrition-related morbidity and mortality in non-cancer patients [18], was evaluated in two previous DLBCL studies
with conflicting results [19, 20]. In this study, we reevaluated the clinical impact of the GNRI on patient outcomes, both alone and in combination with sarcopenia.
Methods
Patients
All DLBCL patients (n = 262) treated with R-CHOP as
first-line treatment between 2004 and 2017 at a single
institution were retrospectively evaluated. The study was
approved by the Institutional Review Board of Gyeongsang National University Hospital. Eligible patients were
aged 18 years or older, had baseline CT scans for chest
Page 2 of 10
and abdomen, and had the records for height, body
weight, and serum albumin level measured within a
week before the beginning of R-CHOP (n = 246). Exclusion criteria were patients who had active infections
(n = 7), double primary malignancy (n = 4), histologic
transformation from low-grade lymphoma (n = 3), and
lack of information for the National Comprehensive
Cancer
Network-International
Prognostic
Index
(NCCN-IPI) at the time of measurement of GNRI and
sarcopenia (n = 4). Finally, 228 patients were included in
the analysis.
Definitions of clinical variables
Pretreatment demographics and clinical variables were
collected via electronic medical records. Body mass
index (BMI) of less than 23.0 kg/m2 was classified to be
underweight according to the Asian standard [21]. The
response to R-CHOP along with any treatment-related
toxicities were assessed using the revised International
Working Group response criteria and the National Cancer Institute Common Toxicity Criteria (version 4.0).
Relative dose intensity (RDI) was defined as the percentage of the actual total dose of each drug relative to the
planned dose of the drug. Early treatment discontinuation was defined as any treatment prematurely terminated for reasons not due to disease progression.
Treatment-related mortality was defined as any death
not due to disease progression occurring within a month
of the R-CHOP treatment or as death, at any time, that
was apparently related to the R-CHOP treatment.
To determine the extent of sarcopenia, we measured
muscle mass by CT histogram analysis, as described previously [16, 22]. Briefly, the muscle masses of the third
lumbar level and of the pectoralis major and minor were
measured and converted to L3 skeletal muscle index
(L3-SMI) and pectoralis muscle SMI (PM-SMI), respectively, by dividing muscle mass by height in meters
squared (cm2/m2). The patients were considered to be
sarcopenic if their SMIs were lower than their respective
cut-off values (L3-SMI, 52.4 cm2/m2 in males and 38.5
cm2/m2 in females; PM-SMI, 4.4 cm2/m2 in males and
3.1 cm2/m2 in females) [16, 22]. The extent of sarcopenia
was defined as follows: non-sarcopenia-both, neither L3nor PM-SMI at sarcopenic level; sarcopenia-L3/PM
alone, only one of SMIs at sarcopenic level; and
sarcopenia-both, both L3- and PM-SMIs at sarcopenic
level [23]. GNRI was estimated using the following formula: 1.489 × serum albumin level (g/L) + 41.7 × [actual
body weight (ABW)/ideal body weight (IBW) (kg)]. If
the ABW was higher than the IBW, the ABW/IBW ratio
was set to 1. According to previous criteria, GNRI scores
> 98, 92 to 98, 82 to < 92 and < 82 were classified as no,
low, moderate, and major risk, respectively [18].
Go et al. BMC Cancer
(2020) 20:439
Statistical analysis
All analyses were performed with STATA, version 16.0
(College Station, TX, USA). Mann-Whitney U test and
Chi-square or Fisher’s exact test were used to compare
continuous and categorical variables between two
groups, respectively. Progression-free survival (PFS) was
calculated as the time from the date of R-CHOP treatment initiation to the date of progression, death, or last
follow-up. Overall survival (OS) was calculated as the
time from the date of R-CHOP treatment initiation to
the date of death or last follow-up. Survival was plotted
using the Kaplan-Meier method and compared by the
log-rank test. Cox regression analysis was performed to
assess the influence of clinical variables on PFS and OS.
Demographics, NCCN-IPI, and other conventional prognostic factors such as B-symptoms [24], bulky disease
[25], and BMI [26] were included on univariate analyses.
Each factor of NCCN-IPI such as age, lactate dehydrogenase (LDH) level, Ann Arbor stage, extranodal disease,
and Eastern Cooperative Oncology Group performance
status (ECOG PS) was not separately analyzed to avoid
multicollinearity problem. Then, all statistically
Page 3 of 10
significant variables with p-value < 0.05 on univariate
analysis were included without variable selection technique in the multivariate Cox regression model. To
compare the predictive performance of the models for
OS, C-index, Akaike information criterion (AIC), and
Bayesian information criterion (BIC) were calculated. A
two-sided p-value < 0.05 was considered statistically
significant.
Results
Patient characteristics
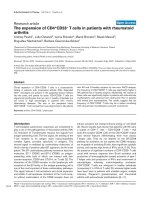
According to the GNRI score, 94, 49, 55, and, 30 patients were classified as no, low, moderate, and major
risk groups, respectively. In terms of sarcopenia, 128, 78,
and 22 patients were indicated as non-sarcopenia-both,
sarcopenia-L3/PM alone, and sarcopenia-both groups,
respectively. The mean (± SD) GNRIs were 97.4 (± 8.5),
91.5 (± 10.2), and 83.3 (± 10.0) in non-sarcopenia-both,
sarcopenia-L3/PM alone, and sarcopenia-both groups,
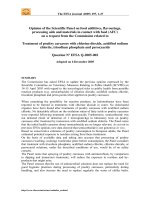
respectively (p < 0.001). PFS and OS were superior in
patients with lower GNRI (Fig. 1a, b) as well as in more
sarcopenic patients (Fig. 1c, d). When the survival curves
Fig. 1 a Progression-free survival (PFS) and (b) overall survival (OS) according to the GNRI. c PFS and (D) OS according to the severity of
sarcopenia. Abbreviations: GNRI Geriatric Nutritional Risk Index
Go et al. BMC Cancer
(2020) 20:439
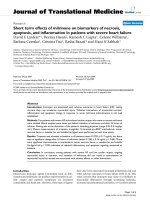
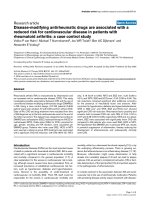
were plotted against the combination of GNRI score
and sarcopenic status (Fig. 2a, b), two groups
emerged who exhibited significant differences in prognosis. These groups were defined as either the high
cachexia risk group (HCR; n = 71, major GNRI risk,
sarcopenia-both, or moderate GNRI risk with
sarcopenia-L3/PM alone) and low cachexia risk group
(LCR; n = 157, others).
The baseline characteristics according to the cachexia
risk are listed in Table 1. The median age was 64 years
(range, 21–88 years), with 132 patients (57.9%) > 60 years
old. The majority of patients had a good performance
status (ECOG PS 0–1, 71.9%). There were remarkable
differences in the baseline characteristics between two
groups. The HCR group was associated with adverse
clinical features including older age, poor PS, Bsymptoms, bulky disease, advanced stage, extranodal disease, elevated LDH level, and higher IPI and NCCN-IPI.
The GCB type was observed in 26 of 135 (19.3%) available patients without significant differences between
groups. The BMI was lower in the HCR group relative
Page 4 of 10
to the LCR group (median BMI, 21.7 vs. 23.9 kg/m2,
p < 0.001).
Treatment-related toxicity
Grade 3 or worse treatment-related toxicities were reported more frequently in the HCR group than in the
LCR group (Table 2). The rates of grade 3 or worse
anemia, febrile neutropenia, and thrombocytopenia were
31.0, 43.7, and 43.7% in the HCR group and 14.7, 26.1,
and 18.5% in the LCR groups. Grade 3 or worse nonhematologic toxicities were also more common in the
HCR group compared to the LCR group (49.3% vs.
30.6%). Of note, the incidence of treatment-related mortality (19.7% vs. 3.8%) and early treatment discontinuation (43.7% vs. 8.3%) was very high in the HCR group
compared with the LCR group.
Treatment response
In all patients, complete response (CR) was achieved in
33 of 71 patients (46.5%) with HCR and in 136 of 157
patients (86.6%) with LCR (p < 0.001, Table 3). CR rates
Fig. 2 a Progression-free survival (PFS) and (b) overall survival (OS) according to the GNRI and severity of sarcopenia. Blue and red circles indicate
the groups stratified into low and high cachexia risk, respectively. (c) PFS and (D) OS according to cachexia risk. Abbreviations: GNRI Geriatric
Nutritional Risk Index
Go et al. BMC Cancer
(2020) 20:439
Page 5 of 10
Table 1 Baseline characteristics
GNRI/sarcopenia risk
P
High cachexia risk (n = 71)
Low cachexia risk (n = 157)
70 (27–88)
59 (21–86)
< 0.001
≤ 60
13 (18.3)
83 (52.9)
< 0.001
> 60
58 (81.7)
74 (47.1)
Male
46 (64.8)
84 (53.5)
Female
25 (35.2)
73 (46.5)
Median age (range), years
Sex
0.111
ECOG PS
< 0.001
0–1
33 (46.5)
131 (83.4)
2–3
38 (53.5)
26 (16.6)
Absent
46 (64.8)
138 (87.9)
Present
25 (35.2)
19 (12.1)
B-symptoms
< 0.001
Bulky disease
0.009
Non-bulky
52 (73.2)
137 (87.3)
Bulky
19 (26.8)
20 (12.7)
I – II
17 (23.9)
83 (52.9)
III – IV
54 (76.1)
74 (47.1)
Ann Arbor stage
< 0.001
Extranodal disease
0.007
Absent
17 (23.9)
67 (42.7)
Present
54 (76.1)
90 (57.3)
Normal
19 (26.8)
73 (46.5)
Elevated
52 (73.2)
84 (53.5)
LDH
0.005
IPI
< 0.001
Low to Low-intermediate
19 (26.8)
107 (68.2)
High-intermediate to High
52 (73.2)
50 (31.9)
Low to Low-intermediate
11 (15.5)
95 (60.5)
High-intermediate to High
60 (84.5)
62 (39.5)
NCCN-IPI
< 0.001
Cell-of-origin (n = 135)
0.421
GCB
10 (23.3)
16 (17.4)
Non-GCB
33 (76.7)
76 (82.6)
21.7 (15.6–29.8)
23.9 (15.1–33.7)
2
Median BMI (range), kg/m
< 0.001
Data are presented as number of patients (%) except median age and BMI
Abbreviations: GNRI Geriatric Nutritional Risk Index, ECOG PS Eastern Cooperative Oncology Group performance status, LDH lactate dehydrogenase, IPI
International Prognostic Index, NCCN-IPI National Comprehensive Cancer Network-International Prognostic Index, GCB germinal center B-cell, BMI body mass index
of the LCR group were more than 90% regardless of the
RDI of chemotherapy if the treatment was completed as
scheduled. In contrast, CR rates of the HCR group were
remarkably decreased, as the RDI of chemotherapy was
decreased. When the treatment was prematurely discontinued, there were no statistical differences in CR rates
between two groups (10.7% vs. 25.0%, p = 0.341).
Survival
There were 104 PFS events and 97 deaths during the
study period. With a median follow-up duration of 71.1
months, median PFS and OS of the entire cohort were
87.2 and 89.4 months, respectively. Median PFS in the
HCR group was 10.3 months compared with not reached
in the LCR group (p < 0.001; Fig. 2c). The 5-year PFS
Go et al. BMC Cancer
(2020) 20:439
Page 6 of 10
Table 2 Treatment-related toxicity
GNRI/sarcopenia risk
P
High cachexia risk
(n = 71)
Low cachexia risk
(n = 157)
Anemia
22 (31.0)
23 (14.7)
0.004
Neutropenia
60 (84.5)
127 (80.9)
0.510
Febrile neutropenia
31 (43.7)
41 (26.1)
0.008
Thrombocytopenia
31 (43.7)
29 (18.5)
< 0.001
Any non-hematologic toxicity, grade ≥ 3
35 (49.3)
48 (30.6)
0.007
Treatment-related mortality
14 (19.7)
6 (3.8)
< 0.001
Early treatment discontinuation
28 (39.4)
12 (7.6)
< 0.001
Hematologic toxicity, grade ≥ 3
Abbreviations: GNRI Geriatric Nutritional Risk Index
rates were 23.5 and 68.7% in the HCR and LCR groups,
respectively. Median OS in the HCR group was 12.9
months and not reached in the LCR group (p < 0.001,
Fig. 2d). The 5-year OS rates were 24.4 and 71.6% in the
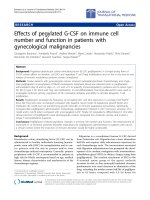
HCR and LCR groups, respectively. While there was no
significant difference in OS according to the GNRI in
the patients with low to low-intermediate NCCN-IPI,
the HCR group had worse OS than the LCR group irrespective of NCCN-IPI (Fig. 3).
On multivariate analyses, the HCR group was shown
to be an independent poor prognostic factor for PFS
[hazard ratio (HR) 2.773, 95% confidence interval (CI)
1.826–4.212, p < 0.001] and OS (HR 3.348, 95% CI
2.169–5.167, p < 0.001) after adjusting for other covariates including the NCCN-IPI (Table 4). The predictive
performance of the model for OS was best (higher Cindex and lower AIC and BIC) when the cachexia risk
was included in the model, instead of sarcopenia and
GNRI (Supplementary Table S1).
Discussion
Our study supports the prognostic role of the GNRI in
DLBCL patients. Lower GNRI was associated with worse
PFS and OS. Notably, patients who did not meet any of
the two criteria for sarcopenia had a favorable prognosis
regardless of GNRI score, with the exception of those with
major GNRI risk scores, while all patients who met both
criteria for sarcopenia had an unfavorable prognosis even
in cases of no GNRI risk. In contrast, for patients who
met only one of the criteria for sarcopenia, disease prognoses were determined based on GNRI score. Furthermore, the predictive performance was better in the Cox
model including the cachexia risk than in those including
either sarcopenia or GNRI. These findings suggest that
the combined use of GNRI and sarcopenia may improve
the predictability of each factor in DLBCL patients.
A previous Japanese study showed that the GNRI
score could identify patients with poorer prognosis
among those with high-intermediate to high NCCN-IPI
[19]. In contrast, a Chinese study found that while there
was a marginal difference in OS by univariate analysis,
GNRI score was not an independent prognostic factor
for OS in multivariate analysis [20]. Given the differences in patient populations and inclusion criteria it is
difficult to compare the results of our study directly with
those of previous studies; however, there were considerable differences in patient characteristics between studies. The patients in the Chinese study were younger
(mean age, 55 years) than those in both the Japanese
study and this investigation (median ages, 68 and 64
years, respectively). The proportions of patients with low
to low-intermediate NCCN-IPI were 80, 46, and 46.5%
Table 3 Complete response rate according to compliance for treatment
GNRI/sarcopenia risk
P
High cachexia risk
Low cachexia risk
CR in all patients
33/71 (46.5)
136/157 (86.6)
< 0.001
CR in patients who completed treatment without DA
17/22 (77.3)
79/87 (90.8)
0.132
CR in patients who completed treatment with DA ≥ 75%
11/16 (68.8)
39/42 (92.9)
0.030
CR in patients who completed treatment with DA < 75%b
2/5 (40.0)
15/16 (93.8)
0.028
CR in patients who early discontinued treatment
3/28 (10.7)
3/12 (25.0)
0.341
a
Relative dose intensity of cyclophosphamide and doxorubicin ≥75%
b
Relative dose intensity of cyclophosphamide and/or doxorubicin < 75%
Abbreviations: GNRI Geriatric Nutritional Risk Index, CR complete response, DA dose adjustment
a
Go et al. BMC Cancer
(2020) 20:439
Page 7 of 10
Fig. 3 Overall survival (OS) according to the GNRI in patients with (a) low to low-intermediate NCCN-IPI and (b) high-intermediate to high NCCNIPI. OS according to cachexia risk in patients with (c) low to low-intermediate NCCN-IPI and (d) high-intermediate to high NCCN-IPI. Abbreviations:
GNRI Geriatric Nutritional Risk Index, NCCN-IPI National Comprehensive Cancer Network-International Prognostic Index
in the Chinese, Japanese, and current studies, respectively. In subgroup analyses, the GNRI score could not
identify patients with a worse prognosis among those
with low to low-intermediate NCCN-IPI in any these
studies, whereas there was a significant association between GNRI score and OS among those with highintermediate to high NCCN-IPI in both the Japanese
and current studies. These findings may explain why the
prognostic value of GNRI was differently reported in the
literature [19, 20] and suggests that the GNRI alone can
be a prognostic factor only in DLBCL patients with
higher NCCN-IPI.
There is debate about which single parameter for cancer cachexia is most appropriate to predict the prognosis
of DLBCL patients. Large database cohort studies reported that patients with low to normal BMI had shorter
survival times relative to overweight or obese patients
[27, 28], while subset analysis from a phase III trial failed
to prove the prognostic role of BMI [29]. Sarcopenia, as
determined by CT imaging, has been proposed as an
Table 4 Cox regression for PFS and OS
PFS
OS
Univariate
HR
95% CI
Multivariate
P
HR
95% CI
Univariate
P
HR
95% CI
Multivariate
P
HR
95% CI
P
GNRI/sarcopenia risk
Low cachexia risk
Ref.
High cachexia risk
4.308 2.915–6.367 < 0.001 2.773 1.826–4.212 < 0.001 4.961 3.302–7.452
< 0.001 3.348 2.169–5.167 < 0.001
1.016 0.691–1.494 0.935
0.653
BMI (< 23 kg/m2 vs. ≥ 23 kg/m2)
Ref.
Ref.
1.096 0.735–1.632
Ref.
NCCN-IPI
Low to Low-intermediate
Ref.
High-intermediate to High
5.959 3.649–9.732 < 0.001 4.342 2.580–7.308 < 0.001 6.474 3.855–10.874 < 0.001 4.793 2.770–8.292 < 0.001
Ref.
Ref.
Ref.
Other clinical variables
Sex (male vs. female)
1.121 0.757–1.659 0.569
B-symptoms (present vs. absent)
2.574 1.694–3.913 < 0.001 1.305 0.839–2.031
Bulky disease (bulky vs. nonbulky)
0.874 0.513–1.490 0.621
1.109 0.739–1.664
0.237 2.372 1.533–3.671
0.810 0.459–1.428
0.619
< 0.001 1.173 0.742–1.856
0.494
0.466
Abbreviations: PFS progression-free survival, OS overall survival, HR hazard ratio, CI confidence interval, GNRI Geriatric Nutritional Risk Index, BMI body
mass index, NCCN-IPI National Comprehensive Cancer Network-International Prognostic Index
Go et al. BMC Cancer
(2020) 20:439
independent prognostic factor in several studies [16, 23,
30, 31]. However, other studies found that the prognostic value of sarcopenia was limited in elderly and male
patients [32, 33]. There are also contradictory reports regarding the prognostic role of hypoalbuminemia with
various cut-off points [14, 17, 34].
Essentially, multifactorial elements are intricately
linked to cancer cachexia. Muscle wasting and atrophy,
which are key features in cancer cachexia, are mediated
by tumor-derived factors such as proteolysis-inducing
factor involving nuclear factor-κB pathway [35, 36].
Tumor-driven inflammatory cytokines are responsible
for the development of cancer cachexia by inducing alterations in protein metabolism, as well as by activation
of apoptosis and inhibition of regeneration of muscle
mass [37]. White adipose tissue browning and lipolysis
promoted by tumor-derived cytokines and hormones
mediates adipose tissue and muscle wasting through molecular crosstalk between adipose and different tissues
[38]. Myostatin expression and activity are enhanced in
experimental cancer cachexia, with inhibition sufficient
to reduce muscle loss [39, 40]. Furthermore, an international consensus has suggested that the staging criteria
of cancer cachexia consist of various clinical factors, including weight loss, BMI, sarcopenia, systemic inflammation, anorexia, response to anticancer therapy, and
performance status [10]. Therefore, the cachexia risk of
our study, which reflects body weight, sarcopenia, and
systemic inflammation may be a better surrogate marker
for evaluating the severity of cancer cachexia compared
with other single parameters. Cachexia risk was a predictor of treatment response, treatment-related toxicity,
and survival in DLBCL. Given the intolerance to RCHOP treatment observed in patients with high cachexia risk, dose adjustment may be considered in this
group. However, chemotherapy dose adjustment resulted
in a remarkable decrease of CR rate in the patients with
high cachexia risk, whereas there was little effect in
those with low cachexia risk. This suggests that a novel
therapeutic strategy and intensive supportive care may
be warranted in patients with high cachexia risk.
Our study has several limitations. First, the retrospective, non-randomized study design with a relatively small
sample size makes it difficult to determine whether the
differences in patients’ characteristics between the HCR
and LCR groups were caused by potential selection bias
or by essential differences between the two groups. In
this regard, cachexia risk may be a significant confounding variable. To reduce this potential bias, all consecutive patients who were treated with the same treatment
modality were included in this study. Furthermore, the
prognostic value of cachexia risk was still significant
after adjustment for important covariates and in stratified analysis by the NCCN-IPI. Second, laboratory
Page 8 of 10
biomarkers for cachexia and systemic inflammation
other than serum albumin were not assessed in our
study. Although serum albumin, one of the representative markers for systemic inflammation [41], was used to
define cachexia risk in this study, the absence of a biomarker that better reflects the muscle wasting process
may weaken the relevance of our risk model for cancer
cachexia. To overcome these pitfalls, a prospectively designed study with sufficient power and sample size including various biomarkers for cancer cachexia is
needed to validate our findings.
Conclusions
Taken together, the data presented here raise the possibility of the GNRI score as a prognostic factor in
DLBCL. In addition, we found that the combined risk
model including GNRI and sarcopenia could better predict patient prognosis relative to GNRI alone. These
findings emphasize the complexity of cancer cachexia
and suggest a close relationship between cachexia, systemic inflammation, and DLBCL.
Supplementary information
Supplementary information accompanies this paper at />1186/s12885-020-06921-2.
Additional file 1: Table S1. Comparison of predictive performance
between the Cox regression models for overall survival.
Abbreviations
ABC: Activated B-cell like; ABW: Actual body weight; BMI: Body mass index;
CI: Confidence interval; CPA: Cyclophosphamide; CR: Complete response;
DLBCL: Diffuse large B-cell lymphoma; DR: Dose reduction; DXR: Doxorubicin;
ECOG PS: Eastern Cooperative Oncology Group performance status;
GCB: Germinal center B-cell like; GNRI: Geriatric Nutritional Risk Index;
HCR: High cachexia risk; HR: Hazard ratio; IBW: Ideal body weight;
IPI: International Prognostic Index; LCR: Low cachexia risk; LDH: Lactate
dehydrogenase; NCCN-IPI: National Comprehensive Cancer NetworkInternational Prognostic Index; OS: Overall survival; PFS: Progression-free
survival; PM: Pectoralis muscle; R-CHOP: Rituximab plus cyclophosphamide,
doxorubicin, vincristine, and prednisone; RDI: Relative dose intensity;
SMI: Skeletal muscle index
Acknowledgments
The English in this document has been checked by at least two professional
editors, both native speakers of English. For a certificate, please see: http://
www.textcheck.com/certificate/1AWBlF
Authors’ contributions
Study conceptualization and design: SG and GL. Data collection: SG, HK,
MHK, SP, and GL. Data analysis and interpretation: SG, SP, and GL. Overall
supervision: HK, GL. All authors have read and approved the manuscript.
Funding
No financial support has been received for this study.
Availability of data and materials
The dataset used and analyzed during the current study are available from
the corresponding author on reasonable request.
Ethics approval and consent to participate
This study was approved by the Institutional Review Board of Gyeongsang
National University Hospital and conducted in accordance with the Good
Go et al. BMC Cancer
(2020) 20:439
Clinical Practice guidelines and the Declaration of Helsinki. Informed consent
was waived because of the retrospective nature of the study.
Consent for publication
Not applicable.
Competing interests
The authors declare that they have no competing interests.
Author details
1
Division of Hematology-Oncology, Department of Internal Medicine,
Gyeongsang National University Changwon Hospital, Gyeongsang National
University College of Medicine, Changwon, Republic of Korea. 2Institute of
Health Science, Gyeongsang National University College of Medicine, Jinju,
Republic of Korea. 3Division of Hematology-Oncology, Department of
Internal Medicine, Gyeongsang National University Hospital, Gyeongsang
National University College of Medicine, Gangnam-ro 79, Jinju 52727,
Republic of Korea.
Received: 3 March 2020 Accepted: 30 April 2020
References
1. Al-Hamadani M, Habermann TM, Cerhan JR, Macon WR, Maurer MJ, Go RS.
Non-Hodgkin lymphoma subtype distribution, geodemographic patterns,
and survival in the US: a longitudinal analysis of the National Cancer Data
Base from 1998 to 2011. Am J Hematol. 2015;90:790–5.
2. Pfreundschuh M, Kuhnt E, Trumper L, Osterborg A, Trneny M, Shepherd L,
et al. CHOP-like chemotherapy with or without rituximab in young patients
with good-prognosis diffuse large-B-cell lymphoma: 6-year results of an
open-label randomised study of the MabThera international trial (MInT)
group. Lancet Oncol. 2011;12:1013–22.
3. Coiffier B, Thieblemont C, Van Den Neste E, Lepeu G, Plantier I, Castaigne S,
et al. Long-term outcome of patients in the LNH-98.5 trial, the first
randomized study comparing rituximab-CHOP to standard CHOP
chemotherapy in DLBCL patients: a study by the Groupe d'Etudes des
Lymphomes de l'Adulte. Blood. 2010;116:2040–5.
4. International Non-Hodgkin's Lymphoma Prognostic Factors P. A predictive
model for aggressive non-Hodgkin's lymphoma. N Engl J Med. 1993;329:
987–94.
5. Sehn LH, Berry B, Chhanabhai M, Fitzgerald C, Gill K, Hoskins P, et al. The
revised international prognostic index (R-IPI) is a better predictor of
outcome than the standard IPI for patients with diffuse large B-cell
lymphoma treated with R-CHOP. Blood. 2007;109:1857–61.
6. Zhou Z, Sehn LH, Rademaker AW, Gordon LI, Lacasce AS, Crosby-Thompson
A, et al. An enhanced international prognostic index (NCCN-IPI) for patients
with diffuse large B-cell lymphoma treated in the rituximab era. Blood. 2014;
123:837–42.
7. Swerdlow SH, Campo E, Pileri SA, Harris NL, Stein H, Siebert R, et al. The
2016 revision of the World Health Organization classification of lymphoid
neoplasms. Blood. 2016;127:2375–90.
8. Chapuy B, Stewart C, Dunford AJ, Kim J, Kamburov A, Redd RA, et al.
Molecular subtypes of diffuse large B cell lymphoma are associated with
distinct pathogenic mechanisms and outcomes. Nat Med. 2018;24:679–90.
9. Tucci A, Martelli M, Rigacci L, Riccomagno P, Cabras MG, Salvi F, et al.
Comprehensive geriatric assessment is an essential tool to support
treatment decisions in elderly patients with diffuse large B-cell lymphoma: a
prospective multicenter evaluation in 173 patients by the lymphoma Italian
Foundation (FIL). Leuk Lymphoma. 2015;56:921–6.
10. Fearon K, Strasser F, Anker SD, Bosaeus I, Bruera E, Fainsinger RL, et al.
Definition and classification of cancer cachexia: an international consensus.
Lancet Oncol. 2011;12:489–95.
11. Chowdhry SM. Chowdhry VK. Curr Opin Support Palliat Care: Cancer
cachexia and treatment toxicity; 2019.
12. Fearon KC, Voss AC, Hustead DS, Cancer Cachexia Study G. Definition of
cancer cachexia: effect of weight loss, reduced food intake, and systemic
inflammation on functional status and prognosis. Am J Clin Nutr. 2006;83:
1345–50.
13. Silva GAD, Wiegert EVM, Calixto-Lima L, Oliveira LC. Clinical utility of the
modified Glasgow Prognostic Score to classify cachexia in patients with
advanced cancer in palliative care. Clin Nutr. 2019.
Page 9 of 10
14. Park S, Han B, Cho JW, Woo SY, Kim S, Kim SJ, et al. Effect of nutritional
status on survival outcome of diffuse large B-cell lymphoma patients
treated with rituximab-CHOP. Nutr Cancer. 2014;66:225–33.
15. Burkart M, Schieber M, Basu S, Shah P, Venugopal P, Borgia JA, et al.
Evaluation of the impact of cachexia on clinical outcomes in aggressive
lymphoma. Br J Haematol. 2019;186:45–53.
16. Go SI, Park MJ, Song HN, Kim HG, Kang MH, Lee HR, et al. Prognostic impact
of sarcopenia in patients with diffuse large B-cell lymphoma treated with
rituximab plus cyclophosphamide, doxorubicin, vincristine, and prednisone.
J Cachexia Sarcopenia Muscle. 2016;7:567–76.
17. Dalia S, Chavez J, Little B, Bello C, Fisher K, Lee JH, et al. Serum albumin
retains independent prognostic significance in diffuse large B-cell
lymphoma in the post-rituximab era. Ann Hematol. 2014;93:1305–12.
18. Bouillanne O, Morineau G, Dupont C, Coulombel I, Vincent JP, Nicolis I, et al.
Geriatric nutritional risk index: a new index for evaluating at-risk elderly
medical patients. Am J Clin Nutr. 2005;82:777–83.
19. Kanemasa Y, Shimoyama T, Sasaki Y, Hishima T, Omuro Y. Geriatric
nutritional risk index as a prognostic factor in patients with diffuse large B
cell lymphoma. Ann Hematol. 2018;97:999–1007.
20. Li Z, Guo Q, Wei J, Jin J, Wang J. Geriatric nutritional risk index is not an
independent predictor in patients with diffuse large B-cell lymphoma.
Cancer Biomark. 2018;21:813–20.
21. Consultation WHOE. Appropriate body-mass index for Asian populations
and its implications for policy and intervention strategies. Lancet. 2004;363:
157–63.
22. Prado CM, Lieffers JR, McCargar LJ, Reiman T, Sawyer MB, Martin L, et al.
Prevalence and clinical implications of sarcopenic obesity in patients with
solid tumours of the respiratory and gastrointestinal tracts: a populationbased study. Lancet Oncol. 2008;9:629–35.
23. Go SI, Park MJ, Song HN, Kim HG, Kang MH, Kang JH, et al. A comparison of
pectoralis versus lumbar skeletal muscle indices for defining sarcopenia in
diffuse large B-cell lymphoma - two are better than one. Oncotarget. 2017;
8:47007–19.
24. Tomita N, Kodama F, Motomura S, Koharazawa H, Fujita H, Harano H, et al.
Prognostic factors in diffuse large B-cell lymphoma treated by risk-adopted
therapy. Intern Med. 2006;45:247–52.
25. Gaudio F, Giordano A, Perrone T, Pastore D, Curci P, Delia M, et al. High Ki67
index and bulky disease remain significant adverse prognostic factors in
patients with diffuse large B cell lymphoma before and after the
introduction of rituximab. Acta Haematol. 2011;126:44–51.
26. Hwang HS, Yoon DH, Suh C, Huh J. Body mass index as a prognostic factor
in Asian patients treated with chemoimmunotherapy for diffuse large B cell
lymphoma, not otherwise specified. Ann Hematol. 2015;94:1655–65.
27. Carson KR, Bartlett NL, McDonald JR, Luo S, Zeringue A, Liu J, et al. Increased
body mass index is associated with improved survival in United States
veterans with diffuse large B-cell lymphoma. J Clin Oncol. 2012;30:3217–22.
28. Zhou Z, Rademaker AW, Gordon LI, LaCasce AS, Crosby-Thompson A,
Vanderplas A, et al. High body mass index in elderly patients with DLBCL
treated with rituximab-containing therapy compensates for negative impact
of male sex. J Natl Compr Cancer Netw. 2016;14:1274–81.
29. Hong F, Habermann TM, Gordon LI, Hochster H, Gascoyne RD, Morrison VA,
et al. The role of body mass index in survival outcome for lymphoma
patients: US intergroup experience. Ann Oncol. 2014;25:669–74.
30. Lanic H, Kraut-Tauzia J, Modzelewski R, Clatot F, Mareschal S, Picquenot JM,
et al. Sarcopenia is an independent prognostic factor in elderly patients
with diffuse large B-cell lymphoma treated with immunochemotherapy.
Leuk Lymphoma. 2014;55:817–23.
31. Camus V, Lanic H, Kraut J, Modzelewski R, Clatot F, Picquenot JM, et al.
Prognostic impact of fat tissue loss and cachexia assessed by computed
tomography scan in elderly patients with diffuse large B-cell lymphoma
treated with immunochemotherapy. Eur J Haematol. 2014;93:9–18.
32. Chu MP, Lieffers J, Ghosh S, Belch A, Chua NS, Fontaine A, et al. Skeletal
muscle density is an independent predictor of diffuse large B-cell
lymphoma outcomes treated with rituximab-based chemoimmunotherapy.
J Cachexia Sarcopenia Muscle. 2017;8:298–304.
33. Nakamura N, Hara T, Shibata Y, Matsumoto T, Nakamura H, Ninomiya S,
et al. Sarcopenia is an independent prognostic factor in male patients with
diffuse large B-cell lymphoma. Ann Hematol. 2015;94:2043–53.
34. Bairey O, Shacham-Abulafia A, Shpilberg O, Gurion R. Serum albumin level
at diagnosis of diffuse large B-cell lymphoma: an important simple
prognostic factor. Hematol Oncol. 2016;34:184–92.
Go et al. BMC Cancer
(2020) 20:439
35. Monitto CL, Dong SM, Jen J, Sidransky D. Characterization of a human
homologue of proteolysis-inducing factor and its role in cancer cachexia.
Clin Cancer Res. 2004;10:5862–9.
36. Whitehouse AS, Tisdale MJ. Increased expression of the ubiquitinproteasome pathway in murine myotubes by proteolysis-inducing factor
(PIF) is associated with activation of the transcription factor NF-kappaB. Br J
Cancer. 2003;89:1116–22.
37. Argiles JM, Busquets S, Stemmler B, Lopez-Soriano FJ. Cancer cachexia:
understanding the molecular basis. Nat Rev Cancer. 2014;14:754–62.
38. Daas SI, Rizeq BR, Nasrallah GK. Adipose tissue dysfunction in cancer
cachexia. J Cell Physiol. 2018;234:13–22.
39. Costelli P, Muscaritoli M, Bonetto A, Penna F, Reffo P, Bossola M, et al.
Muscle myostatin signalling is enhanced in experimental cancer cachexia.
Eur J Clin Investig. 2008;38:531–8.
40. Benny Klimek ME, Aydogdu T, Link MJ, Pons M, Koniaris LG, Zimmers TA.
Acute inhibition of myostatin-family proteins preserves skeletal muscle in
mouse models of cancer cachexia. Biochem Biophys Res Commun. 2010;
391:1548–54.
41. Arroyo V, Garcia-Martinez R, Salvatella X. Human serum albumin, systemic
inflammation, and cirrhosis. J Hepatol. 2014;61:396–407.
Publisher’s Note
Springer Nature remains neutral with regard to jurisdictional claims in
published maps and institutional affiliations.
Page 10 of 10