Achieving objective response in treatment of non-resectable neuroendocrine tumors does not predict longer time to progression compared to achieving stable disease
Bạn đang xem bản rút gọn của tài liệu. Xem và tải ngay bản đầy đủ của tài liệu tại đây (779.09 KB, 7 trang )
Thiis-Evensen et al. BMC Cancer
(2020) 20:466
/>
RESEARCH ARTICLE
Open Access
Achieving objective response in treatment
of non-resectable neuroendocrine tumors
does not predict longer time to
progression compared to achieving stable
disease
Espen Thiis-Evensen1* , Amalie Christine Poole2, Hong-Thien Thi Nguyen2 and Jon Sponheim1
Abstract
Background: There are several treatment modalities for unresectable neuroendocrine tumors. Traditionally, the aim
of these treatments has been to reduce the tumor load; referred to as objective response (OR). Less emphasis has
been put on inducing the tumors to stop growing without a reduction in total tumor load; termed as stable
disease (SD). We wanted to investigate whether achieving OR compared to obtaining SD predicted a longer time
to progression (TTP) in patients with neuroendocrine tumors (WHO Grade 1 and 2) treated with peptide receptor
radionuclide therapy, chemotherapy or molecular targeted therapy.
Methods: Patients treated with either peptide receptor radionuclide therapy (PRRT) with 177Lutetium-DOTAoctreotate, the chemotherapy combination streptozotocin/5-fluorouracil or everolimus were retrospectively
assessed to evaluate the effect of the treatments on disease progression. We analyzed the TTP for patients for each
treatment modality and compared the TTP between those who achieved OR and those who achieved SD.
Results: Altogether 56 patients treated with PRRT, 32 treated with streptozotocin/5-fluorouracil and 52 treated with
everolimus were included in the analyses. The median TTP for those treated with PRRT and achieving OR was 31
months, the TTP for those achieving SD was 43 months (p = 0,2). For patients treated with streptozotocin/5fluorouracil the results were: OR: 18 months, SD: 23 months (p = 0,9) and for those treated with everolimus; OR: 9
months, SD: 20 months (p = 0,5), respectively. We found no differences between patients achieving OR compared to
SD regarding age, sex, stage, primary tumor location, Ki-67% or ongoing treatment with somatostatin analogues.
Conclusions: We found no treatment benefit with regard to TTP for our patients that experienced OR compared to
those who achieved SD.
Keywords: Neuroendocrine tumor, Treatment, Radiology, Peptide receptor radionuclide therapy, Chemoteraphy
* Correspondence:
1
Center for neuroendocrine tumors, Department of Gastroenterology, Oslo
University Hospital, Rikshospitalet, Sognsvannsveien 20, 0424 Oslo, Norway
Full list of author information is available at the end of the article
© The Author(s). 2020 Open Access This article is licensed under a Creative Commons Attribution 4.0 International License,
which permits use, sharing, adaptation, distribution and reproduction in any medium or format, as long as you give
appropriate credit to the original author(s) and the source, provide a link to the Creative Commons licence, and indicate if
changes were made. The images or other third party material in this article are included in the article's Creative Commons
licence, unless indicated otherwise in a credit line to the material. If material is not included in the article's Creative Commons
licence and your intended use is not permitted by statutory regulation or exceeds the permitted use, you will need to obtain
permission directly from the copyright holder. To view a copy of this licence, visit />The Creative Commons Public Domain Dedication waiver ( applies to the
data made available in this article, unless otherwise stated in a credit line to the data.
Thiis-Evensen et al. BMC Cancer
(2020) 20:466
Background
Neuroendocrine tumors (NET) are a heterogeneous
group of tumors arising from neuroendocrine cells.
Their incidence is increasing worldwide. In Norway the
registered increase has been from 5.3 per 100.000 in
1993–2001 to 7.0 in 2006–2010 [1]. Most NETs, about
70%, arise from the gastro-entero-pancreatic system [1, 2].
Surgery is as of today the only treatment modality that
can cure the patient. More than 50% of the patients, however, presents with unresectable disseminated disease,
often as an incidental finding. There are several treatment
modalities that have been shown to reduce the tumor load
or stop tumor growth. The most commonly used are somatostatin analogues, molecular targeted therapy (everolimus, sunitinib), peptide receptor radionuclide therapy
(PRRT), and chemotherapy [3–8]. Traditionally, studies
reporting the effect of these treatments have put most emphasis on the tumor load reducing effect (objective response; OR). Less emphasis, until recently, has been put
on the treatments ability to stop tumors growth without
necessarily reducing the total tumor volume (disease
stabilization, stable disease; SD). In our clinical practice,
we have had the impression that NET patients who have
an objective response often seem to have a shorter time to
progression than those who achieve disease stabilization.
We wanted to investigate whether there was a difference
in the time to progression (TTP) for patients with noncurable neuroendocrine tumors that experience an OR
compared to those with SD.
Page 2 of 7
comparable in quality and performed with the same modality and same protocols for contrast enhancement.
With this method changes in diameter of a lesion of 1–
2 mm were not considered as significant due to minute
differences in contrast enhancement between examinations and to small operator differences in performing the
measurement of the lesions. Treatment response was defined as objective response (any unequivocal shrinkage
of tumors, OR) or stable disease (no changes in number
or size of tumors, SD). For patients treated with PRRT
radiological response evaluation was in addition to the
“conventional method” also performed according to the
RECIST 1.1 criteria [9]. These RECIST assessments were
performed by one single experienced senior oncologyradiologist.
Stz/5-FU
This chemotherapy combination was mainly given to patients with pancreatic NETs as first-line treatment. The
chemotherapy was administrated as a 5-days induction
course followed with one-day cycles every 3 weeks.
Seventy-two patients were evaluated. They received their
treatment between April 2007 and May 2017. The best
treatment effect based on radiological assessment was
OR in 27 (38%), SD in 16 (22%) and progressive disease
(PD) in 29 (40%) patients. Median progression-free survival was 11 months.
Methods
PRRT
Patients
At our institution PRRT is usually given as second- or
third-line treatment. Altogether 79 patients were treated
with a median of 4 cycles with 177Lutetium-DOTAoctreotate [9]. They received their PRRT treatment in
the period of January 2006 to March 2014. The best
treatment effect based on radiological assessment using
the “conventional method” was OR in 42 (53%), SD in
17 (22%) and progressive disease (PD) in 20 (25%) patients. Median progression free survival was 28 months.
If the RECIST 1.1. was applied, the best effect was OR in
13 (17%), SD in 54 (68%) and progressive disease (PD) in
12 (15%) patients. Based on the RECIST 1.1., the median
progression free survival, was 33 months.
All patients were treated at our center, a European Neuroendocrine Tumor Society (ENETS) accredited Center
of Excellence in the treatment and care for patients with
NETs, with a catchment area of 2.8 million people. We
identified all patients treated with PRRT, the chemotherapy combination streptozocin/5-fluorouracil (stz/5-FU)
or everolimus and the radiological response was retrospectively evaluated.
Radiological assessment
The radiological response evaluation was usually performed 6 months after the last cycle of PPRT-treatment
and thereafter every 6 months. For patients treated with
stz/5-FU and everolimus, response evaluation was performed every 3 months. The evaluation was performed
with contrast-enhanced CT-scans with arterial and portal venous phase or with contrast-enhanced MRI. With
our routine evaluation of treatment effect, termed the
“conventional method”, progressive disease is defined as
detection of new lesions or any unequivocal increase in
the size of known tumors, based on measurements of
the individual lesions, when comparing examinations
Everolimus
Everolimus is used as a second- to fifth-line of treatment
and a total of 98 patients who received treatment between December 2008 and September 2017 were evaluated. The best treatment effect based on radiological
assessment was OR in 15 (15%), SD in 45 (46%) and progressive disease (PD) in 14 (14%) patients. Median
progression-free survival was 8.2 months.
Thiis-Evensen et al. BMC Cancer
(2020) 20:466
Inclusion criteria
The inclusion criteria were tissue sample verified neuroendocrine tumor with Ki-67% assessment, WHO grade 1
or 2 (Ki 67 20% or below), metastatic or non-resectable
disease, lesions measurable on radiological evaluation,
and at least one radiological evaluation after initiating
therapy (stz/5-FU, everolimus) or after completed all
planned cycles of PRRT. If the same patient had several
tissue samples taken, the one with the highest Ki-67%
was used to define WHO grade. Only patients with OR
or SD as best radiological treatment response (based on
the “conventional method”) were included.
Statistics
Time to progression (TTP) was calculated for all study
groups. For the PRRT cohort TTP was calculated both
for the best treatment response based on the “conventional method” and for the best treatment response
based on RECIST1.1. Log-rank test was used to compare
survival curves, Mann-Whitney U-test was used to compare continuous variables, Chi-Square (or Fisher’s Exact
test when appropriate) was used for testing categorical
variables. A p-value below 0.05 was considered statistically significant. Inter-quartile range, the range from the
25th to the 75th centile, was used to present the range
in Ki-67% estimates. As this study was exploratory no
statistical power analyses were performed. The statistical
analyses were performed using SPSS 23.0 software (SPSS
Inc., Chicago, Ill.).
Results
In the stz/5-FU group 32 patients, in the PRRT treated
group 56 patients and in the everolimus group 52
Page 3 of 7
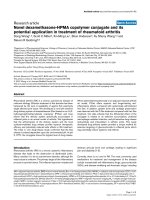
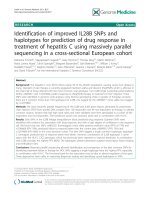
patients fulfilled the inclusion criteria (Fig. 1). The distribution of gender, age, primary tumor location, stage,
previous treatments and ongoing treatment with somatostatin analogues are given in Table 1. Pancreas and
the small intestine were the most common primary sites
comprising altogether 74% of the study cohort. Pancreas
as the primary tumor location dominated in the group
treated with stz/5-FU, comprising 67% of the patients.
Almost all patients had distant disease. Stz/5-FU was
mostly used as first-line treatment, PRRT third-line and
everolimus as fourth-line treatments. Only 1 patient in
the stz/5-FU group had previously been treated with
PRRT or everolimus whereas 43 (83%) in the everolimus
group had previously been treated with stz/5-FU or
everolimus (Table 1).
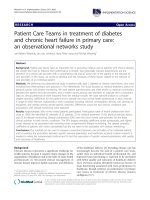
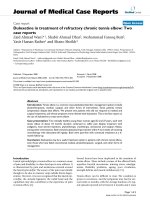
In the group treated with stz/5-FU the median TTP
for those who achieved objective response was 18
months (95% confidence interval (CI) 12–24), and for
those who obtained stable disease 23 months (95% CI:
9–36), p = 0.8 (Fig. 2). The same figures for those who
achieved objective response compared to stable disease
in the PRRT group were 43 months (95% CI: 41–44)
compared to 31 (95% CI:28–34) p = 0,2, and for the
everolimus group 9 months (95% CI: 2–17) compared to
20 months (95%CI: 13–26) p = 0,5, respectively. If the
RECIST criteria were applied for response evaluation in
the PRRT treated group instead of the “conventional
method”, the median TTP for those who achieved OR
compared to those with SD was 39 months (95%CI: 25–
52) and 37 months (95%CI: 29–45), p = 0,6, (Fig. 2).
When we compared the factors age, sex, Ki-67% and
stage between those with OR and those with SD, we
found no statistically significant differences or trends
Fig. 1 Flowchart showing the selection of patients from the original studies
Thiis-Evensen et al. BMC Cancer
(2020) 20:466
Page 4 of 7
Table 1 Patient characteristics
Stz/5-FU n = 32
PRRT n = 56
Everolimus n = 52
65 (28–83)
63 (29–79)
66 (41–81)
20 (63)
26 (46)
31 (60)
Pancreas
22 (67)
18 (32)
17 (33)
Small intestine
1 (3)
26 (46)
19 (37)
Lung
3 (9)
1 (2)
9(17)
Rectum
1(3)
3 (5)
Age, years Median (range)
Sex
Female
Primary focus (%)
Kidney
Duodenum
1(2)
1(3)
1(2)
Pheochromocytoma
Gastric
1(2)
1(3)
Thymus
Unknown
1(2)
3 (9)
5 (9)
6 (12)
Regional
2 (6)
1 (2)
4 (8)
Distant
Stage
30 (94)
55 (98)
48 (92)
Previous treatment with PRRT
1 (3)
–
25 (48)
Previous treatment with stz/5FU
–
12 (21)
18 (35)
Previous treatment with everolimus
1 (3)
1 (2)
–
Previous treatment with stz/5FU and PRRT
–
–
20 (38)
Number of previous treatmentsa Median (mean)
0 (0,6)
1,9 (2,0)
3 (2,6)
Follow-up time Months (min-max)
47 (5–113)
48 (10–98)
14 (4–77)
Patient demographics, site of primary and previous treatments with PRRT, Stz/5FU and everolimus, (percent) and follow-up time (from last CT before initiation of
therapy to death or end of study)
a
Includes all types of tumor targeted treatments, including surgery
(Table 2). For those treated with stz/5-FU and PRRT, a
larger proportion of women than men obtained OR, but
for everolimus it was vice versa. However, these differences were not statistically significant.
Discussion
In this study with patients with neuroendocrine tumors
grade I-II treated with several classes of tumor targeted
treatments, we did not find any statistically differences
in TTP between those who achieved OR and those who
achieved SD. There was, however, a trend towards
shorter TTP for those who achieved OR. We have not
been able to find any other study that systematically
compare the TTP in response groups (OR or SD) in
tumor targeted therapies. We found no differences in
patient- or tumor characteristics that separated the two
response groups. Age, Ki 67%, site of primary tumor location and stage were comparable within the two response groups. This may indicate that there could be
other biological factors than Ki67% and the known behavior of the different primaries that could influence
both the response and the duration of the response to
tumor targeted treatment modalities.
The strength of this study was that all patients were
well characterized, treated in a single center and none of
the patients were lost to follow up. The study has, however, several limitations. The numbers of patients in
each group were few and the power to detect differences
between the response groups low. Some patients were
included in more than one group, i.e. 83% in the everolimus group had previously been treated with stz/5-FU or
PRRT, and 38% had received both treatments. This
might lead to a selection bias reproducing the same pattern with those with SD tending to have longer TTP for
the different treatment modalities studied. Still, this did
not alter the main observation that the patient and
tumor characteristics recorded could not explain why
those who achieved OR did not obtain a longer TTF,
but rather a tendency towards a shorter TTP. Differences in tumor grade is theoretically the most plausible
explanation for any differences in TTP between the
groups. We found no such difference between the
groups with regards to the proliferation marker Ki67%
Thiis-Evensen et al. BMC Cancer
(2020) 20:466
Page 5 of 7
Fig. 2 Time to progression. Time to progression in months for
patients achieving stable disease (SD) and objective response (OR)
treated with (a): streptozotocin/5-FU, (b): everolimus and (c) and (d):
PRRT. Radiological response evaluation is done with the
“conventional method” in (a), (b) and (c), where any unequivocal
change in the the size of known tumors are considered significant.
In (d) the response evaluation was done according to the RECIST
1.1 criteria
although this could be due to the rather limited number
of patients. We cannot know for sure whether the recorded Ki-67% estimates are representative for each of
the patients. We know that there is significant intratumor heterogeneity [10] and that there are differences in
Ki-67% between primaries and metastases [11]. We only
have one to three Ki-67% estimates from each patient,
and with disseminated disease, this estimate might not
be representative for their disease. Some of the Ki-67%
assessments were performed by less experienced pathologists and not all samples were reexamined by our institution’s pathologists specialized in neuroendocrine
neoplasms. We do not believe, however, that occasional
suboptimal evaluation of the proliferation index would
systematically bias the assessment, but tend to both
over- and underestimate the Ki67%, probably at the
same extent.
The method used to assess radiological response in
this study is both a strength and a limitation. The most
widely used radiological response criteria for radiological
response evaluation in treatment studies on neuroendocrine tumors are the Response Evaluation Criteria In
Solid Tumors (RECIST 1.0 or 1.1) [12] the Southwest
Oncology Group standard response criteria (SWOG)
[13] and the WHO criteria [14]. These criteria were introduced to evaluate the effect of chemotherapy on
tumor burden and are based on measuring the diameter
of predefined target lesions as well as detection of any
new lesions. In the RECIST-criteria, the most widely
used assessment method, the diameters of the target lesions are added, and an increase from the start of treatment, or after initial therapy-induced tumor shrinkage,
of 20% or more is defined as progressive disease. A reduction of 30% or more is defined as an objective response. Any change between 20% increase and 30%
reduction is classified as stable disease. If new lesions
emerge, or if preexisting non-target lesions grow, even if
there is no change in the target lesions, the patient has
progressive disease. RECIST is far from optimal for
evaluating treatment response in slow-growing malignancies such as neuroendocrine tumors [15]. We have
previously shown that assessing treatment response with
RECIST gives an unrealistic positive impression of the
treatment effect compared to assessing the treatment response with our “conventional method” [9]. The
Thiis-Evensen et al. BMC Cancer
(2020) 20:466
Page 6 of 7
Table 2 Treatment effects
Streptozocin/5-FU
Age years, median mean)
PRRT
Everolimus
OR n = 22
SD n = 10
p-value
OR n = 39
SD n = 17
p-value
OR n = 12
SD n = 40
p-value
63 (63)
65 (65)
1.0
62 (62)
65
0,2
65 (65)
67 (66)
0,9
Sex, female (%)
10 (83)
2 (17)
0,2
20 (77)
6 (23)
0,2
2 (17)
19 (48)
0,06
Ongoing SSA treatment (%)
3 (14)
0
0,5
21 (54)
10 (59)
0,7
7 (58)
25 (63)
0,8
Prior treatments Median (mean)
0 (0,6)
0 (0,6)
1,0
2 (1,8)
2 (2,2)
0,1
2,5 (2,4)
3 (2,7)
0,7
Total group
10 (10–13)
10 (3–13)
0,2
7 (3,5–10)
6 (1–10)
0,4
9 (3,5-11,5)
9 (5–12)
0,7
Pancreas
10 (8–13)
10 (10–14)
0,7
7 (4–12,5)
10 (5,5–10)
1,0
8 (5–13)
10 (8,5-12,5)
0,5
Small intestinal
–
–
–
6 (2,5-11,5)
3 (1–8,5)
0,4
6 (1,5–10)
7 (3–11,5)
0,4
0,5
1 (3)
0
0,5
1 (8)
3 (8)
0,9
38 (97)
17 (100)
11 (92)
37 (92)
Ki67% Median (IQR)
Stage No. patients (%)
Regional
1 (5)
1 (10)
Distant
21 (95)
9 (90)
Age, sex, ongoing somatostatin analogue-treatment, prior treatments, Ki 67% and stage for from patients divided into treatment modality and best treatment
response; objective response or stable. For Ki 67% data is given for the total patient group and further subdivided into the most common primaries; pancreas and
small intestine. SSA somatostatin analogue, IQR interquartile range
treatment response in the SD-group based on these criteria varies from a 19% increase to 29% decrease in
added target lesion diameter. The heterogeneity in this
group restricts our possibility to detect clinically interesting features as demonstrated in our study where the
survival curves for those treated with PRRT overlaps
when the RECIST criteria are used and diverges when
evaluated with the “conventional method” (where any
unequivocal change was regarded significant). The “conventional method” is, however, far from optimal. It lacks
standardization and it is based on one or two radiologist’s overall impression of the tumor status. It is therefore not suitable in treatment trials or for reproducing
results made by other investigators. Our results indicate,
however, that radiological response evaluation systems
that are more sensitive to response changes in neuroendocrine tumors are highly needed. With the high resolution of today’s radiological procedures one could argue
that the thresholds used for classifying the different
overall response groups in RECIST could be redefined.
For example, 5% increase in the sum of diameters of target lesions instead of 20% could define progressive disease. Decreased tumor density as an effect of treatment
secondary to tumor necrosis is not taken into account in
the above mentioned response evaluation systems.
Sometimes reduction in tumor viability, recognized as
changes in contrast uptake, is the only initial sign of
treatment effect. To meet these challenges in response
evaluation irRECIST has been introduced [16]. The Choi
criteria combine density and size with a lower size
threshold than RECIST, and has been proposed for use
in response evaluation for neuroendocrine tumors [17].
It has been shown to be more accurate compared to
RECIST in a trial of sunitinib for gastroenteropancreatic
neuroendocrine tumors [18]. Other response evaluation
systems incorporating density and size as mRECIST,
Chun and MASS [19–21] have so far not been validated
for evaluation of treatment effect in neuroendocrine tumors. In the future we will probably also see that artificial intelligence with its ability to detect and interpret
minor changes in size and density in the CT, MRI and
PET examinations will be used in routine evaluations
[22].
Conclusion
For several tumor targeted therapies we found no benefit
with regards to TTP for those who experienced OR
compared to those who achieved SD.
Abbreviations
CT: Computed tomography; IQR: Interquartile range; 5-FU: 5-fluorouracil;
MRI: Magnetic resonance imaging; NET: Neuroendocrine tumors;
OR: Objective response; PET: Positron emission tomography; PRRT: Peptide
receptor radionuclide therapy; SD: Stable disease; SSA: Somatostatin
analogue; Stz: Streptozocin; TTP: Time to progression
Acknowledgements
Not applicable.
Author’ contributions
ET has made substantial contributions to the conception and design of the
work, the acquisition, analysis, and interpretation of data and has drafted the
work and approved the final version. ACP and HTN have made substantial
contributions or the acquisition and analysis and interpretation of data for
the work and have been revising it critically for important intellectual
content revising it critically for important intellectual content and approved
the final version of the work. JS has made substantial contributions to the
interpretation of data for the work and has been revising it critically for
important intellectual content and approved the final version of the work. All
authors have read and approved the manuscript.
Funding
This study received no funding.
Thiis-Evensen et al. BMC Cancer
(2020) 20:466
Availability of data and materials
The datasets used and/or analysed during the current study are available
from the corresponding author on reasonable request.
Ethics approval and consent to participate
The institutional review board approved the study and approved accessing
the medical files of the participating patients (Personvernombudet, Oslo
University Hospital, executive officer Anika Mortensen). As this study was an
observational study with no intervention, informed consent from the
patients was not necessary according to the national standard (Norwegian
Health Record Act §6–2, and The Health Personnel Act).
Consent for publication
Not applicable.
Competing interests
Espen Thiis-Evensen has received an unrestricted research grants from Novartis and has also received speaker honorarium from Novartis, Ipsen, Pfizer and
MSD. Jon Sponheim has received a received speaker honorarium from Ipsen.
Amalie Christine Poole, Hong-Thien Thi Nguyen have no conflicts of interest
to declare.
Author details
1
Center for neuroendocrine tumors, Department of Gastroenterology, Oslo
University Hospital, Rikshospitalet, Sognsvannsveien 20, 0424 Oslo, Norway.
2
Faculty of Medicine, University of Oslo, Oslo, Norway.
Page 7 of 7
12.
13.
14.
15.
16.
17.
18.
Received: 25 February 2020 Accepted: 14 May 2020
19.
References
1. Boyar Cetinkaya R, Aagnes B, Thiis-Evensen E, Tretli S, Bergestuen DS,
Hansen S. Trends in incidence of neuroendocrine neoplasms in Norway: a
report of 16,075 cases from 1993 through 2010. Neuroendocrinology. 2017;
104(1):1–10.
2. Dasari A, Shen C, Halperin D, Zhao B, Zhou S, Xu Y, et al. Trends in the
incidence, prevalence, and survival outcomes in patients with
neuroendocrine tumors in the United States. JAMA Oncol. 2017;3(10):1335–
42.
3. Rinke A, Müller HH, Schade-Brittinger C, Klose KJ, Barth P, Wied M, et al.
Placebo-controlled, double-blind, prospective, randomized study on the
effect of octreotide LAR in the control of tumor growth in patients with
metastatic neuroendocrine midgut tumors: a report from the PROMID study
group. J Clin Oncol. 2009;27(28):4656–63.
4. Caplin ME, Pavel M, Ćwikła JB, Phan AT, Raderer M, Sedláčková E, et al.
Lanreotide in metastatic enteropancreatic neuroendocrine tumors. N Engl J
Med. 2014;371(3):224–33.
5. Yao JC, Fazio N, Singh S, Buzzoni R, Carnaghi C, Wolin E, et al. Everolimus
for the treatment of advanced, non-functional neuroendocrine tumours of
the lung or gastrointestinal tract (RADIANT-4): a randomised, placebocontrolled, phase 3 study. Lancet. 2016;387(10022):968–77.
6. Kulke MH, Lenz HJ, Meropol NJ, Posey J, Ryan DP, Picus J, et al. Activity of
sunitinib in patients with advanced neuroendocrine tumors. J Clin Oncol.
2008;26(20):3403–10.
7. Strosberg J, El-Haddad G, Wolin E, Hendifar A, Yao J, Chasen B, et al. Phase
3 trial of (177)Lu-Dotatate for Midgut neuroendocrine tumors. N Engl J Med.
2017;376(2):125–35.
8. Clewemar Antonodimitrakis P, Sundin A, Wassberg C, Granberg D, Skogseid
B, Eriksson B. Streptozocin and 5-fluorouracil for the treatment of pancreatic
neuroendocrine tumors: efficacy, prognostic factors and toxicity.
Neuroendocrinology. 2016;103(3–4):345–53.
9. Løitegård T, Berntzen DT, Thiis-Evensen E. The RECIST criteria compared to
conventional response evaluation after peptide receptor radionuclide
therapy in patients with neuroendocrine neoplasms. Ann Nucl Med. 2019;
33(3):147–52.
10. Grillo F, Valle L, Ferone D, Albertelli M, Brisigotti MP, Cittadini G, et al. KI-67
heterogeneity in well differentiated gastro-entero-pancreatic
neuroendocrine tumors: when is biopsy reliable for grade assessment?
Endocrine. 2017;57(3):494–502.
11. Richards-Taylor S, Tilley C, Jaynes E, Hu H, Armstrong T, Pearce NW, et al.
Clinically Significant Differences in Ki-67 Proliferation Index Between Primary
20.
21.
22.
and Metastases in Resected Pancreatic Neuroendocrine Tumors. Pancreas.
2017;46(10):1354–8.
Therasse P, Arbuck SG, Eisenhauer EA, Wanders J, Kaplan RS, Rubinstein L,
et al. New guidelines to evaluate the response to treatment in solid tumors.
European Organization for Research and Treatment of Cancer, National
Cancer Institute of the United States, National Cancer Institute of Canada. J
Natl Cancer Inst. 2000;92(3):205–16.
Green S, Weiss GR. Southwest Oncology Group standard response criteria,
endpoint definitions and toxicity criteria. Investig New Drugs. 1992;10(4):
239–53.
Miller AB, Hoogstraten B, Staquet M, Winkler A. Reporting results of cancer
treatment. Cancer. 1981;47(1):207–14.
de Mestier L, Dromain C, d'Assignies G, Scoazec JY, Lassau N, Lebtahi R,
et al. Evaluating digestive neuroendocrine tumor progression and
therapeutic responses in the era of targeted therapies: state of the art.
Endocr Relat Cancer. 2014;21(3):R105–20.
Nishino M, Gargano M, Suda M, Ramaiya NH, Hodi FS. Optimizing immunerelated tumor response assessment: does reducing the number of lesions
impact response assessment in melanoma patients treated with
ipilimumab? J Immunother Cancer. 2014;2:17.
Choi H, Charnsangavej C, Faria SC, Macapinlac HA, Burgess MA, Patel SR,
et al. Correlation of computed tomography and positron emission
tomography in patients with metastatic gastrointestinal stromal tumor
treated at a single institution with imatinib mesylate: proposal of new
computed tomography response criteria. J Clin Oncol. 2007;25:1753–9.
Luo Y, Chen J, Huang K, Lin Y, Chen M, Xu L, et al. Early evaluation of
sunitinib for the treatment of advanced gastroenteropancreatic
neuroendocrine neoplasms via CT imaging: RECIST 1.1 or Choi Criteria? BMC
Cancer. 2017;17:154.
Lencioni R, Llovet JM. Modified RECIST (mRECIST) assessment for
hepatocellular carcinoma. Semin Liver Dis. 2010;30:52–60.
Chun YS, Vauthey JN, Boonsirikamchai P, Maru DM, Kopetz S, Palavecino M,
et al. Association of computed tomography morphologic criteria with
pathologic response and survival in patients treated with bevacizumab for
colorectal liver metastases. JAMA. 2009;302:2338–44.
Smith AD, Shah SN, Rini BI, Lieber ML, Remer EM. Morphology, attenuation,
size, and structure (MASS) criteria: assessing response and predicting clinical
outcome in metastatic renal cell carcinoma on antiangiogenic targeted
therapy. AJR Am J Roentgenol. 2010;194:1470–8.
Kickingereder P, Isensee F, Tursunova I. Petersen j, Neuberger U, Bonekamp
D, et al. automated quantitative tumour response assessment of MRI in
neuro-oncology with artificial neural networks: a multicentre, retrospective
study. Lancet Oncol. 2019;20(5):728–40.
Publisher’s Note
Springer Nature remains neutral with regard to jurisdictional claims in
published maps and institutional affiliations.