The short and long run effects of debt reduction - Evidence from debt relief under the enhanced HIPC and MDR initiatives
Bạn đang xem bản rút gọn của tài liệu. Xem và tải ngay bản đầy đủ của tài liệu tại đây (302.61 KB, 19 trang )
The current issue and full text archive of this journal is available on Emerald Insight at:
www.emeraldinsight.com/2515-964X.htm
JABES
25,1
144
The short and long run effects of
debt reduction
Evidence from debt relief under the enhanced
HIPC and MDR initiatives
Kelsey Gamel
Received 30 April 2018
Accepted 2 May 2018
Baylor University, Waco, Texas, USA, and
Pham Hoang Van
Department of Economics, Baylor University, Waco, Texas, USA
Abstract
Purpose – The purpose of this paper is to estimate benefits to debt reduction by using the natural
experiment provided by the debt relief programs: the Heavily Indebted Poor Countries Initiative launched by
the International Monetary Fund and World Bank in 1996 and the Multilateral Debt Relief Initiative extension
in 2005.
Design/methodology/approach – The authors apply a time-shifted difference-in-differences strategy to
evaluate the effects of this intervention. The date of each country’s decision to participate in the program is
used as one treatment point while the date of the completion of the debt relief program is used as another
treatment point. The exercise compares different economic outcomes such as domestic and foreign
investment, schooling, and employment of the treated observations to the counterfactual of untreated
country-years. The period between the decision and completion points is a short run while the period after the
completion point is considered a long run.
Findings – The authors found that debt relief increased capital investment as much as 1.63 percent in the
short run and 5.79 percent in the long run. However, there was no effect on foreign direct investment
suggesting that debt overhang does not affect incentives of foreign investors. Output and schooling
enrollment increased both in the short and long run.
Originality/value – This paper exploits a natural experiment of debt relief in a number of developing
countries to shed light on the possible benefits to debt reduction. The authors are able to separate the
short- and long-run effects of debt reduction. The finding that domestic but not foreign investment responds
to debt reduction is suggestive of the differences in incentives across these two sources of investment.
Keywords Debt overhang, Debt relief, Sovereign debt
Paper type Research paper
1. Introduction
The problem of high public debt plagues many countries but is especially burdensome for
developing countries. Servicing the debt can crowd out needed public investment in
education, infrastructure, and poverty alleviation. Government deficits and debt increase the
demand for loanable funds which raises interest rates which crowds out private investment.
Risk of default on the debt puts devaluation pressure on the currency which also increases
the covered interest rate. Debt overhang (Myers, 1977; Krugman, 1988) for heavily indebted
countries also makes it difficult to access new credit which leaves the country even more
vulnerable to crisis.
Journal of Asian Business and
Economic Studies
Vol. 25 No. 1, 2018
pp. 144-162
Emerald Publishing Limited
2515-964X
DOI 10.1108/JABES-04-2018-0008
JEL Classification — F34, H63, O11, O19
© Kelsey Gamel and Pham Hoang Van. Published in the Journal of Asian Business and Economic
Studies. Published by Emerald Publishing Limited. This article is published under the Creative
Commons Attribution (CC BY 4.0) licence. Anyone may reproduce, distribute, translate and create
derivative works of this article (for both commercial and non-commercial purposes), subject to full
attribution to the original publication and authors. The full terms of this licence may be seen at http://
creativecommons.org/licences/by/4.0/legalcode
In this paper, we evaluate the benefits of debt reduction in developing countries by
exploiting a natural experiment of debt relief under two programs: the International Monetary
Fund’s (IMF) and the World Bank’s Heavily Indebted Poor Countries (HIPC) Initiative
launched in 1996 and the Multilateral Debt Relief Initiative (MDRI) in 2005. The HIPC
Initiative aimed to reduce the debt burden to manageable levels to promote growth and to end
continual debt rescheduling. Each country that was eligible for the HIPC Initiative first
worked with the World Bank and the IMF to create a track record. Countries rescheduled debt
payments and worked on macroeconomic reform for three years whereupon they reached the
decision point. It was then determined if the country would be able to reduce its debt burden
enough through the rescheduling and reforms or if further assistance under the HIPC
Initiative was necessary. Once a country reached the decision point, it started receiving
marginal debt relief and continued to work on macroeconomic reform. To reach the
completion point, in which debt relief was delivered in full, each country must have created
and implemented a poverty reduction strategy for at least a year. Once a country reached the
completion point, it received debt relief without any further requirements.
After review of the program up to 1999, the World Bank and the IMF enacted changes and
renamed it the Enhanced HIPC Initiative. Thresholds were lowered, more countries were
eligible, and countries began receiving debt relief in the stage between the decision point and
the completion point. In 2005, the MDRI was established to further help countries reach the
goals. It was essentially an extension of the Enhanced HIPC Initiatives in that it applied to
countries once they reached the completion point under those initiatives. In total, there were
36 HIPCs that received debt relief under the Enhanced HIPC Initiative and the MDRI.
The staggered implementation of debt relief for 36 countries over more than a decade
creates a panel of treated countries that allows us to identify the effects of debt reduction
controlling for country and year fixed effects. We apply a time-shifted difference-in-differences
estimation strategy to account for different decision and completion points as well as different
duration between decision and completion. With data from the World Development Indicators
and the Millennium Development Goals database, we find that debt reduction increased
investment in physical capital in both the short run and the long run with bigger increases in
the long run. Human capital investment, as measured by schooling enrollment, was also
positively affected by debt relief. Debt reduction had a positive effect on male employment but
not female employment rates. Both GDP per capita growth rates and household consumption
increased with debt reduction.
Our paper contributes to a literature on the effects of debt reduction (see Occhino, 2010;
Afxentiou and Serletis, 1996; Romero-Barrutieta et al., 2015; Haider and Qayyum, 2012;
Cassimon et al., 2015). In particular, our results can be contrasted with the results of two
papers. Romero-Barrutieta et al. (2015) studied debt relief in Uganda over the period
1982-2006 but found that debt relief discouraged investment and incentivized high rates of
consumption and repeated debt accumulation. The authors proposed that donors need to
credibly signal that debt relief will not be offered in the future to ensure that debt relief has
the intended effects of increased investment and decreased debt burdens. Our analysis
extends the analysis to a bigger set of countries and a longer time series.
Cassimon et al. (2015) investigated the effect of the HIPC Initiative and the subsequent
MDRI expansion on the countries in Africa that were HIPCs using data from 1996 to 2011.
They found that the Enhanced HIPC Initiative increased domestic revenue and
investment. The MDRI also increased domestic revenue and investment but to a lesser
degree. Our paper extends this analysis by distinguishing between the decision point
and the completion point. With data through 2016, we are also better able to evaluate the
long-run effects of debt reduction.
In the next section, we describe the data, the empirical strategy, and identifying
assumptions. We report results in Section 3. Concluding remarks are found in Section 4.
Short and long
run effects of
debt reduction
145
JABES
25,1
146
Table I.
Dates each HIPC
reached debt relief
decision point and
completion point
2. Data and empirical strategy
We obtained outcome indicators from the World Bank’s World Development Indicators and
Millennium Development Goals database for over 200 countries from 1980 to 2016.
The main outcome variables we studied were gross fixed capital formation, foreign direct
investment (FDI), adjusted net enrollment rates, employment rates, GDP per capita growth,
and household consumption. Gross fixed capital formation, FDI, and household
consumption are reported as percentages of GDP. The adjusted net enrollment rate is the
percentage of children who are enrolled in primary school out of children in the eligible age
range. The employment rate is the percentage of the population that is employed measured
for the entire population and then by gender.
The dates each HIPC reached the decision point and the completion point are available
from the IMF. The IMF provided the month and year for each landmark point as can be seen
in Table I. Countries’ decision points ranged from 2000 to 2010 while completion points were
spread between 2001 and 2015. Countries could spend as little as 1 year to as long as
14 years between the decision and completion points.
Each HIPC reached the decision point and the completion point independently. There
was also variation in how long each country was in the state between the decision point and
the completion point. We apply a time-shifted difference-in-differences strategy to estimate
HIPCs
Decision point
Completion point
Afghanistan
Benin
Bolivia
Burkina Faso
Burundi
Cameroon
Central African Republic
Chad
Comoros
Democratic Republic of Congo
Republic of Congo
Côte d’Ivoire
Ethiopia
The Gambia
Ghana
Guinea-Bissau
Guyana
Haiti
Honduras
Liberia
Madagascar
Malawi
Mali
Mauritania
Mozambique
Nicaragua
Niger
Rwanda
São Tomé and Príncipe
Senegal
Sierra Leone
Tanzania
Togo
Uganda
Zambia
July 1, 2007
July 1, 2000
February 1, 2000
July 1, 2000
August 1, 2005
October 1, 2000
September 1, 2007
May 1, 2001
July 1, 2010
July 1, 2003
March 1, 2006
March 1, 2009
November 1, 2001
December 1, 2000
February 1, 2002
December 1, 2000
November 1, 2000
November 1, 2006
June 1, 2000
March 1, 2008
December 1, 2000
December 1, 2000
September 1, 2000
February 1, 2000
April 1, 2000
December 1, 2000
December 1, 2000
December 1, 2000
December 1, 2000
June 1, 2000
March 1, 2002
April 1, 2000
November 1, 2008
February 1, 2000
December 1, 2000
January 1, 2010
March 1, 2003
June 1, 2001
April 1, 2002
January 1, 2009
April 1, 2006
June 1, 2009
April 1, 2015
December 1, 2012
July 1, 2010
January 1, 2010
June 1, 2012
April 1, 2004
December 1, 2007
July 1, 2004
December 1, 2010
December 1, 2003
June 1, 2009
April 1, 2005
June 1, 2010
October 1, 2004
August 1, 2003
March 1, 2003
June 1, 2002
September 1, 2001
January 1, 2004
April 1, 2004
April 1, 2005
March 1, 2007
April 1, 2004
December 1, 2006
November 1, 2001
December 1, 2010
May 1, 2000
April 1, 2005
the effect of the debt relief treatments on the different outcomes. The treatment of debt relief
is of course not randomly assigned. The countries that qualified had specific characteristics,
namely massive debt burdens and low development, that led them to need debt relief.
Including country fixed effects controls for those confounding characteristics that are
time-invariant. We also include year fixed effects to control for macro shocks that affect
all countries equally.
The baseline model that we estimate is the following:
Y it ¼ aþ
N
X
bi Countryi þ
T
X
gt Yeart þdCountryi  dt 4 td þuit
(1)
t
i
where Yit is the outcome variable of interest for country i in year t, Countryi is a
dummy variable that is equal to 1 for country i and 0 for every other country; Yeart
is a dummy variable that is equal to 1 for year t and 0 for every other year; d t 4 td is a
time-varying dummy variable that is equal to 1 for each year after the country has
reached the decision point and 0 otherwise; uit is the error term, which is identically
independently distributed normal.
Including all the country dummy variables and the year dummy variables controls for
country fixed effects and year fixed effects. The main coefficient of interest is δ. When
Countryi is an HIPC, then d t 4 td is 1 for every year after that country has reached the
decision point. When Countryi is not an HIPC, then d t 4 td is equal to 0 since the country
never reaches the decision point. The interaction term measures a different time period for
each HIPC, capturing the fact that the treatment was applied to each country independently.
The coefficient δ measures the effect of debt relief on the outcome Y after the decision point.
This period after the decision point averages 14 years in the data set.
HIPCs began receiving debt relief after they reached the decision point, but full debt relief
was not received until they reached the completion point. HIPCs were also working
specifically on poverty reduction strategies and macroeconomic reform after the decision
point in order to qualify for the remaining debt relief. Once HIPCs reached the completion
point, they received debt relief with no further conditions and they also received additional
debt relief under the MDRI. To account for the distinctions between the period after
the decision point – the short-run effect – and the period after the completion point – the
long-run effect – we estimate the following model:
Y it ¼ aþ
N
X
i
bi Countryi þ
T
X
gi Yeart þd1 Countryi  dtc X t 4 td
t
þd2 Countryi  dt 4 tc þuit
(2)
where, d tc X t 4 td is a dummy variable that is equal to 1 for each year when the country is
between the decision point and the completion point; dt 4 tc is a dummy variable that
is equal to 1 for each year after the country has reached the completion point.
This specification teases out the difference between the short-run and the long-run
effects. The coefficient δ1 captures the short-run effect of debt relief that is received between
the decision point and the completion point. The average amount of time each HIPC is in this
between period is four years. The coefficient δ2 captures the long-run effect of debt relief.
The period after the completion point is an average of ten years in the data set.
The original HIPC Initiative required countries to establish a track record of three years
of stable macroeconomic policies to indicate that the resources freed up through debt relief
would be used properly (Andrews et al., 1999). The prior results could be biased if countries
are ramping up certain policies in order to reach the decision point. To investigate this,
Short and long
run effects of
debt reduction
147
JABES
25,1
we also included a three-year window before each HIPC reached the decision point. The
model with the lead up to decision is specified below:
Y it ¼ aþ
N
X
Countryi þ
T
X
Yeart þd0 Countryi  dtdÀ3 X t 4 tc
t
i
þd1 Countryi  dtc X t 4 td þd2 Countryi  d t 4 tc þuit
148
Gross Fixed Capital Formation (% of GDP)
where d tdÀ3 is a dummy variable that is equal to 1 for each of the three years before the
country reaches the decision point. The coefficient δ0 captures whether HIPCs were
changing policies specifically to prepare for the decision point.
We also include regressions with continent instead of country fixed effects and also an
HIPC dummy instead of continent or country fixed effects.
The key identifying assumption for difference-in-difference estimation is parallel trends
of the treatment and control units. This means that the variable of interest for the treatment
countries follows the same time trends as that in the control countries had they not received
debt relief. Each HIPC reached the decision point at different times, ranging from 2000 to
2010. This complicates verifying the assumption since there is not one treatment date
to compare trends before and after. However, 22 out of the 36 HIPCs reached the decision
point in 2000. We can at least visually inspect the time trends before and after this date to
check parallel trends.
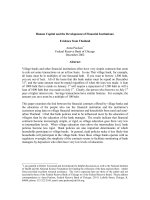
Figure 1 shows the trends of gross fixed capital formation for countries that are HIPCs
and non-HIPCs for the years 1980-2016. The trends track closely prior to 2000. However,
after 2000, there is a sharp increase in gross fixed capital formation for HIPCs. The trends of
the two groups clearly diverge after 2000 with the slope of HIPCs being significantly steeper
than that of non-HIPCs. Remarkably, for the years 2012-2016, HIPCs even had a greater
average gross fixed capital than non-HIPCs. This graph suggests that gross fixed capital
formation was positively affected by debt relief.
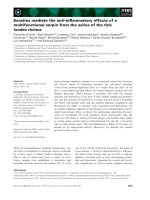
We can also look at gross fixed capital formation averaged over all HIPC countries for
the years relative to the year the country reached the decision point. Presenting the trends of
Figure 1.
Investment rates for
HIPC vs non-HIPC
countries
30
25
20
15
1980
1990
HIPC Countries
2000
Year
2010
Non-HIPC Countries
2020
Gross Fixed Capital Formation (% of GDP)
the outcome variable by relative year for HIPCs provides a visual of how the treatment
affected countries by showing the trends just for HIPCs based on the year relative to
receiving debt relief. Gross fixed capital formation was beginning to increase for HIPCs
leading up to the decision point, but there is an immediate spike in the year directly after the
decision point followed by steep increases. There are undoubtedly sharp increases in capital
investment for HIPCs after receiving debt relief (Figure 2).
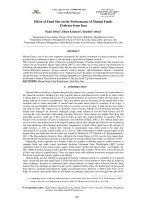
Figure 3 shows the trends in enrollment rates for HIPCs and non-HIPCs. The trends prior
to 2000 satisfy the parallel trends assumption, even though there is slightly more volatility
Short and long
run effects of
debt reduction
149
30
25
20
15
–30
–20
0
–10
Years Relative to Decision Point
10
20
Figure 2.
Investment rates for
HIPC countries before
and after the debt
relief decision point
HIPC Countries
Adjusted Net Enrollment Rate
100
90
80
70
60
50
1980
1990
HIPC Countries
2000
Year
2010
Non-HIPC Countries
2020
Figure 3.
Enrollment
rate of primary
school-aged children
JABES
25,1
150
among HIPCs than non-HIPCs. After 2000, there are large gains in enrollment rates for
HIPCs. These countries clearly deviate from their pre-treatment trends and increase rapidly
until the average enrollment rates equal to that of the non-HIPCs. This suggests that
the Enhanced HIPC Initiative led to an increase in human capital investment and that the
second Millennium Development Goal is being reached.
Figure 4 shows the average adjusted net enrollment rate for HIPCs relative to the year
each country received debt relief. There is an obvious increase in enrollment rates following
the decision point with the sharpest increases occurring within the first few years.
This finding is not that surprising considering each HIPC had to enact a poverty reduction
strategy, which included boosting education, in order to receive debt relief.
3. Results
We report results estimating the effect of debt relief on measures of physical capital
investment, human capital investment, employment, and standard of living.
Investment is broken down into two different measures: gross fixed capital formation
and FDI. Gross fixed capital formation is a measure of physical capital investment. FDI
measures capital investment by other nations into a country’s economy and firms. Myer’s
debt overhang theory suggests that significant outstanding debt discourages both domestic
investment and foreign investment. Theoretically, debt relief should lead to increases in
both gross fixed capital and FDI.
Table II shows the econometric results of debt relief on gross fixed capital formation.
This table is formatted similar to subsequent tables. The first column shows the baseline
results of the effect following the decision point. It controls for country fixed effects and year
fixed effects. The second column estimates the long-run effect as the coefficient on the period
after the completion point. The third column breaks down the baseline effect into the short run
and the long run while also controlling for country fixed effects and year fixed effects.
The short-run period is defined as the time each country is between the decision point and the
completion point. The long-run period is defined as the time following the completion point.
The short run is four years on average and the long run is ten years on average. These effects
Figure 4.
Enrollment rate of
primary school-aged
children in HIPC
countries before and
after the debt relief
decision point
Adjusted Net Enrollment Rate, Primary
100
80
60
40
–30
–20
–10
0
Years Relative to Decision Point
HIPC Countries
10
20
(2)
(3)
(4)
(5)
(6)
(7)
afterdecisionpoint
4.471*** (0.480)
0.434 (0.536)
aftercompletionpoint
5.478*** (0.491) 5.787*** (0.510)
1.844** (0.563)
2.108*** (0.546) 6.753*** (0.593)
betweendecisionandcompletion
1.632* (0.743)
−2.873*** (0.855)
1.884* (0.843)
Constant
34.56*** (0.790) 34.57*** (0.787) 34.56*** (0.787) 25.57*** (0.908)
25.56*** (0.909) 25.63 *** (0.908) 25.86*** (0.740)
Observations
5,691
5,691
5,691
5,691
5,691
5,691
5,691
Notes: Dependent variable is gross fixed capital formation (per cent of GDP). All regressions include year fixed effects. (1) (2) and (3) include country fixed effects; (4) (5)
and (6) include continent dummies; (7) includes dummy for Heavily Indebted Poor Countries (HIPC). Robust standard errors in parentheses. *p o0.05; ***p o0.001
(1)
Short and long
run effects of
debt reduction
151
Table II.
The effect of debt
relief under the
Enhanced HIPC
Initiative and the
MDRI on gross fixed
capital formation
JABES
25,1
152
are compared to the omitted group which are the years before the decision point. The fourth
through sixth columns remove the country fixed effects and include controls for continent.
The excluded continent is Oceania. The seventh column removes the country fixed effects and
includes a dummy for HIPC.
Debt relief positively impacted gross fixed capital formation. When controlling for
country fixed effects, there are many positive, statistically significant results. Gross fixed
capital formation increased by 4.47 percent after countries reached the decision point.
Decomposing the effect into the short run and the long run reveals that the increase is both a
short-run and a long-run phenomenon. While both are positive and significant, the long-run
effect is greater and more significant. Debt relief increased gross fixed capital formation by
1.63 percent in the short run and by 5.79 percent in the long run. Including the three years
leading up to the decision point in the analysis does not change the short-run and long-run
effects. There is no significant effect during those three years, which implies that HIPCs
were not increasing capital investment to prepare for the decision point.
Overall, debt relief under the Enhanced HIPC Initiative and the MDRI increased
investment through gross fixed capital formation. There were short run increases, but
greater effects were seen in the long run. This makes sense given how debt relief was
apportioned. Countries began receiving debt relief once they reached the decision point,
but they received debt relief in full upon reaching the completion point. The MDRI was
activated upon reaching the completion point as well. These results align with the debt
overhang theory. The debt burden was lowered after the decision point and so investment
increased. It was lowered even more after the completion point which led to larger
increases in investment.
Table III shows the results of the impact of debt relief on FDI. The alleviation of the debt
burden via the Enhanced HIPC Initiative and the MDRI increased HIPC’s investment into
their own countries through gross fixed capital formation, but it did not affect foreign
investment. This suggests that the FDI activities are distinct from domestic investment and
could be driven by different considerations.
After physical investment, the next important measure is human capital investment.
Table IV presents the results of debt relief on enrollment rates. When controlling for country
fixed effects, every treatment period indicates significant, positive effects of debt relief on
enrollment rates. There was an increase in the adjusted net enrollment rate for primary
school-aged children of 15.72 percent after countries reached the decision point. There was a
10 percent increase in the enrollment rate in the short run, but an even larger increase of
18.23 percent in the long run.
Enrollment rates for primary school-aged children are impacted positively by debt relief
when controlling for country fixed effects. The effects are larger in the long run at almost
20 percent increases in primary school enrollment. After the completion point, HIPCs have
significantly less debt service and thus have freed up resources that can be spent on
education and increased investment in human capital. This supports a story of debt
crowding out public investment in education. Additionally, increased enrollment rates are
an expected result given that the Enhanced HIPC Initiative required countries to develop
and implement a poverty reduction strategy prior to receiving debt relief. These strategies
often included increased spending on education. These results indicate progress toward the
second Millennium Development Goal of achieving universal education.
To see how debt relief impacted the labor force, we analyzed the effect on the
employment to population ratio. Table V shows the effects of debt relief on the employment
rate. There is a 0.62 percent increase in the total employment rate following the decision
point. Breaking the effects down into short run and long run yields a 0.32 percent increase in
the short run and a 0.78 percent increase in the long run. These results indicate that the total
employment rate increased in the long run following debt relief, but the increases were quite
(2)
(3)
(4)
(5)
(6)
(7)
afterdecisionpoint
0.840 (0.525)
−0.126 (0.493)
aftercompletionpoint
1.140* (0.545)
1.167* (0.593)
0.217 (0.584)
0.303 (0.573)
0.546 (0.696)
betweendecisionandcompletion
0.125 (0.613)
−0.893 (0.679)
−0.502 (0.754)
Constant
290.1* (121.8)
290.1* (121.8)
290.1* (121.8)
0.967 (0.745)
0.968 (0.745)
0.999 (0.747)
1.616*** (0.339)
Observations
5,916
5,916
5,916
5,916
5,916
5,916
5,916
Notes: Dependent variable is foreign direct investment (per cent of GDP). All regressions include year fixed effects. (1) (2) and (3) include country fixed effects; (4) (5) and
(6) include continent dummies; (7) includes dummy for Heavily Indebted Poor Countries (HIPC). Robust standard errors in parentheses. *p o 0.05; ***p o 0.001
(1)
Short and long
run effects of
debt reduction
153
Table III.
The effect of debt
relief on foreign
direct investment
(2)
(3)
(4)
(5)
(6)
154
Table IV.
The effect of debt
relief on primary
school enrollment
(7)
afterdecisionpoint
15.72*** (1.051)
−2.267 (1.206)
aftercompletionpoint
14.58*** (0.958) 18.23*** (1.091)
0.0393 (1.282)
0.993 (1.253) 17.21*** (1.982)
betweendecisionandcompletion
10.01*** (1.311)
−7.931*** (2.046)
8.193** (2.609)
Constant
103.0*** (3.224) 102.6*** (3.417) 102.3*** (3.336) 103.7*** (4.893)
103.0*** (4.578) 103.1*** (4.488) 95.08*** (6.268)
Observations
2,597
2,597
2,597
2,597
2,597
2,597
2,597
Notes: Dependent variable is adjusted net enrollment rate of primary school-aged children. All regressions include year fixed effects. (1) (2) and (3) include country fixed
effects; (4) (5) and (6) include continent dummies; (7) includes dummy for Heavily Indebted Poor Countries (HIPC). Robust standard errors in parentheses. *p o0.05;
**p o0.01; ***p o0.001
(1)
JABES
25,1
(2)
(3)
(4)
(5)
(6)
(7)
afterdecisionpoint
0.618*** (0.140)
9.056*** (0.671)
aftercompletionpoint
0.688*** (0.147) 0.779*** (0.163)
9.389*** (0.801) 8.371*** (0.781)
2.389* (0.961)
betweendecisionandcompletion
0.318* (0.152)
8.375*** (0.878)
1.698 (1.001)
Constant
77.63*** (0.340) 77.62*** (0.340) 76.83*** (0.637) 62.19*** (0.988) 62.23*** (0.984) 61.86*** (0.979) 55.82*** (0.816)
Observations
4,176
4,176
4,176
4,176
4,176
4,176
4,176
Notes: Dependent variable is total employment to population ratio. All regressions include year fixed effects. (1) (2) and (3) include country fixed effects; (4) (5) and (6)
include continent dummies; (7) includes dummy for Heavily Indebted Poor Countries (HIPC). Robust standard errors in parentheses. *po 0.05; ***po 0.001
(1)
Short and long
run effects of
debt reduction
155
Table V.
The effect of debt
relief on employment
JABES
25,1
156
small. Controlling for continents rather than country fixed effects produces larger,
significant increases in the employment rate for each treatment period. Overall, the total
employment to population ratio was positively impacted by debt relief, but the effects were
more clearly seen in the long run.
Table VI shows how the female employment ratio was affected by debt relief. The results
indicate that the female employment rate was unaffected by the debt relief that was
administered under the Enhanced HIPC Initiative and the MDRI. There was no short-run
effect or long-run effect. The third Millennium Development Goal was to promote gender
equality. Even though female employment rates do not fully capture the success or failure of
this goal, they inform its implementation. Debt relief does not appear to have helped HIPCs
reach this goal.
Since there was no effect of debt relief on female employment rates, it must be that the
positive effect found for the entire population is comprised of increased employment for
males. Table VII shows the results of debt relief on the male employment to population ratio.
After the decision point, the male employment rate increased by 0.99 percent. Unlike the
total employment rate, the male employment rate had a significant increase in the short run.
Employment increased by 0.6 percent in the short run and increased by 1.21 percent in the
long run.
To determine whether the impact of debt relief was felt by HIPC populations, we
investigated two standard of living measures: GDP per capita and household consumption.
Table VIII shows the effects of debt relief on GDP per capita growth rates. At the baseline,
there is an increase in GDP per capita growth of 1.95 percent after the decision point.
Investigating further, the effects are realized both in the short run and the long run.
The long-run effects are larger and more significant. GDP per capita growth increased by
1.38 percent in the period between the decision point and the completion point. It increased
by 2.22 percent after the completion point.
Table IX shows the effects of debt relief on household consumption. There is a baseline
effect of an increase in household consumption of 1.87 percent following the decision point.
Decomposing the treatment period into the short run and the long run yields only a
short-run effect. During the period between the decision point and completion point,
household consumption increased by 3.86 percent.
Finally, we perform one falsification exercise considering the effect of debt relief on a
country’s average precipitation. Debt relief should of course have no effect on rainfall.
The results can be seen in Table X. Debt relief under the Enhanced HIPC Initiative and the
MDRI has no impact on average precipitation.
4. Concluding remarks
We investigated the effects of the debt relief that was delivered under the Enhanced HIPC
Initiative and the MDRI. Each HIPC reached the decision point and the completion point at
different times. To account for this variation in treatment dates, we applied a time-shifted
difference-in-differences strategy that allowed the treatment to be country-specific. We
found that debt relief increased gross fixed capital formation, but did not affect FDI. Gross
fixed capital formation increased both in the short run and the long run, but had greater
increases in the long run. This increase in capital investment is in line with debt overhang
theory and is encouraging given that investment is key to long-run growth.
Human capital investment was also positively affected by debt relief under the
Enhanced HIPC Initiative and the MDRI. Adjusted net enrollment rates increased by
almost 20 percent in the long run following debt relief. Debt relief had no effect on female
employment rates, but did positively impact male employment rates, especially in the long
run. Standards of living were improved through increased GDP per capita growth rates
and greater household consumption.
(2)
(3)
(4)
(5)
(6)
(7)
afterdecisionpoint
0.134 (0.184)
11.59*** (1.006)
aftercompletionpoint
0.271 (0.188)
0.248 (0.211)
11.91*** (1.181) 10.58*** (1.150)
2.454 (1.497)
betweendecisionandcompletion
−0.0798 (0.200)
10.93*** (1.357)
2.159 (1.634)
Constant
76.33*** (0.564) 76.34*** (0.562) 75.33*** (0.934) 52.11*** (1.592) 52.47*** (1.587) 51.99*** (1.581) 42.93*** (1.198)
Observations
4,176
4,176
4,176
4,176
4,176
4,176
4,176
Notes: Dependent variable is female employment to population ratio. All regressions include year fixed effects. (1) (2) and (3) include country fixed effects; (4) (5) and (6)
include continent dummies; (7) includes dummy for Heavily Indebted Poor Countries (HIPC). Robust standard errors in parentheses. ***p o0.001
(1)
Short and long
run effects of
debt reduction
157
Table VI.
The effect of debt
relief on female
employment
(2)
(3)
(4)
(5)
(6)
158
Table VII.
The effect of debt
relief on male
employment
(7)
afterdecisionpoint
0.994*** (0.156)
6.466*** (0.490)
aftercompletionpoint
1.035*** (0.165) 1.207*** (0.183)
6.834*** (0.585) 6.139*** (0.574) 2.395*** (0.724)
betweendecisionandcompletion
0.597*** (0.163)
5.714*** (0.659)
1.213 (0.759)
Constant
79.02*** (0.180) 78.99*** (0.179) 78.46*** (0.379) 72.26*** (0.722) 72.00*** (0.719) 71.75*** (0.715) 68.41*** (0.723)
Observations
4,176
4,176
4,176
4,176
4,176
4,176
4,176
Notes: Dependent variable is male employment to population ratio. All regressions include year fixed effects. (1) (2) and (3) include country fixed effects; (4) (5) and (6)
include continent dummies; (7) includes dummy for Heavily Indebted Poor Countries (HIPC). Robust standard errors in parentheses. ***p o0.001
(1)
JABES
25,1
(2)
(3)
(4)
(5)
(6)
(7)
afterdecisionpoint
1.953*** (0.346)
0.573* (0.272)
aftercompletionpoint
1.939*** (0.335)
2.218*** (0.365)
0.866** (0.288)
0.874** (0.278)
2.430*** (0.374)
betweendecisionandcompletion
1.380** (0.492)
−0.0825 (0.441)
1.430** (0.496)
Constant
−8.243 (6.778)
−8.285 (6.774)
−8.206 (6.777)
0.412 (0.662)
0.413 (0.662)
0.415 (0.662)
1.323* (0.608)
Observations
6,484
6,484
6,484
6,484
6,484
6,484
6,484
Notes: Dependent variable is growth of GDP per capita. All regressions include year fixed effects. (1) (2) and (3) include country fixed effects; (4) (5) and (6) include
continent dummies; (7) includes dummy for Heavily Indebted Poor Countries (HIPC). Robust standard errors in parentheses. *p o0.05; **po 0.01; ***po 0.001
(1)
Short and long
run effects of
debt reduction
159
Table VIII.
The effect of debt
relief on growth
(2)
(3)
(4)
(5)
(6)
160
Table IX.
The effect of debt
relief on household
consumption
(7)
afterdecisionpoint
1.870* (0.815)
10.80*** (1.026)
aftercompletionpoint
0.198 (0.816)
0.939 (0.869)
9.500*** (1.107) 8.233*** (1.107)
−0.164 (1.278)
betweendecisionandcompletion
3.859** (1.197)
13.80*** (1.840)
4.738* (1.931)
Constant
83.96*** (1.340) 83.96*** (1.343) 83.95*** (1.339) 67.50*** (1.950) 67.52*** (1.950) 67.13*** (1.941) 63.23*** (1.717)
Observations
5,695
5,695
5,695
5,695
5,695
5,695
5,695
Notes: Dependent variable is household consumption as share of GDP. All regressions include year fixed effects. (1) (2) and (3) include country fixed effects; (4) (5) and (6)
include continent dummies; (7) includes dummy for Heavily Indebted Poor Countries (HIPC). Robust standard errors in parentheses. *p o 0.05; **p o 0.01; ***p o0.001
(1)
JABES
25,1
(2)
(3)
afterdecisionpoint
3.329 (4.766)
aftercompletionpoint
4.455 (4.565)
4.444 (5.115)
betweendecisionandcompletion
−0.0574 (5.001)
Constant
381.2*** (5.531)
674.2*** (5.398)
674.2*** (5.553)
Observations
1,444
1,444
1,444
Notes: Dependent variable is average annual rainfall. All regressions include year and country fixed effects. Robust standard errors in parentheses. ***p o0.001
(1)
Short and long
run effects of
debt reduction
161
Table X.
The effect of debt
relief on precipitation
JABES
25,1
Taken together, these results suggest that a strategy of debt reduction can reduce the
overhang that impedes investments in physical as well as human capital. Reducing the debt
level should thus be an important goal for developing countries. Especially during good
times when revenue is more abundant, governments should prioritize paying down the debt
as a pro-growth development strategy.
162
References
Afxentiou, P.C. and Serletis, A. (1996), “Growth and foreign indebtedness in developing countries: an
empirical study using long-term cross-country data”, Journal of Developing Areas, Vol. 31 No. 1,
pp. 25-40.
Andrews, D., Boote, A.R., Rizavi, S.S. and Singh, S. (1999), “Debt relief for low-income countries: the
enhanced HIPC initiative”, IMF Pamphlet Series No. 51, International Monetary Fund,
Washington, DC.
Cassimon, D., Van Campenhout, B., Ferry, M. and Raffinot, M. (2015), “Africa: out of debt, into fiscal
space? Dynamic fiscal impact of the debt relief initiatives on African Heavily Indebted Poor
Countries (HIPCs)”, International Economics, Vol. 144, December, pp. 29-52.
Haider, A. and Qayyum, U. (2012), “Foreign aid, external debt and economic growth nexus in lowincome countries: the role of institutional quality”, Pakistan Development Review, Vol. 51 No. 4,
pp. 97-115.
Krugman, P. (1988), “Financing vs forgiving a debt overhang”, Journal of Development Economics,
Vol. 29 No. 3, pp. 253-268.
Myers, S.C. (1977), “Determinants of corporate borrowing”, Journal of Financial Economics, Vol. 5 No. 2,
pp. 147-175.
Occhino, F. (2010), “Is debt overhang causing firms to underinvest?”, Federal Reserve Bank of
Cleveland, No. 2010-7, Economic Commentary, July.
Romero-Barrutieta, A., Bulír, A. and Rodríguez-Delgado, J. (2015), “The dynamic implications of debt
relief for low-income countries”, Review of Development Finance, Vol. 5 No. 1, pp. 1-12.
Corresponding author
Pham Hoang Van can be contacted at:
For instructions on how to order reprints of this article, please visit our website:
www.emeraldgrouppublishing.com/licensing/reprints.htm
Or contact us for further details: