Using the ARDL-ECM approach to investigate the nexus between support price and wheat production - An empirical evidence from Pakistan
Bạn đang xem bản rút gọn của tài liệu. Xem và tải ngay bản đầy đủ của tài liệu tại đây (301.24 KB, 14 trang )
The current issue and full text archive of this journal is available on Emerald Insight at:
www.emeraldinsight.com/2515-964X.htm
Using the ARDL-ECM approach
to investigate the nexus
between support price and
wheat production
An empirical evidence from Pakistan
Abbas Ali Chandio and Yuansheng Jiang
Wheat
production
in Pakistan
139
Received 26 October 2018
Revised 11 February 2019
Accepted 1 March 2019
Sichuan Agricultural University – Chengdu Campus, Chengdu, China, and
Abdul Rehman
Research Center of Agricultural-Rural-Peasants, Anhui University, Hefei, China
Abstract
Purpose – The purpose of this paper is to examine the effect of support price on wheat production in
Pakistan during the period 1971–2016.
Design/methodology/approach – To capture the effect of support price on wheat production, the authors
estimated the long-run linkage by using the ARDL bounds testing approach to cointegration.
Findings – This study confirmed the presence of a positive and long-term effect of area under cultivation,
support price and fertilizer consumption on wheat production through ARDL bounds test. The results
showed that both in the long run and short run, support price plays an important role in the enhancement of
wheat production. The authors also found that the coefficients of the area under cultivation and fertilizer
consumption variables were statistically significant and positive both in the long run and short run.
Originality/value – The use of the ARDL approach that examines the long-run and short-run effects of
support price on wheat production in Pakistan makes the current study unique. An emerging economic
literature suggests that only limited research has been conducted in this area.
Keywords Pakistan, ARDL, Support price, Wheat production
Paper type Research paper
1. Introduction
Agriculture sector has a dominant role in the economy of Pakistan and it directly supports the
population of the country. It has about 26 percent contribution to the economic GDP. The
arable land of Pakistan is about 22.45m hectares, out of which 6.34m hectares land is irrigated
with canal water, about 12.52m hectares land is cultivated through tube wells and other water
sources, and remaining 3.59m hectares is not associated with the water (GOP, 2013). Wheat is
considered to be the main staple food in many countries including Pakistan as it is the
important cereal crop and the sustainable production of wheat is the major concern of many
countries (Rehman et al., 2017a, b; Rehman, Jingdong, Kabir and Hussain, 2017). The
Government of Pakistan is still paying attention to improve different varieties of wheat by
providing the agricultural credit support to boost the production (Chandio and Jiang, 2018;
Rehman et al., 2017a, b; Rehman, Jingdong, Kabir and Hussain, 2017). Previous research on
wheat crop in Pakistan has shown that the farmers are deliberate to introduce new varieties to
© Abbas Ali Chandio, Yuansheng Jiang and Abdul Rehman. Published in Journal of Asian Business and
Economic Studies. Published by Emerald Publishing Limited. This article is published under the Creative
Commons Attribution (CC BY 4.0) licence. Anyone may reproduce, distribute, translate and create
derivative works of this article (for both commercial and non-commercial purposes), subject to full
attribution to the original publication and authors. The full terms of this licence may be seen at
/>
Journal of Asian Business and
Economic Studies
Vol. 26 No. 1, 2019
pp. 139-152
Emerald Publishing Limited
2515-964X
DOI 10.1108/JABES-10-2018-0084
JABES
26,1
140
promote cultivation (Iqbal et al., 2002; Chandio and Jiang, 2018). During 1997, about 1m
hectares area was used for the production of wheat crop in the country, which is near about 51
percent of the entire wheat producing region (Smale et al., 2002). Although the production of
wheat has doubled in the past three years, the country has imported a huge quantity of wheat
to meet its rapidly growing population needs. During 2007–2008, the country imported
8.5–15.9 percent wheat (Ahmad and Farooq, 2010). Wheat is the key food crop in Pakistan
because it is widely used as a source of food in everyday life and also a low-cost source of
animal feed (Chandio et al., 2018). In the past several decades, the usage of pesticides and
fertilizers has increased potentially, playing a chief role in many countries to boost the
production of wheat. However, if the cultivated farmland meets the recent climatic potential, it
can also boost the wheat production up to 70 percent, mainly through improved irrigation and
fertilizer (Mueller et al., 2012). Due to huge variations in the geographical conditions and under
comparable climatic conditions, there are vast yield gaps in many countries, indicating
inconsistent increase in wheat yield (Licker et al., 2010; Liu et al., 2007, 2013). In different arid
regions, the rain water harvesting has been practiced successfully to collect to runoff water
and transport it to planting areas (Qiang et al., 2006). The adoption of suitable water
harvesting techniques is required to boost production, and micro-basins can increase the
efficiency of water (Zakaria et al., 2012). When it is covered with the pliable, the wheat grain
production increases by 87 percent (Yazdi et al., 2011). Wheat is the major food source in
Pakistan which is used daily. In Pakistan, a number of researchers such as Hussain et al.
(2012), Buriro et al. (2013), Ahmad et al. (2015), Chandio et al. (2018) and Chandio and Jiang
(2018) have examined the impact of credit on wheat productivity, technical efficiency of wheat
and determinants of the adoption of improved wheat varieties. Thus, this empirical study
differs from earlier studies by attempting to examine the effect of support price and non-price
factors on wheat production in Pakistan over the period 1971–2016 by using the ARDL
approach and to suggest policy guidelines for high wheat production in Pakistan.
2. Existing review of literature
The security of food is the major issue in today’s world. United nation and other international
organizations are very pessimistic about the current food situation in the world. The food
situation is also serious in Pakistan. Wheat and other food prices rise steeply. In addition, the
price rises in the energy, transportation costs, housing, health and education costs also have
eroded this situation and made the lives of poorest segments of society unaffordable (Mahmood,
2008; Niaz, 2008). In the production of wheat crop, the water management strategy for the past
five years has got the attention to increase the production rationalization of irrigation water. In
the study of simulation, the water productivity and wheat crop have improved (Timsina et al.,
2008). The authorization of wheat support prices from the agencies is considered as legal in
Pakistan. The major purpose of announcing support prices or property prices is to limit the price
of bulk commodities so that they should not exceed the distributed support price levels. If the
price exceeds this level, the government is prepared to buy goods that support the price. If the
price is much higher than the target price, the growers sell their output on the open market
(Farooq et al., 2001; Schiff and Valdes, 1992; Thiele, 2003). Wheat is considered to be famous food
crop in Pakistan. However, the invasion of weed is a major bottleneck in increasing wheat yield
and accounts for more than 48 percent of potential wheat yield losses (Khan and Haq, 2002).
Wheat yields may also vary among farmer farms with similar topographical characteristics and
access to various input resources. The main differences in the management practices employed
by these farms are considered to be the major source of variation in the productivity.
Furthermore, it is necessary to identify the technical level of wheat farmers and to identify
important factors for wheat production, as most of the farmers are poorly resourcedeither
they do not have the right knowledge regarding production or cannot follow the production
practices (Ahmad et al., 2002; Hussain et al., 2011). The yield losses are severe when the
resources are limited and crops production occurs simultaneously (Shehzad et al., 2013; Hussain
et al., 2015). The yield of crops decreases when weed competition increases, which results in
strong struggle and competitive pressure on crops (Fahad et al., 2014). The wheat crop which is
considered the traditional crop is planted in the flat basin submerged in the irrigation water.
However, such type of irrigation causes huge water losses. The losses caused by vanishing and
deep seepage exacerbate severe water shortages, which contribute to further groundwater overexploitation. In addition, different methods and techniques are necessary to boost the production
of crops by employing agricultural technology (Rehman et al., 2015, 2017a, b; Rehman, Jingdong,
Kabir and Hussain, 2017). The rain water also plays a vital role in the production of food crops
and about 80 percent of the world agricultural land is associated with it. The agricultural risk of
rainwater feeding is higher on the land receiving rain. Rainfall in semi-arid areas is insufficient
for cash crop growth. Therefore, when rainfall does not meet the crop’s appropriate soil moisture
conditions, supplemental irrigation is used (Oweis, 1999; Oweis and Hachum, 2009). The research
by Chandio et al. (2018) on short-term loan and long-term loan revealed that short-term loans
have high positive effects on wheat production in Pakistan. Similarly, Chandio and Jiang (2018)
suggested that, among other considerations, formal education and farming experience of the
heads of households, access to credit, extension contact, landholding size and tube-well
ownership are the main determinants of the adoption of improved wheat varieties by wheat
farmers in Sindh, Pakistan.
3. Data and methodology
3.1 Data description
The study uses time series data covering the period from 1971 to 2016. Annual time series
data on wheat production in (000 tons), area under cultivation in (000 hectares), support
price in (Pakistani rupees/40 Kg) and fertilizer consumption in (000 N/T) are sourced from
the economic survey of Pakistan (various issues).
3.2 Empirical methodology
The objective of the study is to link wheat production controlling for the effect of support
price, area under cultivation and fertilizer consumption. This association is given in the form
of a long-linear empirical model that can be specified as:
lnWPt ¼ a0 þa1 lnARt þa2 lnSPt þa3 lnFERt þet ;
(1)
where ln represents the natural logarithm; WP denotes the wheat production; AR represents
area under cultivation; SP represents support price; FER represents fertilizer consumption
and et is a standard error term. Following Nwani and Bassey Orie (2016) and Nwani et al.
(2016), the present paper uses the ARDL approach proposed by Pesaran et al. (2001). The
ARDL[1] approach provides some desirable advantages over the other traditional
cointegration approaches like EG[2] and JJCA[3]. On the other hand, these cointegration
approaches require that all variables be integrated into the same order. The ARDL test
process provides effective results, whether the variables are integrated at I(0) or integrated
at I(1) or mutually co-integrated (Pesaran et al., 2001). A small size of observations and
several order of integration of the study variables make ARDL the preferred method of this
study. The equation of an ARDL model is specified as:
DlnWPt ¼ b0 þ
p
X
i¼1
b1i DlnWPtÀi þ
p
X
i¼1
b2i DlnARtÀi þ
p
X
b3i DlnSPtÀi þ
i¼1
þb5 lnWPtÀ1 þb6 lnARtÀ1 þb7 lnSPtÀ1 þb8 lnFERtÀ1 þet ;
p
X
b4i DlnFERtÀi
i¼1
(2)
Wheat
production
in Pakistan
141
JABES
26,1
142
where Δ denotes the difference operator. The test includes the F-test of the joint significance
of the coefficient of lagged variables to verify that there is a long-term linkage among the
variables. The null hypothesis of no long-term association existing among the variables
ðH 0 : b5 ¼ b6 ¼ b7 ¼ b8 ¼ 0Þ is tested following Pesaran et al. (2001). The decision of H 0
can be rejected or accepted is mostly based on the following conditions: If the value of
F-testWupper critical bound (UCB), then reject H 0 and the variables of the study are
co-integrated, if the value of F-testolower critical bound (LCB), then accept H 0 and the
variables of the present study are not co-integrated; however, if value of F-test ⩾ LCB and
⩽ UCB, then the decision is inconclusive. The error correction model (ECM) for the
estimation of the short-run linkages can be formulated as follow:
DlnWPt ¼ b0 þ
p
X
i¼1
þ
p
X
b1i DlnWPtÀi þ
p
X
b2i DlnARtÀi þ
i¼1
p
X
b3i DlnSPtÀi
i¼1
b4i DlnFERtÀi þa1 ECTtÀ1 þet :
(3)
i¼1
The statistically significant and negative sign of ECMtÀ1 coefficient ða1 Þ implies that any
long-run disequilibrium among dependent variables and a number of independent variables
will converge back to the long-term equilibrium association.
4. Empirical results
4.1 Descriptive statistics and correlation analysis
The descriptive statistics indicate that wheat production, area under cultivation, support
price and fertilizer consumption are normally distributed, as indicated by Jarque–Bera
statistics (see Table I). The pair-wise correlations analysis describes that area under
cultivation, support price and fertilizer consumption are positively associated with wheat
production. Area under cultivation and support price are positively correlated with fertilizer
consumption. The positive correlation exists among support price and fertilizer
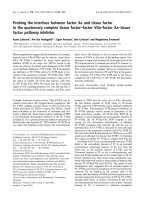
consumption. Trend of the study variables is displayed in Figure 1.
lnWP
lnAR
Mean
9.609112
8.947177
Median
9.675244
8.991450
Max.
10.16504
9.129564
Min.
8.775905
8.665113
SD
0.402775
0.134525
Skewness
−0.431861
−0.712168
Kurtosis
2.092407
2.459323
Jarque–Bera
3.008669
4.448702
Probability
0.222165
0.108138
Sum
442.0191
411.5701
Sum SD
7.300243
0.814363
Observations
46
46
lnWP
1.0000
lnAR
0.6753
1.0000
Table I.
lnSP
0.4674
0.3922
Summary of
lnFER
0.3512
0.2831
descriptive statistics
and correlation matrix Notes: max., maximum; min., minimum; sum SD, sum of SD
lnSP
lnFER
5.063261
4.975000
7.170000
2.900000
1.258271
0.153187
1.970739
2.210384
0.331147
232.9100
71.24601
46
7.476796
7.671923
8.380227
5.646153
0.762955
−0.816312
2.599246
5.416624
0.066649
343.9326
26.19449
46
1.0000
0.1762
1.0000
Fertilizer Consumption
Area Under Wheat Crop
10,000
5,000
9,000
4,000
8,000
3,000
7,000
2,000
6,000
1,000
5,000
Wheat
production
in Pakistan
143
0
1975 1980 1985 1990 1995 2000 2005 2010 2015
1975 1980 1985 1990 1995 2000 2005 2010 2015
Years
Years
Support Price
Wheat Production
1,600
30,000
25,000
1,200
20,000
800
15,000
400
10,000
5,000
0
1975 1980 1985 1990 1995 2000 2005 2010 2015
Years
1975 1980 1985 1990 1995 2000 2005 2010 2015
Years
Notes: Area under wheat crop is measured in (000 hectares); fertilizer consumption is measured
in (“000” nutrient tonnes); support price of wheat crop is measured in (Rs per 40 kg) and wheat
production is measured in (000 tonnes), respectively
4.2 Unit root analysis
This study assesses the long-run linkage between area under cultivation, support price,
fertilizer consumption and wheat production, before applying the ARDL (see Footnote 1)
method; it is a pre-condition to find out the order of integration of the variables. The ARDL
(see Footnote 1) approach can be valid if the series is stationary at I(0) or I(1) or I(0)/I(1) i.e.
integrating order of mixed. The most important assumption of the ARDL (see Footnote 1)
method is that the series must be integrated at I(0) or I(1) if any variable of the study is
integrated at I(2), it is only then the F-test becomes invalid to take decision regarding
the presence of long-run association. Therefore, in this study, we have used two unit root tests,
i.e., ADF[4] and PP[5]. The results of the ADF and P–P unit root tests presented in
Table I reveal that the variables of the study are stationary at different order; while lnWP
and lnFER are integrated at level I(0), other variables such as lnAR and lnSP are integrated
I(1) (Table II).
4.3 Lag length criteria
After checking the unit root test, the next stage is to use the ARDL (see Footnote 1)
approach to check the long-term relationship between the series. It is necessary to choose
the appropriate lag length before applying the ARDL bounds test. In addition, the choice
of lag length should be exercised with caution, as inappropriate lag length can lead to
biased results and cannot be accepted for policy analysis. Consequently, to confirm that
the lag length is chosen appropriately, we use the AIC[6] to illustrate the relative lag
length. The AIC (see Footnote 6) criterion gives robust results and has excellent
performance compared to the SC[7] and HQ[8]. The results are presented in Table III.
We determined that the lag 1 fits our sample size. Moreover, confirmation to choose the
Figure 1.
Trends of the
variables
Table II.
Results of unit
root tests
ADF test (at first difference)
Intercept
Intercept and trend
−3.967858***
−2.270279
−2.604481
−2.499489
P–P test (at level )
Intercept
Intercept and trend
lnWP
−2.463375
−4.017828***
−8.251481***
−8.870495***
−2.248176
lnAR
−1.332634
−2.270279
−8.912218***
−9.043208***
−1.332634
lnSP
−0.438368
−2.584670
−5.905473***
−5.833560***
−0.395604
lnFER
−3.798497***
−2.204039
−6.350330***
−6.238104***
−11.09454***
Notes: **,***Mean the rejection of null hypothesis at 5 and 1 percent levels of significance, respectively
ADF test (at level)
Intercept
Intercept and trend
−11.71264***
−8.912218***
−6.370506***
−6.350913***
−22.57660***
−9.043208***
−6.196696***
−7.963166***
P–P test (at first difference)
Intercept
Intercept and trend
144
Variables
JABES
26,1
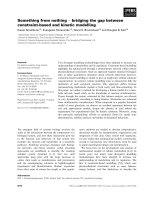
appropriate lag length under the VAR approach has been determined in Figure 2, by
showing the polynomial graph. In this graph, all the blue dots are inside the circle that
confirms that at lag 1, estimations would be applicable to get good outcomes (Table II).
4.4 Bound test approach
This study used the AIC (see Footnote 6) to select the lag length for ARDL approach (proposed
by Pesaran et al., 2001; Narayan and Narayan, 2005). Our findings of the cointegration test based
on the ARDL bounds testing approach are detailed in Table IV. Results reveal that the
calculated F-statistics are 10.270, 4.985 and 5.813, which are greater than UCB at 1 and 5 percent
of significance levels when wheat production, area and fertilizer consumption are used as
dependent variables. The outcomes of bounds test conclude that there are three cointegrating
vectors which validate the presence of long-run linkage between wheat production, area under
cultivation and fertilizer consumption in Pakistan. In addition, this paper also used JJCA (see
Footnote 3) to check the robustness of long-run association. Results in Table V show that there
are two cointegration vectors among wheat production, area under cultivation, support price
and fertilizer consumption, which confirm the robustness of long-run association.
Wheat
production
in Pakistan
145
4.5 Long-run and short-run analysis
This study confirmed the long-run cointegration among wheat production and its
determinant when wheat production is used as the dependent variable. Here, the study has
estimated both long-run and short-run elasticities using Equations (2) and (3). Table VI
demonstrates the long-run and short-run results. For the long-run results (see Table VI,
Panel A), all explanatory variables positively and significantly affected wheat
production. In long run, the impact of area under cultivation on wheat production is
Lag
LogL
LRa
VAR lag order selection criteria
FPEb
AIC
SC
HQ
0
97.01182
na
2.06e-07
−4.043992
−3.884980
−3.984425
1
273.1569
313.9978*
1.96e-10*
−11.00682*
−10.21176*
−10.70899*
2
287.0438
22.33975
2.18e-10
−10.91495
−9.483837
−10.37885
3
298.8304
16.91119
2.73e-10
−10.73176
−8.664596
−9.957385
4
306.9667
10.25880
4.18e-10
−10.38986
−7.686646
−9.377217
Notes: aLR for sequential modified LR test statistic (each test at 5 percent level); bfinal prediction error (FPE).
*Denotes the lag order selected by the criterion
Table III.
Lag order selection
Inverse Roots of AR Characteristic Polynomial
1.5
1.0
0.5
0.0
Figure 2.
Optimal lag selection
criteria under
VAR model in
polynomial graph
–0.5
–1.0
–1.5
–1.5
–1.0
–0.5
0.0
0.5
1.0
1.5
JABES
26,1
146
Table IV.
Results of ARDL
cointegration test
Variable
LnAR
LnSP
LnFER
Optimal lag structure
(1, 0, 0, 0)
(1, 0, 0, 0)
(1, 0, 0, 0)
(1, 0, 1, 0)
F-statistics
10.27062***
4.985628**
1.443394
5.813190***
Critical values (%)
1
5
10
Lower bounds I(0)
4.29
3.23
2.72
Upper bounds I(1)
5.61
4.35
3.77
Diagnostic tests
Statistics
Statistics
Statistics
Statistics
0.500502
0.327235
0.647250
0.434619
R2
2
0.451771
0.261599
0.276862
0.363946
Adj-R
10.2706***
4.9856***
0.2768 (0.1086)
6.1497***
F 2 statistics
3.1647 (0.2054)
0.9235 (0.6301)
1.2705 (0.3298)
0.2116 (0.8995)
χ2 NORMAL
0.6299 (0.6002)
0.2671 (0.7670)
1.8248 (0.1591)
0.2928 (0.7478)
χ2 SERIAL
2
0.0076 (0.9306)
0.2015 (0.8183)
1.7129 (0.1679)
0.0182 (0.8932)
χ ARCH
2
0.9985 (0.4193)
1.0487 (0.3940)
1.6472 (0.1260)
1.1996 (0.3238)
χ White
0.4473 (0.5174)
1.1262 (0.2668)
0.6098 (0.5454)
0.6322 (0.5309)
χ2 RESET
Notes: **,***Denote the probability and the significant levels at 5 and 1 percent, respectively
Null hypo.
Table V.
Results of Johansen
cointegration test
LnWP
Trace test statistic
p-value
Null hypo.
Maximum eigenvalue
p-value
r¼0
60.93311***
0.0019
r¼0
28.37345**
0.0396
r⩽1
32.55966**
0.0234
r⩽1
23.42932**
0.0233
r⩽2
9.130335
0.3535
r⩽2
9.027878
0.2838
r⩽3
0.102456
0.7489
r⩽3
0.102456
0.7489
Notes: r represents the number of cointegrating equation. **,***Show the rejection of the null hypothesis at
5 and 1 percent levels of significance, respectively
Variable
Dependent variable is lnWP: ARDL (1, 0, 0, 0) selected based on AIC
Coefficient
SE
T-ratio
Panel A: long-run estimation
lnAR
lnSP
lnFER
C
Panel B: short-run estimation
ΔlnAR
ΔlnSP
ΔlnFER
ECM (−1)
p-value
0.786398***
0.121680***
0.192283***
0.658034
0.247725
0.015432
0.045670
1.947773
3.174481
7.884982
4.210272
0.337839
0.0028
0.0000
0.0001
0.7372
0.877174***
0.135726***
0.214479***
−1.115432***
0.296747
0.023975
0.054957
0.126128
2.955963
5.661246
3.902636
−8.843661
0.0051
0.0000
0.0003
0.0000
Panel C: residual diagnostic tests
0.985502
R2
0.984088
Adjusted R2
Durbin–Watson stat
1.863229
F-statistic
12.1708***
0.2058 (0.8148)
χ2 SERIAL
3.1647 (0.2054)
χ2 NORMAL
Table VI.
0.0502 (0.9511)
χ2 ARCH
Results of long-run
2
0.7241 (0.7268)
χ White
and short-run
2
0.6688 (0.5074)
coefficients employing χ RESET
Note: ***Significant at 1 percent
the ARDL approach
positive and highly significant. A 1 percent increase in area under cultivation will boost
wheat production by 0.78 percent. Likewise, the support price is positively and significantly
associated with wheat production. It is found that 1 percent increase in support price will
cause 0.12 percent wheat production increase. Similarly, wheat production will enhance by
0.19 percent due to a 1 percent increase in fertilizer consumption. The short-run results
(see Table VI, Panel B) indicate a positive and highly significant effect of area under
cultivation on wheat production. It is noted that a 1 percent increase in area under
cultivation raises 0.87 percent wheat production. Meanwhile, in short-run estimation, the
effect of support price on wheat production is positive and highly significant. The result
reveals 0.13 percent of wheat production boost due to 1 percent increase in support price.
The short-run coefficient of fertilizer consumption indicates that fertilizer consumption has
a significant and positive effect on wheat production. A 1 percent increase in fertilizer
consumption enhances wheat production by 0.21 percent. The empirical findings of this
paper are contradicted with the results carried out in most of the previous studies such as
Bashir et al. (2010), Buriro et al. (2015), Chandio et al. (2016, 2018). Most of these studies in the
past used primary data and OLS regression approach was adopted to analyze the data;
however, this empirical paper used annual time series data over the period 1971–2016 and
followed ARDL approach to cointegration in order to examine the short- and long-run
association in the model with desired variables. The values of R2 and adjusted R2 were
estimated to be 98 percent, which confirms that the model is strongly good fitted. The
calculated F-statistic is 12.1708. The error correction term (ECTt–1) is negative and statistically
significant at 1 percent significance level along with a high coefficient, which reveal that the
disequilibrium can be adjusted to the long-run with higher speed, having any prior-year shock
in the explanatory variables. In earlier studies ( for instance, Narayan and Narayan, 2005;
Qamruzzaman and Jianguo, 2017; Paul, 2014), we performed a model stability test through
several diagnostic tests including Jarque–Bera normality test, LM serial correlation test, white
heteroskedasticity, autoregressive conditional heteroskedasticity test, Ramsey Reset test,
respectively. The results are shown in Table VI (Panel C). The empirical findings of this study
reveal that the ARDL model has passed all the diagnostic tests successfully. Meanwhile, this
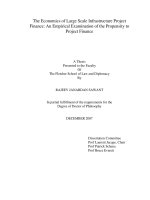
study has conducted two stability tests such as CUSUM[9] and CUSUMSQ[10] to investigate
the stability of long- and short-run parameters. These stability tests have been suggested
by Pesaran and Shin (1999). The graphs of both stability tests presented in
Figures 3 and 4 identify that plots for both stability tests are between critical boundaries
Wheat
production
in Pakistan
147
20
15
10
5
0
–5
–10
–15
–20
1980
1985
1990
CUSUM
1995
2000
2005
5% Significance
2010
2015
Figure 3.
Plot of cumulative
sum of recursive
residuals
JABES
26,1
1.4
1.2
1.0
0.8
0.6
148
0.4
0.2
0.0
–0.2
Figure 4.
Plot of cumulative
sum of squares of
recursive residuals
–0.4
1980
1985
1990
1995
CUSUM of Squares
2000
2005
2010
2015
5% Significance
at 5 percent level of significance. This confirmed the accuracy of long-run and short-run
parameters which have impact on wheat production over the period 1971–2016.
The outcomes of correlogram statistics indicated and confirmed that there is no
autocorrelation and partial correlation in the ARDL model, as the Q-Stat remains statistically
insignificant at 1 and 5 percent of significance levels (see Table VII).
5. Conclusions
This study examined the long-run and short-run effect of support price on wheat production
in Pakistan over the period 1971–2016 by using the ARDL approach proposed by Pesaran
et al. (2001). The order of integration of the study variables is tested by employing ADF and
PP unit root tests. The outcomes reveal that the calculated F-tests in the ARDL bounds
Table VII.
Outcomes of
correlogram statistics
Autocorrelation
Partial correlation
.|.|
.*| . |
.|.|
.*| . |
.*| . |
. |*. |
. |*. |
.*| . |
. |*. |
.*| . |
.*| . |
.|.|
.*| . |
.*| . |
.|.|
.*| . |
.*| . |
.|.|
.|.|
.*| . |
.|.|
.*| . |
.|.|
.*| . |
.*| . |
. |*. |
. |*. |
.*| . |
. |*. |
.*| . |
.|.|
.|.|
**| . |
.|.|
.*| . |
.*| . |
.|.|
.*| . |
.|.|
.*| . |
Lags
AC
PAC
Q-stat
Prob.
1
2
3
4
5
6
7
8
9
10
11
12
13
14
15
16
17
18
19
20
0.027
−0.101
0.045
−0.079
−0.095
0.158
0.097
−0.128
0.183
−0.094
−0.135
−0.010
−0.178
−0.103
−0.050
−0.082
−0.076
0.042
0.010
−0.192
0.027
−0.102
0.051
−0.094
−0.081
0.148
0.079
−0.109
0.193
−0.137
−0.045
−0.059
−0.233
−0.044
−0.165
−0.154
−0.025
−0.081
0.066
−0.181
0.0352
0.5386
0.6403
0.9638
1.4459
2.8027
3.3260
4.2662
6.2231
6.7563
7.8877
7.8942
9.9947
10.715
10.892
11.378
11.817
11.957
11.965
15.076
0.851
0.764
0.887
0.915
0.919
0.833
0.853
0.832
0.717
0.748
0.723
0.793
0.694
0.708
0.760
0.786
0.811
0.849
0.887
0.772
testing approach to cointegration were greater than UCB at 1 and 5 percent of significance
levels, as adopted from Pesaran et al. (2001). Consequently, this empirical study concludes
that all explanatory variables stimulate wheat production in the long run. This study also
observed that the elasticities of area under cultivation, support price and fertilizer
consumption toward wheat production were positively and statistically significant
influenced in both the long-run and the short-run periods. Furthermore, through timely
announcement of support price, being minimum guaranteed price sustained for wheat
before the beginning of planting season, one can ensure that the production of wheat can be
obtained in order to meet the increasing demand of the consumers at different levels like
local, national and international.
Notes
1. The autoregressive distributed lag (ARDL) bounds testing approach of cointegration.
2. See Engle and Granger’s (1987) cointegration approach.
3. See Johansen and Juselius’s (1990) cointegration approach.
4. See augmented Dickey and Fuller (1979).
5. See Phillips and Perron (1988).
6. Akaike information criterion (AIC).
7. Schwarz information criterion (SC).
8. Hannan–Quinn information criterion (HQ).
9. CUSUM the cumulative sum recursive residuals.
10. CUSUMSQ the cumulative of square of recursive residuals.
References
Ahmad, A., Jan, I., Ullah, S. and Pervez, S. (2015), “Impact of agricultural credit on wheat productivity in
District Jhang, Pakistan”, Sarhad Journal of Agriculture, Vol. 31 No. 1, pp. 65-69.
Ahmad, M. and Farooq, U. (2010), “The state of food security in Pakistan: future challenges and coping
strategies”, The Pakistan Development Review, Vol. 49 No. 4, pp. 903-923.
Ahmad, M., Chaudhry, G.M. and Iqbal, M. (2002), “Wheat productivity, efficiency, and sustainability:
a stochastic production frontier analysis”, The Pakistan Development Review, Vol. 41 No. 4,
pp. 643-663.
Bashir, M.K., Mehmood, Y. and Hassan, S. (2010), “Impact of agricultural credit on productivity of
wheat crop: evidence from Lahore, Punjab, Pakistan”, Pakistan Journal of Agricultural Sciences,
Vol. 47 No. 4, pp. 405-409.
Buriro, A., Khooharo, A.A. and Ghulam, T. (2015), “Technical efficiency of rice production Sindh,
Pakistan: a statistical analysis”, Science International, Vol. 27 No. 6, pp. 6225-6230.
Buriro, R.A., Khooharo, A.A., Talpur, G.H and Rajput, M.I. (2013), “Technical efficiency of wheat farming
in Sindh province of Pakistan”, Pakistan Journal of Agriculture, Agricultural Engineering and
Veterinary Sciences, Vol. 29 No. 1, pp. 77-87.
Chandio, A.A. and Jiang, Y. (2018), “Factors influencing the adoption of improved wheat
varieties by rural households in Sindh, Pakistan”, AIMS Agriculture and Food, Vol. 3 No. 3,
pp. 216-228.
Chandio, A.A., Jiang, Y., Joyo, M.A. and Rehman, A. (2016), “Impact of area under cultivation, water
availability, credit disbursement, and fertilizer off-take on wheat production in Pakistan”,
Journal of Applied Environmental and Biological Sciences, Vol. 6 No. 10, pp. 10-18.
Wheat
production
in Pakistan
149
JABES
26,1
150
Chandio, A.A., Jiang, Y., Wei, F. and Guangshun, X. (2018), “Effects of agricultural credit on
wheat productivity of small farms in Sindh, Pakistan: are short-term loans better?”,
Agricultural Finance Review, Vol. 78 No. 5, pp. 592-610, available at: />10.1108/AFR-02-2017-0010
Dickey, D. and Fuller, W. (1979), “Distribution of the estimators for autoregressive time series with a
unit root”, Journal of the American Statistical Association, Vol. 74 No. 366, pp. 427-431.
Engle, R. and Granger, C. (1987), “Cointegration and error correction representation: estimation and
testing”, Econometrica, Vol. 55, pp. 251-276.
Fahad, S., Hussain, S., Saud, S., Hassan, S., Muhammad, H., Shan, D., Chen, C., Wu, C., Xiong, D.,
Khan, S.B., Jan, A., Cui, A. and Huang, J. (2014), “Consequences of narrow crop row spacing and
delayed Echinochloa colona and Trianthema portulacastrum emergence for weed growth and
crop yield loss in maize”, Weed Research, Vol. 54 No. 5, pp. 475-483.
Farooq, U., Young, T., Russell, N. and Iqbal, M. (2001), “The supply response of basmati rice growers in
Punjab, Pakistan: price and non-price determinants”, Journal of International Development,
Vol. 13 No. 2, pp. 227-237.
GOP (2013), “Economic survey of Pakistan 2013-14”, Finance Division, Economic Advisors, Wing,
Islamabad.
Hussain, A., Bashir, A., Anwar, M.Z. and Mehmood, I. (2011), “Agricultural productivity and rural
poverty in the rice-wheat and mixed-cropping zones of the Punjab”, Pakistan Journal of Life and
Social Sciences, Vol. 9 No. 2, pp. 172-178.
Hussain, S., Khaliq, A., Matloob, A., Fahad, S. and Tanveer, A. (2015), “Interference and economic
threshold level of little seed canary grass in wheat under different sowing times”, Environmental
Science and Pollution Research, Vol. 22 No. 1, pp. 441-449.
Hussain, A., Saboor, A., Khan, M.A., Mohsin, A.Q., Hassan, F. and Anwar, M.Z. (2012), “Technical
efficiency of wheat production in Punjab (Pakistan): a cropping zone wise analysis”, Pakistan
Journal of Life and Social Sciences, Vol. 10 No. 2, pp. 130-138.
Iqbal, M., Khan, M.A. and Ahmad, M. (2002), “Adoption of recommended varieties: a farm-level
analysis of wheat growers in irrigated Punjab”, The Pakistan Development Review, Vol. 41 No. 1,
pp. 29-48.
Johansen, S. and Juselius, K. (1990), “Maximum likelihood estimation and inference on cointegration –
with applications to the demand for money”, Oxford Bulletin of Economics and Statistics, Vol. 52
No. 2, pp. 169-210, doi: 10.1111/j.1468-0084.1990.mp52002003.x.
Khan, M. and Haq, N. (2002), “Wheat crop yield loss assessment due to weeds”, Sarhad Journal of
Agriculture, Vol. 18, pp. 449-453.
Licker, R., Johnston, M., Foley, J.A., Barford, C., Kucharik, C.J., Monfreda, C. and Ramankutty, N. (2010),
“Mind the gap: how do climate and agricultural management explain the ‘yield gap’ of croplands
around the world?”, Global Ecology and Biogeography, Vol. 19 No. 6, pp. 769-782.
Liu, J., Williams, J.R., Zehnder, A.J. and Yang, H. (2007), “GEPIC–modelling wheat yield and crop
water productivity with high resolution on a global scale”, Agricultural Systems, Vol. 94 No. 2,
pp. 478-493.
Liu, J., Folberth, C., Yang, H., Röckström, J., Abbaspour, K. and Zehnder, A.J. (2013), “A global and
spatially explicit assessment of climate change impacts on crop production and consumptive
water use”, PLoS One, Vol. 8 No. 2, p. e57750.
Mahmood, J. (2008), “Punjab, Sindh face record food inflation”, The Nation, available at: http://nation.
com.pN/daily/mar-2008/31/index2.php
Mueller, N.D., Gerber, J.S., Johnston, M., Ray, D.K., Ramankutty, N. and Foley, J.A. (2012), “Closing yield
gaps through nutrient and water management”, Nature, Vol. 490 No. 7419, pp. 254-257.
Narayan, S. and Narayan, P.K. (2005), “An empirical analysis of Fiji’s import demand function”, Journal
of Economic Studies, Vol. 32 No. 2, pp. 158-168.
Niaz, S. (2008), “Unaddressed issues in food security”, The Dawn, May 5-11.
Nwani, C. and Orie, J.B. (2016), “Economic growth in oil-exporting countries: do stock market
and banking sector development matter? Evidence from Nigeria”, Cogent Economics & Finance,
Vol. 4 No. 1, pp. 1153872-1153872.
Nwani, C., Iheanacho, E. and Chijioke, O. (2016), “Oil price and the development of financial
intermediation in developing oil-exporting countries: evidence from Nigeria”, Cogent Economics
& Finance, Vol. 4.
Oweis, T. (1999), “Water harvesting and supplemental irrigation for improved water use efficiency in
dry areas”, Vol. 7, IWMI.
Oweis, T. and Hachum, A. (2009), “Optimizing supplemental irrigation: tradeoffs between profitability
and sustainability”, Agricultural Water Management, Vol. 96 No. 3, pp. 511-516.
Paul, B.P. (2014), “Testing export-led growth in Bangladesh: an ARDL bounds test approach”,
International Journal of Trade, Economics and Finance, Vol. 5 No. 1, p. 1.
Pesaran, M.H. and Shin, Y. (1999), “An autoregressive distributed lag modeling approach
to cointegration analysis”, in Strom, S. (Ed.), Chapter 11 in Econometrics and Economic
Theory in the 20th Century: The Ragnar Frisch Centennial Symposium, Cambridge University
Press, Cambridge.
Pesaran, M.H., Shin, Y. and Smith, R.J. (2001), “Bounds testing approaches to the analysis of level
relationships”, Journal of Applied Economics, Vol. 16, pp. 289-326.
Phillips, P.C.B. and Perron, P. (1988), “Testing for a unit root in time series regression”, Biometrika,
Vol. 75, pp. 335-346.
Qamruzzaman, M. and Jianguo, W. (2017), “Financial innovation and economic growth in Bangladesh”,
Financial Innovation, Vol. 3 No. 19, pp. 1-24.
Qiang, Z., Yuanhong, L. and Manjin, C. (2006), “Effect of low-rate irrigation with rainwater harvesting
system on the dry farming”, Proceedings of the 2nd International RWHM Workshop.
Rehman, A., Chandio, A.A., Hussain, I. and Jingdong, L. (2017a), “Fertilizer consumption, water
availability and credit distribution: major factors affecting agricultural productivity in
Pakistan”, Journal of the Saudi Society of Agricultural Sciences, available at: />16/j.jssas.2017.08.002
Rehman, A., Chandio, A.A., Hussain, I. and Jingdong, L. (2017b), “Is credit the devil in the
agriculture? The role of credit in Pakistan’s agricultural sector”, The Journal of Finance
and Data Science, Vol. 3 Nos 1-4, pp. 38-44, available at: />2017.07.001
Rehman, A., Jingdong, L., Kabir, A. and Hussain, I. (2017), “Effects of wheat yield and area under
wheat crop on agricultural GDP in Pakistan: an econometric analysis”, International
Journal of Advanced and Applied Sciences, Vol. 4 No. 6, pp. 137-141, available at:
/>Rehman, A., Jingdong, L., Shahzad, B., Chandio, A.A., Hussain, I., Nabi, G. and Iqbal, M.S. (2015),
“Economic perspectives of major field crops of Pakistan: an empirical study”, Pacific Science
Review B: Humanities and Social Sciences, Vol. 1 No. 3, pp. 145-158, available at: />10.1016/j.psrb.2016.09.002
Schiff, M. and Valdes, A. (1992), “The plundering of agriculture in developing countries”, a study by
World Bank.
Shehzad, M., Tanveer, A., Ayub, M., Mubeen, K., Ibrahim, M., Qadir, I. and Sarwar, N. (2013), “Effect of
weed-crop competition on growth and yield of Garden cress”, Sarhad Journal of Agriculture,
Vol. 29 No. 1, pp. 79-82.
Smale, M., Reynolds, M.P., Warburton, M., Skovmand, B., Trethowan, R.M., Singh, R.P. and
Ortiz-Monasterio, I. (2002), “Dimensions of diversity in modern spring bread wheat in
developing countries from 1965”, Crop Science, Vol. 42 No. 6, pp. 1766-1779.
Thiele, R. (2003), “Price incentives, non-price factors and agricultural production in
Sub-Saharan Africa: a cointegration analysis”, African Development Review, Vol. 15 Nos 2/3,
pp. 425-438.
Wheat
production
in Pakistan
151
JABES
26,1
152
Timsina, J., Godwin, D., Humphreys, E., Kukal, S.S. and Smith, D. (2008), “Evaluation of options for
increasing yield and water productivity of wheat in Punjab, India using the DSSAT-CSMCERES-Wheat model”, Agricultural Water Management, Vol. 95 No. 9, pp. 1099-1110.
Yazdi, J.T., Haghayeghi, A. and Ghodsi, M. (2011), “Rainwater harvesting for supplementary. irrigation
to rainfed crops”, ICID 21st International Congress on Irrigation and Drainage, Tehran, October,
pp. 15-23.
Zakaria, S., Al-Ansari, N., Ezz-Aldeen, M. and Knutsson, S. (2012), “Rain water harvesting at eastern
Sinjar Mountain, Iraq”, Geoscience Research, Vol. 3 No. 2, p. 100.
Further reading
GOP (2012), “Govt. of Pakistan, Pakistan bureau of statistics, ministry of national food security and
research”, Economic Wing, Islamabad.
Hussain, I., Khan, M.A. and Khan, E.A. (2006), “Bread wheat varieties as influenced by different
nitrogen levels”, Journal of Zhejiang University Science B, Vol. 7 No. 1, pp. 70-78.
Pingali, P.L. and Heisey, P.W. (2001), “Cereal-crop productivity in developing countries: past trends and
future prospects”, Agricultural Science Policy: Changing Global Agendas.
Pesaran, H. and Shin, Y. (1998), “Generalized impulse response analysis in linear multivariate models”,
Economics Letters, Vol. 58 No. 1, pp. 17-29.
Corresponding author
Abbas Ali Chandio can be contacted at: ;
For instructions on how to order reprints of this article, please visit our website:
www.emeraldgrouppublishing.com/licensing/reprints.htm
Or contact us for further details: