Nghiên cứu đặc điểm lâm sàng và tình trạng rối loạn đồng bộ thất trái ở bệnh nhân sau nhồi máu cơ tim bằng xạ hình gated SPECT tt tiếng anh
Bạn đang xem bản rút gọn của tài liệu. Xem và tải ngay bản đầy đủ của tài liệu tại đây (395.89 KB, 27 trang )
MINISTRY
OF EDUCATION AND TRAINING
MINISTRY OF
DEFENCE
108 INSTITUTE OF CLINICAL MEDICAL AND
PHARMACEUTICAL SCIENCES
--------------------------------------------------------
NGUYEN THITHANH TRUNG
STUDY OF CLINICAL CHARACTERISTICS AND LEFT
VENTRICULAR DYSSYNCHRONY IN PATIENTS AFTER
ACUTE MYOCARDIAL INFARCTION USING GATED-SPECT
IMAGING
Specialty: INTERNAL CARDIOVASCULAR
CODE: 62.72.01.41
DOCTOR DISSERTATION
Ha Noi - 2020
THIS DISSERTATION WAS COMPLETED AT
108 INTSTITUTE OF CLINICAL MEDICAL AND
PHARMACEUTICAL SCIENCES
Scientific supervisors:
1. Associate Professor. Dr.Le Ngoc Ha
2. Associate Professor. Dr. Pham Thai Giang
Reviewers:
1. Associate Professor. Dr. Dinh Thi Thu Huong
2. Associate Professor. Dr. Luong Cong Thuc
3. Associate Professor. Dr. Tran Van Riep
The dissertation was examined and assessed by Institutional Scientific
Council at 108 Institute of Clinical medical and Pharmaceutical
sciences at ..... on ......, ......
The disse rtation can be found at:
1. National Library
2. Library of 108 Institute
Pharmaceutical sciences
of
Clinical medical and
1
INTRODUCTION
1. Necessity of the study
Left ventricular dyssynchrony is one of the consequences of coronary
artery disease. After early myocardial infarction, 56.0% and 61.0% of
patients had left ventricular dyssynchrony based on evaluation of Tissue
Doppler Imaging. According to Ko (2009), the rate of patients with left
ventricular dyssynchrony after myocardial infarction is generally 32.6%.
Left ventricular dyssynchrony is close ly associated with heart
failure,increasing major adverse cardiovascular events (MACE) as well
as mortality in patients after myocardial infarction. Following 197
patients with myocardial infarction, Pazhenkottil (2011) showed that the
rate of patients with MACE in the group with left ventricular
dyssynchrony was much higher than that in the group without left
ventricular dyssynchrony (62.9% compared with 24.7%) and proved that
left ventricular dyssynchrony is one of the three independent predictors
of MACE.
There have been many methods for assessing left ventricular
dyssynchrony such as: electrocardiogram, Tissue Doppler ultrasound of
cardiac muscle tissue, 3D ultrasound, and myocardial perfusion scan, etc.
in which myocardial perfusion imaging proved to be superior in
assessing left ventricular dyssynchrony by its accuracy and objectivity.
In Vietnam, some studies have applied Gated-SPECT to evaluate
residual myocardial ischemia, myocardial infarction scars, cardiac wall
motion and cardiac function. Several domestic studies published on the
use of electrocardiography, Tissue Doppler ultrasound in evaluating left
ventricular dyssynchrony. However, there have not been any studies to
assess the dyssynchrony performed with myocardial perfusion scan by
Gated-SPECT method with specialized software for analyzing left
ventricular dyssynchronyin patients after myocardial infarction.
Therefore, the study of this issue is controvers ial, scientific and brings
about a lot of benefits for physicians in the prognosis and treatment of
patients after myocardial infarction.
2. Meanings of the study
The use of myocardial perfusion imaging (MPI) in assessing left
ventricular dyssynchrony will help overcome some disadvantages of
Tissue Doppler ultrasound methods. For example, MPI could assess 17
myocardial regions simultaneously including the cardiac apex, whereas
the Tissue Doppler ultrasound can not assess the dyssynchrony at the
heart apex region, and this method has an increase in the unit. This
method of MIP, using degrees to assess, also corrects errors when
2
evaluating patients with different heart rates. In addition, MPI also
assesses the status of residual myocardial ischemia, cardiac wall motion,
heart function, cardiac muscle survival status. Therefore this method
helps clinicians predict and offer better treatments for patients.
3. Objectives of the study
To investigate some clinical, laboratory characteristics and left
ventricular dyssynchrony using Gated-SPECT imaging in patients after
acute myocardial infartion.
To assess the relationship between left ventricular dyssynchrony
on Gated-SPECT imaging and some clinical features, echocardiography
in patients after acute myocardial infarction.
4. Structure of the disse rtation
The dissertation consists of 128 pages (excluding references and
indexes) including 4 main chapters: Introduction: 02 pages, Chapter 1 –
Literature review: 36 pages, Chapter 2 - Subjects and methodology: 19
pages, Chapter 3 –Research results: 32 pages, Chapter 4 - Discussions:
32 pages, Conclusion and recommendations: 03 pages. The dissertation
has 29 tables, 13 schemes and figures, 20 illustration, 157 references
with 17 in Vietnamese and140 in English.
CHAPTER I: LITERATURE REVIEW
1.1. Les ions after myocardial infarction
Myocardial infarction (MI) is a condition when atherosclerosis
blocks the coronary arteries, stop supply of blood and oxygen to the
heart muscle. Although there have been many advances in diagnosis,
treatment and monitoring, myocardial infarction remains a challenging
issue for the health sector. The more patients rescued from acute
myocardial infarction, the more patients have to accompany the post-MI
disorders such as residual myocardial ischemia, left ventricular
remodelling, left ventricular dyssynchrony, arrhythmia, heart failure, reinfarction.
1.2.Cardiac dysynchrony
In cardiology, dyssynchrony is the phenomenon in which the different
parts of the heart contract in a non-rhythmic physiological sequence,
leading to a decrease in ejection efficiency.Left ventricular mechanical
dyssynchrony is the differences in the timing of contraction or relaxation
between different myocardial segments or the contraction of the heart
muscle areas that are delayed in the systole.Mechanical
dyssynchronyusually appears in the late stages of some heart conditions,
associated with hypertrophy and left ventricular dysfunction. Left
3
ventricular mechanical dyssynchrony is particularly common after
myocardial infarction. Left ventricular dyssynchronyreduces the ejection
fraction, aggravates heart failure, and increases myocardial oxygen
demand, increases left ventricular remodelling. The detection of left
ventricular dyssynchrony also plays an important role in the designation
and prognosis of the treatment success of resynchrony.
1.2.1. Methods for evaluating left ventricular dyssynchrony
Routine ECG
This method is simple, easy to implement and can be implemented in all
health facilities. However, it is only possible to assess the electrical
dyssynchrony and does not reflect the mechanical dyssynchrony.
According to the North American Heartbeat Association and the
American Society of Echocardiography when PR≥160 ms, QRS≥120 ms
is considered to have electrical dyssynchrony and this is a criterion for
the selection of patients after MI designated as cardiac resynchronization
therapy (CRT).
M-mode echocardiography
This method can only assess the dyssynchrony of the ventricular
septum and left posterior ventricle by measuring the maximum
difference in time of inoculation of the ventricular septum and left
posterior ventricular wall. When this index is ≥130 ms, it is an indicator
to evaluate intraventricular dyssynchrony.
Tissue Doppler imaging
Pulse-Doppler Ultrasound: This method assesses by measuring
the time interval Ts is the time from the beginning of the QRS complex
to the start of the S wave or to the S wave peak of each region, then
based on the difference in Ts of the myocardial regions, it will evaluate
th level of left ventricular dyssynchrony. If the Ts difference between the
wall and lateral wall is>65 ms, there is a left ventricular dyssynchrony.
Ultrasound Tissue velocity imaging (TVI):In this method, each
cross section will assess simultaneously the movement of two or more
cardiac muscle regions in the same cycle. By visual observation, the time
when the peak velocity of two regions overlap or close to each other is
considered as the opposite two regions contracting synchronously and
vice versa.
Tissue synchronization imaging (TSI):The ultrasound can
automatically calculate the time difference to reach the maximum
systolic wave velocity of the opposite myocardial regions and the 12
myocardial regions as well as the standard deviation of the time to reach
the maximum systolic wave velocity of 12 cardiac muscle regions (Ts -
4
SD) on 3 basic dimentionals and calculate the maximum time difference
of any two cardiac muscle regions. According to Yu,that Ts-SD> 34.4
ms and Ts - Diff> 105 ms were significant in predicting left ventricular
remodelling.
There are also other more modern methods on ultrasound such
as:3D Ultrasound Marker, Real-time 3D Ultrasound Imaging. These
methods are expensive but overcome the limitations of the above
ultrasound methods.
1.3. Left ventricular dyssynchrony assessed by Gated
myocardial perfusion SPECT
Principle: each cardiac cycle is divided into sections (usually 8 or
16 sections) of equal duration referred to as “frames”. The system
records the highest radioactivity count on the perfusion image of each
myocardial region through theframes (or sections in a cycle). The left
ventricle is divided into more than 600 regions, each containing
information about the radioactive counts for each section. Information
obtained from these 600 regions in a section is represented as polar
maps. That is the view of the transverse section of the myocardial axis with the center is the cardiac apex and the border is the base of the
heart.From the radiologica l data that "each region" cardiac muscle
varies by phases, which are “harmonic” in nature, the software
automatica lly uses the Fourier function to estimate the change in
thickness of each region according to the heart cycle duration. These
are expressed as a sinusoidal graph, and help find out when the region's
cardiac musc le begins to contract, which are called the onset of
mechanical contraction (OMC).600 different cardiac muscle regions
will have 600 OMC moments respectively. The software, then, converts
these 600 data into a color-coded polarized map called (phase polar map)
with the center being the heart apex and the periphery being the heart's
bottom. Visually, the picture shows the slow contraction of the heart
muscle (light area). The software also automatically calculates PSD
which is the standard deviation of the OMC phase distribution of more
than 600 cardiac muscle regions. Normally, the heart muscle regions
contract in sync, that is, their OMCs are close together. The OMC set of
these 600 cardiac muscle regions will be close to each other, the graph
has a uniform distribution with a low standard deviation of the OMC
phase distribution (PSD). The larger the PSD, the more different the
OMC of myocardial regions are, the more uneven the distribution of
OMCs is, the more severe the degree of dyssynchrony.Normally, when
the heart muscle regions have synchronized contractions, the OMC of
5
600 myocardial regions will be close to each other, creating a chart with
a high shape, narrow legs, a normal distribution with a deviation index
(Skewness index) close to 0 and the oblique index (Kurtosis index) is
close to 3. In case of dyssynchrony, OMC of different areas are far from
each other and the chart will be low with wide legs. To measure the
oscillation level of OMC between more than 600 regions, the HBW
(Histogram bandwidth) is used as the interval during which 95% of the
myocardial muscle regions begin to contract or the interval containing
95% of the OMC score.
1.4. Studies using Gated-SPECT to evaluate left ventricular
dyssynchrony
1.4.1. International studies
Trimble et al (2006) studied a group of 120 patients with left
ventricular dysfunction, 33 patients with a left bundle branch block, 19
patients with a right bundle branch block and 23 patients with a
pacemaker, compared with 157 healthy subjects in the control group
showed that the average phase standard deviation (PSD) and histogram
bandwidth(HBW) of normal people were 15.7 ± 11.8 and 42.0 ± 28.4,
with Skewness and Kurtosis indices of 4.6 ± 2.4 and 22.4 ± 11.7,
respectively. The study a lso showed a clear difference in these indicators
among patients with left ventricular dysfunction, left bundle branch
block and those in the control group.
Zafrir (2013) studied 787 patients after MI, with an average of
18.3 ± 6.2 months, showing that the PSD index on GSPECT was
significant for predicting mortality in general and cardiovascular death in
particular.
Santiago Aguade et al (2016) studied 408 patients (150 control
groups and disease groups) to find the cut off index to distinguish the
group with dyssynchrony and the normal group with PSD> 18.4º,
HBW> 51º, Skewness ≤ 3.2º, Kurtosis ≤ 9.3º. The study a lso proves the
value of those four indicators in identifying whether a patient has been
identified with cardiac resynchronization therapy(CRT) or not.
1.4.2. Vietnamese studies
Quyen Dang Tuyen (2010) studied left ventricular dyssynchrony
in patients with heart failure by Tissue Doppler ultrasound showed that
the heart failure group had a higher rate and level of dyssynchrony than
the control group and there is a correlation between the degree of
dyssynchrony on Tissue Doppler ultrasound with dyspnea level, QRS
width and e jection fraction.
Mai Hong Son, Le Ngoc Ha (2014) studied 50 patients with
6
coronary artery disease and 30 patients without coronary artery disease
in the control group using GSPECT. Results showed that the
dyssynchrony indexes of HBW and PSD in the disease group were
significantly higher than those in the control group and there was a
correlation between the dyssynchrony index and the width of defect area
and ejection fraction.
Summary of some findings of left ventricular dyssynchrony in patients
after myocardial infarction and some existing problems
Gated-SPECT is an effective tool in the diagnosisof
dyssynchrony.
Dyssynchrony indices on Gated-SPECT have good prognosis for
MACE and mortality in patients after acute myocardial infarction.
In Vietnam, there has not been much research on left ventricular
dyssynchronyby Gated-SPECT and no research has evaluated the
relationship between dyssynchrony on Gate d-SPECT a nd clinica l a nd
ultrasonic synchronous Tissue Doppler imaging.
CHAPTER 2. RESEARCH SUBJECTS AND METHODOLOGY
2.1.
Research subjects
The study was carried out at 108 Military Central Hospital from
October 2014 to December 2018, on a case group of 106 patients after
myocardial infarction and the control group of 34 subjects without
cardiovascular diseases.
Patient selection criteria:
Case group
Having been diagnosed with acute MI (according to World
Health Organization standards - 2012) that have passed the acute phase
for at least 14 days.
Stable clinical condition, hemodynamics, cardiac enzyme tests
returned to normal.
Meeting the criteria for Gated-SPECT imaging according to the
guidelines of the American Society of Nuclear Cardiology 2010.
Control group
No cardiovascular diseases when having clinical examination,
normal results of ECG and echocardiography.
No evidence of myocardial ischemia on myocardial perfusion
imaging: radiation defects in each region <2; SRS <4; SSS <4; total
perfusion deficit <5%.
No branch block.
7
Exclusion criteria:
- Case group or group of patients after MI: those with
mechanical complications after MI, severe arrhythmia, previous history
of cardiovascular diseases, disagreeing to participate in the study, and
bad radiation imaging.
- Control group: those with history of cardiovascular diseases,
disagreeing to participate in the study, contraindication to SPECT
radiography by GSTL and have been taking dipyridamole as instructed
by the American Society of Nuclear Cardiology.
2.2. Methodology:
- This is a hospital-based, descriptive, cross-sectional case-control study.
- Steps to conduct research:
+ All subjects were interviewed and had clinical examination.
+ All subjects were assigned to have basic tests of: pulmonary X-ray, 12lead ECG, bas ic biochemical test, Cardiac Doppler ultrasound to record
basic parameters ofcardiac structure and function including Dd, Ds,
EDV, ESV, and EF.
+ Parameters to evaluate left ventricular dyssynchrony on TSI according
to American Society of Echocardiography (2008):
When the standard deviation of time reaches the maximum
speed of 12 regions in the systole Ts - SD 34.4 ms on TSI, patients
have left ventricular dyssynchrony.
The biggest difference of time to reach the maximum speed of
12 regional systolic is Ts-Diff and when Ts - Diff ≥ 105 ms on TSI,
patients have left ventricular dyssynchrony.
+ The patient had an Electrocardiographically gated myocardial
perfusion SPECT to assess the position, degree of radiation injury, to
calculate a summed rest score (SRS), summed stress score (SSS) and the
difference between the two phases, to assess the viability of myocardial,
structure index and cardiac function including Dd, Ds, EDV, ESV, EF
and parameters to evaluate left ventricular dyssynchrony including
standard deviation the onset of contraction in more than 600 left
ventricular myocardial regions (PSD) andthe interval that 95% of the
myocardial regions begin to contract (HBW).
The indices of evaluating left ventricular dyssynchrony on Gated-SPECT
include:
- PSD: OMC standard deviation of myocardial regions (more than 600
OMC)
- HBW: interval containing 95% of OMC
- HK, HS: Histogram Kurtosus and skewness
8
Assessment of left ventricular dyssynchrony
- The control group had 4 indicators assessed with PSD, HBW, HK,
and HS
- From the mean of PSD and HBW of the control group, we take the
threshold of > +2SD of the control group as the threshold of
dyssynchrony. Thus, the criteria for assessing the dyssynchrony are
when the PSD or HBW exceeds the + 2SD threshold of the control
group.
2.3.Data processing
Data were processed using STATA 14.2 software. Quantitative variables
are expressed as mean (X) and standard deviation (SD), median;
Qualitative variables are expressed as percentages.
2.4. Ethics in research
The study did not violate ethica l regulations when carrying out
biomedica l research.
CHAPTER 3. RESEARCH RESULTS
The study was conducted on 140 subjects including the research group of
106 patients after MI and the control group of 34 people without
cardiovascular diseases. The study subjects were tracked down for at
least 12 months after myocardial infarction in the period from October
2014 and December 2018.
3.1.
Clinical, laboratory characte ristics and left ventricular
dyssynchrony using Gated-SPECT in patients after MI
3.1.1 Clinical and laboratory characteristics of the research group
The mean age of bothrcase group and control group were quite high with
65.4 ± 10.31 and 62.68 ± 6.42, respectively. The highest age in the
research group is 81 years old and the lowest is 49 years old, in the
control group the oldest is 79 years old and the youngest is 53 years old.
Men accounted for higher percentage in the research group with 83.96%
and 16.04%, respectively, compared to 76.47% and 23.53% in the
control group.
The majority of patients had typical chest pain symptoms upon
admission (53.8%), atypica l chest pain accounted for 44.3%, and those
without pain was 1.9%.Patients were assessed of heart failure according
to New York Heart Association (NYHA) classification with mainly
heart failure class II accounting for 52.8%, the rate of severe heart
failure NYHA class III, IV was 30.3%. The number of patients in the
intervention of phase 1was a relatively high with 58.1%, those with
medical treatment was 41.5% and only 0.95% was treated with coronary
artery bypass surgery.
9
The most common risk factors are hypertension (66.98%),
dyslipidemia (28.3%), smoking (33.02%), obesity (26.42%) and diabetes
(24.5%);
Among 106 patients after MI, 61 patients had early coronary
intervention, accounting for 58.1%; 13 patients died during the 12-month
follow-up, accounting for 12.26%.
Inferior wall myocardial infarction accounted for the highest rate
(41.51%), the anterior wall myocardial infarction accounted for 38.68%,
mainly the large anterior MI with 17.92%. The prevalence ò those with
combined MI was 7.55% and the prevalence of patients with Non-Q
wave MI was 8.49% .6 patients after the MI had wide QRS complex of >
120 ms accounting for 5.7%. The prevalence of those with left branch block
was 5.7%.
The mean index of left ventricular systolic volume in the disease
group after MI is larger than that of the control group with 59.4 ± 31.03;
30.6 ± 4.65, respectively. The average index of left ventricular systolic
function in the disease group after MI is lower than that of the control
group with 46.8 ± 14.25; 66.6 ± 5.33, respectively.
On Tissue Doppler imaging (TDI), the average indices of the
standard deviation of time reaches a maximum speed of 12 regions in
the systole Ts - SD12 and the largest difference in time reaches the
maximum speed of 12 systolic regions Ts - Diff12 are 43.2 ± 22.19;
121.8 ± 49.81, respectively. Of which 60 patients had Ts - SD12 ≥ 34.4
accounting for (56.6%) and 64 patients had Ts - Diff 12 ≥ 105 with
60.4%.
3.1.2 Situation of left ventricular dyssynchrony on Gated-SPECT in
the case group
Of the 140 patients studied, we performed Dipyridamole-induced
stress myocardial perfusion scans (MPS) for 140 patients (100%). For
the group of patients after MI, we performed myocardial perfusion scans
at the time point of 15.8 ± 1.05 days after acute MI.
Table 3.10. Comparison of left ventricular dyssynchrony indices on
Gated-SPECT in patients after MI and the control group
Control
Indices
Patients after MI(n =106)
p
group(n =34)
PSD
48.7 ± 19.49
17.5 ± 7.24
<0.05
HBW
154.9 ± 71.97
53.9 ± 15.14
<0.05
Peak
140.3 ± 33.14
135.6 ± 17.36
>0.05
HK
28.7 ± 20.88
23.1 ± 11.91
>0.05
HS
4.2 ± 1.46
4.1 ± 0.95
>0.05
10
The PSD and HBW indices of the patient group after MI are
significantly higher than those of the control group.
Table 3.11. Parameters evaluating left ventricular dyssynchrony on
Gated-SPECT
X +2SD of control group
Group of patients after MI
PSD
31.99
PSD ≥ 31.99
77 %
HBW
84.25
HBW ≥ 84.25
81 %
Peak
170.28
Peak ≥ 170.28
12 %
HK
46.88
HK ≥ 46.88
15 %
HS
6.03
HS ≥ 6.03
7%
When taking the X + 2SD threshold of the control group as the
abnormal threshold, the disease group had 77% of patients with
increasing PSD and 81% of patients with increasing HBW.
Table 3.12. Compatibility of diagnosing LVD between HBW and PSD
PSD
HBW
Positive(≥84.25)
Negative (<84.25)
Total
Compatibility
Positive(PSD
≥31.99)
76
1
77
Po = 0.94
Negative (PSD <31.99)
Total
5
24
29
81
25
106
k = 0.85
p<
0.05
Pe = 0.62
The observed compatibility of diagnosing LVD on GatedSPECT between PSD and HBW is 94.3% (100/106) with Kappa
coefficient of 0.85.
3.2. Relationship of left ventricular dyssynchrony on Gated-SPECT
and some clinical characteristics and echocardiography in patients
after MI
3.2.1. Relationship of left ventricular dyssynchrony on Gated-SPECT
and some clinical characteristics and echocardiography in patients
after MI
Table 3.13. Relationship ofparameters of left ventricular
dyssynchronyon G-SPECT and gender
Female (n =
p
Male (n = 89)
Parameters
17)
(ranksum test)
(X ± SD)
(X ± SD)
PSD (o )
48.4± 19.12
50.4 ± 21.92
>0.05
HBW (o )
155.5 ± 72.91
151.9 ± 68.85
>0.05
11
HS
4.1 ± 1.48
4.6 ± 1.34
>0.05
HK
28.3± 21.66
31.2 ± 16.5
>0.05
Peak
137.9± 33.82
153.1 ± 26.58
0.05
There was no statistically significant difference between the
dyssynchrony parameters on Gated-SPECT imaging between male and
female.
Table 3.14. Relationship of left ventricular dyssynchrony indices by
age
Age group
PSD
HBW
< 50 (n = 6)
54 ± 19.92
163.2± 60.32
50 -59 (n = 26)
53.8 ± 18.97
170.1± 74.93
60 – 69 (n = 31)
51.8± 18.99
176.3± 75.35
≥ 70 (n = 43)
42.6± 19.11
129.3 ± 62.92
p (test for trend)
< 0.05
< 0.05
There are significant differences between the PSD and HBW
indices among age groups.
Table 3.15. Relationship of parameters of left ventricular dyssynchrony
andheart failure
HF (n = 88)
WithoutHF(n = 18)
p
Parameters
(X ± SD)
(X ± SD)
PSD
76.3 ± 15.95
43.8 ± 15.64
<0.05
HBW
241.5 ± 66.43
139.6 ± 61.49
<0.05
HK
36.4 ± 18.66
27.4 ± 21.06
<0.05
HS
4.91 ± 1.37
4.1 ± 1.45
<0.05
Peak
155.3 ± 46.22
137.7 ± 29.8
>0.05
LVD
88 (100%)
13 (72.22%)
<0.05
The indices of evaluating left ventricular dyssynchrony (LVD) on
Gated-SPECT such as PSD, HBW, HS, and HK in the group of patients
with heart failure had higher average values than those in the group of
patients without clinical heart failure.
0
20
1 00
40
sp ect_ psd
60
sp ect_ hbw2
200
80
3 00
400
100
12
1
2
3
4
1
2
3
4
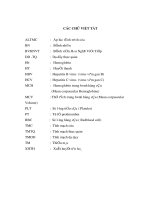
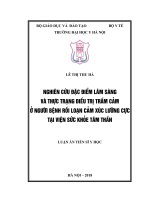
Figure 3.3. HBW and PSD indices according to NYHA heart failure
classification
The indices of HBW, PSD increased significantly with the
severity of heart failure according to NYHA classification.
Table 3.17. Relationship of indices of left ventricular dyssynchrony on
Gated-SPECT and treatment methodsfor patients after MI
Coronary
Internal medical
p
Indices
intervention
treatment
(n = 61) (X ± SD) (n = 44) (X ± SD)
PSD
45.9 ± 17.18
52.9 ± 22.07
< 0.05
HBW
146.9 ± 67.24
167.3 ± 77.69
<0.05
HK
29.9 ± 24.29
27.2 ± 15.4
>0.05
HS
4.2 ± 1.62
4.3 ± 1.25
>0.05
Peak
145.7 ± 34.45
132.9 ± 30.46
< 0.05
*Mann -whitney; **prtest
The value of the PSD and HBW indices in the MI group treated
with coronary artery disease in stage one was significantly lower than
those of the group treated with internal medicine.
3.2.2. Relationship between LVD index and characteristics of GatedSPECT and ultrasound.
Table 3.19. Relationship of PSD, HBW and EF indices on GSPECT
Indices
EF ≤ 40%
EF> 40%.
p*
PSD
66.2 ± 16.19
41.8 ± 16.13
< 0.05
HBW
219.2 ± 61.12
129.6 ± 59.22
< 0.05
13
Patients after myocardial infarction withEF ≤ 40% had a higher
value of PSD and HBW than those with EF> 40%.
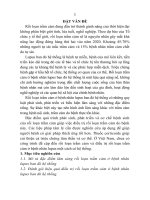
(r =-0.7494, p<0.01)
20
20
40
40
Giá trị s pec t-ef
60
80
Giá trị spect-ef
60
80
100
100
(r =-0.77, p<0.01)
20
40
60
Giá trị spect-psd
Giá trị spect-ef
80
Đường hồi quy
(spect-ef = 76.36 - 0.56*spect-psd, R-square=0.57)
100
0
100
200
G iá trị spect-hbw
Giá trị sspect-ef
300
400
Đường hồi quy
(spect -ef= 70.83 - 0.14*spect-hbw, R-square=0.49)
Figure 3.2. Correlation of EF and PSD and HBW
There is a linear inverse correlation, the degree of tightness
between left ventricular ejection fraction (EF%) and PSD and HBW.
Table 3.21. Relationship between LVD indices and radiation defects on
Gated-SPECT
PSD
HBW
Perfusion point n
Mean
p
Mean
p
41.27 ±
128.66 ±
≤ 13
65
16.57
64.42
SRS
<0.05
<0.05
60.44 ±
196.63 ±
> 13
41
18.09
63.66
40.58 ±
130.52 ±
≤ 13
50
15.95
66.27
SSS
<0.05
<0.05
55.93 ±
176.77 ±
>13
56
19.64
70.35
448.8 ±
145.5 ±
≥7
14
23.17
71.51
SDS
> 0.05
> 0.05
48.7 ±
156.4 ±
<7
92
19.03
72.32
The group of patients with SSS or SRS score>13 had significantly
higher PSD and HBW than patients with SSS or SRS score <13.
Table 3.22. Relationship between LVD indices and defects on GatedSPECT
14
Cardiac muscle condition
p
Reversible defect
Fixed difect
(n = 97)
(n = 62)
PSD
43.2 ± 16.39
55.1 ± 20.99
< 0.05
HBW
138.9 ± 62.56
173.6 ± 78.13
< 0.05
HK
28.7 ± 22.71
28.7 ± 18.76
> 0.05
HS
4.2 ± 1.49
4.2 ± 1.44
> 0.05
Peak
141.1 ± 36.5
139.4 ± 29.09
> 0.05
LVD
41 (42.27%)
62 (100%)
< 0.05
Both the PSD and HBW indices in the group with fixed defect of
cardiac myocardial area were significantly higher than those in the
reversible defect group.
Table 3.23. Relationship of indices to evaluate LVD and left
ventricularend diastolic volume on Gated-SPECT
ESV > 70ml
ESV ≤ 70ml
p (fisher exact)
Indices
(n =25)
(n =81)
o
PSD ( )
67.4 ± 14.03
42.9 ± 17.2
< 0.05
Indices
HBW (o )
218.6 ± 59.3
135.3 ± 63.92
< 0.05
LVD
25 (100%)
57 (70.4%)
< 0.05
The group of patients with ESV>70ml had significantly higher
PSD and HBW values than the group with normal ESV.
(r =0.57, p<0.01)
0
50
Giá trị tsdiff12
100
150
Giá t rị tss d12
50
200
100
250
(r =0.6391, p<0.01)
40
60
Giá trị spect-psd
80
100
0
20
Giá trị tssd12
Đường hồi quy
(tssd12= 13 + 0.62*spect-psd, R-square=0.3)
20
40
60
Giá trị spect-psd
Giá trị tsdiff12
80
Đườn g hồi quy
(tsdiff12= 46 .99 + 1.54*spect-psd, R-square=0.36)
Figure 3.10. Correlation graph between PSD on GSPECT and Ts - SD
12 and Ts - Diff 12 on TSI
100
15
There is a positive linear correlation between the PSD and the
standard deviation of time to reach the maximum speed of 12 regions in
the systolic (Ts - SD 12) (r = 0.57; p <0.01) and Ts -Diff (Ts - Diff 12)
with r = 0.64; p <0.01.
(r =0.5271, p< 0.01)
0
0
50
Gi á tr ị tsdiff12
100
150
Giá trị tssd12
50
200
10 0
250
(r =0.6021, p<0.01)
0
100
200
Gi á trị spect-phbw
Giá trị tssd12
300
Đường hồi quy
(tssd12= 20.5 + 0.15*spect-phbw, R-square=0.23)
400
0
100
200
Giá trị spect-phbw
Giá trị tsdi ff12
300
400
Đường hồi q uy
(tsd iff12 =63 .28 + 0.38*spe ct-phbw, R-square=0.3 )
Figure3.11.Correlation between HBW on GSPECT and Ts - SD 12
and Ts - Diff 12 on TSI
There is a moderate linear positive correlation between the
interval during which 95% of the myocardial region starts contracting or
the interval containing 95% of the OMC score (HBW) with the standard
deviation of time reaching the maximum velocity of 12 inner regions in
systole (Ts - SD 12) with r = 0,5271; p <0.01 and maximum time difference
reaches maximum velocity of 12 Ts-Diff in systole(Ts - Diff 12) with r =
0.6; p <0.01.
Table 3.25. Relationship of LVD parameters on Gated-SPECT and TSI
ultrasound
Ultrasound
` Gated SPECT
Total
Positive
Negative
Positive
64
18
82
Negative
1
23
24
65
41
106
Total
Po = 0.82
Compatibility
k = 0.59
p < 0.05
Pe = 0.56
The observed compatibility for diagnosing left ventricular
dyssynchrony assessed by Gated-SPECT and Tissue Doppler ultrasound
was 87/106 (82.1%); Kappa coefficient equals to 0.59 with p <0.05.
16
0.50
0.00
0.25
Sensitivity
0.75
1.00
3.2.3. Relationship of LVD indices on Gated-SPECT and mortality
complications of patients after MI
Table 3.26. Indices of dyssynchrony and mortality complications
Dead(n = 13)
Alive(n = 93)
p
Indices
(X ± SD)
(X ± SD)
PSD
71.6 ± 19.66
45.5 ± 17.28
< 0.05
HBW
216.9 ± 64.65
146.3 ± 18.1
< 0.05
HK
46.1 ± 30.51
26.3 ± 18.1
< 0.05
HS
5.4 ± 1.8
4.1 ± 1.34
0.05
Peak
157 ± 47.51
137.9 ± 30.23
> 0.05
LVD
13(100%)
69(74.19%)
< 0.05
The indices of assessing left ventricular dyssynchrony on GatedSPECT such as PSD, HBW, HS, and HK in the group of patients with
mortality had higher average indices than those in the group of survivors
after MI.
0.00
0.25
0.50
1-Specificity
0.75
spect_psd R OC area: 0.8284
spect_hbw2 ROC area: 0.7725
spect_hs R OC area: 0.7242
spect_hk ROC area: 0.7477
tdi_tssd12 R OC area: 0.7936
tdi_tsdiff12 ROC area: 0.7622
1.00
Reference
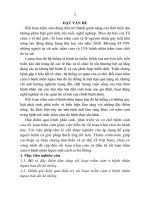
Figure 3.12. ROC curve of LVD index on Gated-SPECT and
ultrasound predicting mortality after MI
PSD and HBW on Gated-SPECT are valid for predicting fatal
complications with large area under the ROC curve from 0.7 to 0.8. HK
and HS also had a lower predictive of fatal complications with an area
under the curve of 0.7. Ts - SD and Ts - Diff on TSI ultrasound are also
predicted to have an area under the ROC curve of above 0.7.
17
Table 3.27. Dyssynchrony indices predicting mortality
CutIndices
AUC
Sensitivity(%)
Specificity(%)
off
PSD
0.8284
53.5
85
68
HBW
0.7725
158.5
85
65
HK
0.7477
31.5
69
75
HS
0.7242
5.8
54
87
TS - SD12
0.7936
47.5
77
73
TS - DIFF12
0.7622
131.5
77
66
0.00
0.0 0
0. 25
0.25
0.50
0. 50
0.75
0.7 5
1.00
1.00
PSD and HBW are very valuable for predicting mortality, with
areas under the AUC curve of 0.83 and 0.77, respectively. The indices of
HK, HS are also valid for predicting mortality but at a lower level.
0
5
analysis time
spect-psd dưới ngưỡn g
10
sp ect-psd trên ngưỡ ng
15
0
5
analysis time
phbw dưới ngưỡng
10
15
phbw trên ngưỡng
Figure 3.13. Kapplan Meier survival curve predicts mortality according to
the PSD and HBW threshold
Patients after MI had PSD of above 53.5 are likely to have fatal
complications than those with PSD of under 53.5. Patients with HBW of
over 158.5 had more fatal complications than patients with HBW of
under 158.5.
18
Table 3.1. Mortality risk according to PSD threshold
PSD thres hold on SPECT
Factors
Total
≥ 53.5
< 53,5
Yes
11
2
13
Dead
No
30
63
93
Total
41
65
106
Risk
0.268
0,031
0.123
Risk ratio(95%CI)
8.72 (2.04 - 37.36)
Patients with PSD of over 53.5 were 8.72 times more likely to
have mortality risk (CI 95% from 2.04 - 37.36) than patients with PSD of
less than 53.5.
Table 3.2. Mortality risk according toHBW threshold
HBW threshold on SPECT
Factors
Total
≥ 158.5
<158.5
Yes
11
2
13
Dead
No
33
60
93
Total
44
62
106
Risk
0.25
0,032
0.123
Risk ratio(95%CI)
7.75 (1.81 - 33.25)
Patients with HBW of over 158.5 were 7.75 times more likely to
mortality risk (CI 95% from 1.81 - 33.25) than patients with HBW of
less than 158.5.
CHAPTER 4. DISCUSSIONS
4.1. Clinical, laboratory characteristics and left ventricular dyssynchrony
using Gated-SPECT in patients after MI
4.1.1. Clinical and laboratory characteristics of the research group
Our study included 106 patients after MI with the mean age of 65.4 ±
10.31 years; 83.96% of whom are men and 34 subjects in the control
group with the mean age of 62.68 ± 6.42 and 76,47% of whom are men.
This meets the requirements set out about the compatibility between the
research group and control group in the disease-control descriptive study.
The gender ratio in our study is s imilar to that of Vu Thi Phuong
Lan (2002) with 85.6% of men. The mean age of patients after MI in our
study was 65.4 ± 10.31, 69.82% of which aged 60 and older, only 5.66%
of patients under 50 years old.
In our study, most patients after MI had symptoms of chest pain
during acute myocardial infarction, accounting for more than 98%,in
which many patients with atypical chest pain accounted for 44.3%.
19
In our study, the majority of patients had an NYHA score of 2 or
higher, half of whom have an NYHA score of 2; one fourth of patients
with NYHA score of 3; 5 patients had NYHA score of 4 at the time of
admission.
After myocardial infarction, there are many risk factors for death
such as heart failure, arrhythmia, recurrent myocardial infarction,old age,
and diabetes etc. In our study, 13 patients died after myocardial infarction,
accounting for 12.26%, the majority of these occurred within 12 months
after myocardial infarction. This rate is quite similar to that of Vu Thi
Phuong Lan's study on patients with myocardial infarction with 16 out of
139 (11.51%) patients died after myocardial infarction during the followup of 20.5 ± 11.18 months but it is lower than the rate in Fudim’sstudy
(2018) that tracked 1310 patients with coronary artery disease for 7 yearswith more than one-third of the patients died.
In our study, 41 patients had anterior myocardial infarction,
accounting for 38.7%, 44 patients with inferior myocardial infarction,
accounting for 41.5% and 8 cases of combined myocardial infarction
(7.6%,) 9 cases had myocardial infarction without Q waves accounting
for 8.49%. Vu Thi Phuong Lan also studiedpatients after MI and her
study shows that the rate of anterior, posterior and combined myocardial
infarction and non-Q myocardial infarction were 50.4%, 33.1% and 7.3
and 9.3%, respectively. Pham Hoan Tien's study showed that 61.4% of
patients had anterior myocardial infarction, 38.6% with posterior
myocardial infarction.
In our study, the group of patients with myocardial infarction
had Dd and Ds of 49.7 ± 6.79 and 33.88 ± 7.84, EDV and ESV of 129.18
± 38.26 ml and 59.42 ± 31.03, much higher than those of the control
group. This result is quite similar to that of Vu Thi Phuong Lan (2012)
with Dd, Ds of 51.2 ± 6.7 and 36.3 ± 7.5 and EDV, ESV of 128.8 ± 39.3
and 59.7 ± 30.7, respectively. Ejection fraction of patients after MI is
significantly lower than that of the control group with p <0.05. The
percentage of patients with ejection fraction EF <50% on ultrasound in
the group of patients after MI is 66.9%. This difference may be due to
patient
characteristics,
severity
of
infarction,
rate
of
earlyrevascularization intervention in the group of patients after MI in
different studies.
In our study, all patients underwent ultrasound TSI to evaluate
dyssynchrony. The results show that mean Ts - SD 12 is 43.16 ± 22.19
ms, mean Ts - Diff 12 is 121.81 ± 49.81 ms. This result is similar to the
study of Alam (2015) in patients after myocardial infarction with values
20
of Ts - SD12 and Ts - Diff 12 were 43.2 ± 19.1ms and 132.8 ± 51.9ms,
respectively. In our study, up to 60 patients (56.6%) had Ts - SD index ≥
34.4ms and 60.4% of patients after MI had Ts - Diff ≥ 105ms.
4.1.2. Situation of left ventricular dyssynchrony on Gated-SPECT in
the research group
The PSD and HBW of the myocardial infarction group were
48.69 ± 19.49 and 154.95 ± 71.97, respectively, which were statistically
higher than the control group of 17.51 ± 7.24 and 53.97 ± 15.1,
respectively.
From the results of the control group, we take the + 2SD limit as
the abnormal threshold for the study group. Thus PSD> 31.99 or HBW>
84.25 means abnormal, patients have left ventricular dysynchrony.
Although we used the + 2SD threshold of the control group as an
abnormal limit for the case group, each study gave different limits.
Pazhenkottil (2011) studied dysynchrony in 202 patients who were
diagnosed or suspected coronary artery disease by myocardial perfusion
imaging, using the diagnostic threshold PSD> 24.4 in men, PSD> 22.3 in
female; HBW> 62.3 in men, HBW> 49.8 in wome, which are considered
to have left ventricular dyssynchrony. Meanwhile, the study of Zafrir et
al (2014) took the threshold of PSD> 40 to diagnose patients with LVD.
When assessing the diagnosis appropriateness level of PSD and
HBW in diagnosing LVD, we found that the observable compatibility
rate was 94.34% (100/106); Kappa coefficient is 0.85, p <0.05.
4.2.
Relationship of LVD on Gated-SPECT and some clinical
characte ristics, echocardiography in patients after MI
4.2.1. Relationship of LVD on Gated-SPECT and some clinical
characteristics, echocardiography in patients after MI
Relationship of LVD and gender, age:
The PSD and HBW of female and male groups did not differ
statistically. Previous studies have shown similar results. Thus, our
research results show that gender has no effect on left ventricular
dyssynchrony after myocardial infarction.
Our research results show that there is no significant difference
between PSD and HBW among age groups (p> 0.05). However, PSD is
highest at the age group of <50 (54 ± 19.92) and lowest at the age group
of >70 (42.59 ± 19.11). HBW is highest at the age group of 60 - 69
(176.27 ± 75.35), lowest at the age group of >70 (129.3 ± 62.92).
LVD and heart failure and NYHA classification
The indices of PSD, HBW, HS, and HK in the group of patients
with heart failure had higher mean values than the group without heart
21
failure group in c linical practice with a statistically significant difference
at p <0.05. Left ventricular dysfunction reduces the efficiency of
myocardial contractility, reduces the ability of myocardial ejection and
thus worsens heart failure. Santos’s study (2014) on 130 patients with
heart failure showed that the dyssynchrony indices in heart failure group
were significantly higher than those in the control group.
In our study, patients at NYHA 3 - 4 with PSD were 64,41 ± 13,37
and 87,60 ± 14,33, significantly higher than NYHA 1 - 2 patients with
PSD are 29.76 ± 10.23 and 43.71 ± 13.87. Similarly, the HBW of NYHA
3 - 4 patients was 221.37 ± 57.07 and 235.60 ± 79.21 was also
significantly higher than the HBW level of NYHA 1 - 2 patients was
89.74 ± 36 , 06 and 136.69 ± 54.80.
LVD and treatment methods
In our study, patients who received arterial intervention in first
stage had a lower PSD and HBW and Peak indices than the group with
Internal medical treatment (p <0.05). The study results suggest the
hypothesis that the early reperfusion intervention helps reduce left
ventricular remodelling as a consequence of dilatation and reduction in
left ventricular systolic function and reduction in the degree of left
ventricular systolic dysfunction in patients after heart attack. This is a
problem that needs further study with a larger number of patients.
4.2.2. Relationship of LVD and Gated-SPECT imaging and
ultrasound characteristics.
In our study, patients with SSS and SRS scores of over 13 all had
significantly higher PSD and HBW scores than those with SSS and SRS
of below 13. Correlation analysis showed that SSS and SRS scores were
both correlated linearly with PSD and HBW at average level. Thus the
more severe myocardial anemia is, the more increasing dyssynchrony
tends to be. A number of previous studies have also shown this.
Both the PSD and HBW indices in the group with fixed defects
were significantly higher than those of the group with reversible defect
group with p <0.05. In our study, 35 out of 106 (33%) patients had severe
defect that wasirreversible due to myocardial infarction scar.The research
results also show that 100% of patients with fixed radiation defects have
left ventricular dysynchrony. In contrast, the rate of LVD was 42.27% in
the group of patients with reversible defect on Gated-SPECT imaging. The
results of the study showed that both PSD and HBW indices in the group
with fixed myocardial defect were significantly higher than those in the
group with reversible defectat p <0.05. Thus,LVD are more common and
more severe in patients with myocardial necrosis and fibrosis after MI.
22
Our study in the group with end-systolic left ventricular volume
(ESV) of over 70 ml had markedly more severe dyssynchrony with a
higher PSD (67.44 ± 14.03 and 42.9 ± 17.2; p <0.05) and higher HBW
(218.64 ± 59.3 and 135.3 ± 63.92; p <0.05). The rate of dyssynchrony in
patients after MI with ESV> 70 ml is 100% while in the ESV group <70
ml, it is only 70.37%. These results are consistent with the
pathophysiology of patietns after myocardial infarction. Murrow (2011)
also demonstrated that HBW is linearly correlated with ESV (r = 0.72, p
<0.001) and EDV (r = 0.63, p = 0.01).
When evaluating the correlation of left ventricular dyssynchrony
with Gated-SPECT and TSI, we found a positive correlation, the average
level of PSD and Ts - SD12 with R = 0.57, of HBW with Ts - SD12 with
r = 0.53. Ts - Diff12 also correlated with PSD and HBW but the
correlation was more closely with r of 0.64 and 0.60 (p <0.01),
respectively. Comparing the ability to evaluate the dyssynchrony
between the two methods shows that Gated-SPECT imaging detected
more patients with left ventricular dyssynchrony (80.2% compared to
61.3%). The observable compatibility for diagnosing left ventricular
dyssynchrony assessed by Gated-SPECT imaging and tissue Doppler
ultrasound was 87 out of 106 (82.1%); kappa coefficient = 0.59 with p
<0.05. Similar results have been shown in many studies.
4.2.3. Relationship of LVD indices on Gated-SPECT imaging and
mortality complications of patients after MI
In our study, a total of 13 patients died (accounting for 12.3%), which
occurred within 12 months after myocardial infarction. This rate is
similar to that of Vu Thi Phuong Lan's study on patients with myocardial
infarction with 11.5% mortality after myocardial infarction during the
mean follow-up of 20.5 ± 11.18 months. Our research results show that
the indices of evaluating left ventricular dyssynchrony on Gated-SPECT
such as PSD, HBW, HS, and HK in mortality group had higher mean
indices than patients survived after MI. The difference was statistically
significant (p <0.05). Of 106 patients after MI, 13 patients (12.3%) died
within the first 1 year after the infarction.
Analysis of the receiver operating characteristic curve, or ROC curve
shows that both PSD and HBW are significant predictors of mortality
with the areas under the curve are 0.83 and 0.77, respectively.
The Kaplan - Meier curve showed that the survival of the group with left
ventricular dyssynchrony and impaired ejection fraction (EF <30%) were
significantly lower than those of the remaining group (p <0.001).
23
Patients with PSDs of over 53.5 are 8.72 times more likely to die
compared to those with PSDs of below 53.5. Patients with HBW aver
158.5 will also be 7.75 times more likely to die within the first year after
myocardial infarction than patients with HBW of below this threshold.
PSDs of over 53.5 have a predictive value of death with sensitivity and
specificity of 85% and 68%, respectively. HBW of over 158.5 has a
predictive value of death with sensitivity and specificity of 85% and
65%, respectively. This result shows that both PSD and HBW indices are
significant in predicting the risk of death after myocardial infarction.
CONCLUSIONS
The study of left ventricular dyssynchrony indices by GatedSPECT method in 106 patients after MI with the mean age of 65.4 ± 10.3
years, 83.9% of whom are men and 34 patients in the control group with
similar mean age and gender, we have some conclusions as follows:
1. Characteristics of LVD in patietns after MI on Gated-SPECT
- PSD and HBW are indicators to evaluate left ventricular
dyssynchrony in patients after MI and there is a clear difference of PSD
and HBW between the case group and control group. The PSD and
HBW of the patients group after MI were 48.7 ± 19.49 and 154.9 ±
71.97, respectively, compared to the corresponding values in the control
group with 17.5 ± 7.24 and 53.9 ± 15.14 (p <0.05), respectively. There
was no significant difference in the indices of HK, HS, Peak in the
patients group after MI compared with the control group (p> 0.05).
- The observed compatibility of diagnosing LVD by GatedSPECT and tissue Doppler ultrasound was 82.1%, Kappa coefficient =
0.59 (p <0.05). There was a moderate positive linear correlation between
PSD and HBW assessed on Gated-SPECT with index (Ts - SD 12) on
TissueDoppler ultrasound (r = 0.57 and r = 0.53; p < 0.01).
- If the threshold of PSD> 31.99 and/ or HBW> 84.25 by GatedSPECT method means abnormal, the rate of patients after MI with LVD
is 77% (according to PSD) and 81% (according to HBW). There was a
positive and close linear correlation between PSD and HBW on
myocardial perfusion imaging (r = 0.94; p <0.01). High observable
compatibility of diagnosing LVD between PSD and HBW is 94.3% with
Kappa coefficient of 0.85 (p <0.05).
2. Relationship of LVD on Gated-SPECT and some clinical
characteristics and echocardiography in patients after myocardial
infarction m
- There is no significant difference in left ventricular
dyssynchrony indices such as PSD, HBW, HK, HS, Peak by age group