Everybody Needs Feedback
Bạn đang xem bản rút gọn của tài liệu. Xem và tải ngay bản đầy đủ của tài liệu tại đây (617.56 KB, 30 trang )
Everybody Needs Feedback
D
evelopers want to write good code. However, their code tends to be worse than they
believe it is. They think their tests cover more cases than they really do, and they believe that
more of the code is exercised than really is. They tend to believe that they understand the code
better than they really do, and they believe they produce fewer bugs than they do.
This is because programmers are by and large healthy optimists. They have to be. Truly
understanding all the details in even a simple program requires years of study and experience,
so they gloss over most of the details.
1
This isn’t some kind of strange, aberrant behavior. Over and over again, psychological
research has shown that normal, happy people believe that they have more control than they
really do. Depressed people seem to have an absolutely accurate view of the control they have
over situations. Does that make them better programmers? Probably not. The depressed tend
to be less creative, and they have a really hard time motivating themselves. On balance, it’s
better to be a healthy and functional human being, even if it leads to objectively unjustified
optimism.
An experienced programmer does, however, tend toward cynicism. Experience hopefully
brings an understanding of one’s faults and shortcomings. It’s not necessary to conquer your
faults, but it is necessary to see them and work with them. The first step is getting the feedback
to understand what those flaws are. A story illustrates this.
Years ago I had a dear girlfriend. She was one of the most brilliant people I’ve ever met.
She was nearing the end of her doctorate in computational molecular virology. (After that, she
headed off to veterinary school.)
There was a problem in her lab. Biochemists label things left and right—centrifuge tubes,
test tubes
, beakers
, E
ppendorf tubes, and so on. Getting anything done in a lab requires a
Sharpie—a kind of indelible magic marker. And someone in her lab was stealing all the Sharpies.
Whenever she needed one, she’d have to go questing for markers, stalling her lab work, and
der
ailing her train of thought.
She railed endlessly to anyone who would listen about the inconsiderate thief who was
stealing all the lab’s Sharpies. She loved venting about it. She couldn’t figure out who it was
either
, which made it all the more mysterious.
233
CHAPTER 8
1. One of my favorite interview questions for system administrators is “Describe what happens when
you type telnet www.google.com.” No matter how deep someone goes, you can always ask more
detailed questions
.
9810ch08.qxd 6/3/08 2:12 PM Page 233
One evening she opened up a desk drawer in her bedroom, and she tossed a pen in.
U
nlike most days, she looked down at the drawer. She broke down laughing, and she brought
me over to look at it. It was full of Sharpies. Tens upon tens, perhaps hundreds of them.
She was the Sharpie thief. Every day she left the lab with two or three Sharpies in her
pants. Every day she returned home, mindlessly opened the drawer, tossed the Sharpies in,
and closed it. (Her organizational instincts were incredible.) She never noticed doing it. With
this discovery, the Sharpies stopped vanishing from the lab.
The moral of this story is that feedback is incredibly important. Without the appropriate
feedback, she might never have realized that she was the source of the problem in the lab.
Without feedback, you often can’t see your own faults.
What do developers need feedback for? Well, developers have their own drawers of
Sharpies. Each person has errors they tend to commit. I double space after periods, and I have
to go back through my documents pulling them out. My editor appreciates that. I also have a
tendency to write overly complicated and general code. I have to strive for simplicity. I have
trouble choosing appropriate names, and my comments often lack enough depth. I tend to be
either too pedantic or not pedantic enough. Sometimes I use tabs by reflex, and my lines tend
to be way over 80 characters long. I tend to miss simple error checks, and I like mock objects
too much. I have to keep an eye out for these things. It’s good to have tools, procedures, and
an environment that help to prevent these from happening.
This chapter looks at several measures of quality. Some are quantitative and some are
qualitative. Among the qualitative measures are coding standards.
Fundamentally, there are two kinds of feedback for development. They are social and
environmental.
Social feedback includes structured criticism through procedures such as code
reviews, and it includes cultural norms such as interpersonal communication patterns and
documentation habits. Rewards are also a kind of explicit social feedback, and I’ll talk a little
bit about them.
Environmental feedback encompasses technological gadgetry. Your project’s tooling
should give you feedback where social feedback fails. It can produce precise, focused, and
immediate feedback on small things:
• IDEs and compilers let you know when code is syntactically broken.
• The source code repository can check for malformed code and refuse to accept
submissions.
• The build system can fail the build when conditions aren’t met, which I’ve already
demonstrated in connection with unit tests in previous chapters.
This is all very important because it affects software quality. Software quality is about
keeping errors down while making the remaining errors easy to find. Put another way, it is
about making software that is easy to maintain without introducing new errors.
There has been a great deal of research into the kinds of errors that developers make.
D
ifferent studies report different results, and it’s hard to come to a firm consensus. Some
consider the hard numbers produced in this area to be highly suspect. Much effort has been
focused on classifying bugs and their relative frequencies, and some general themes have
been revealed.
The scope of most errors appears to be limited. Many are outside the domain of con-
struction. Most are the programmer’s fault, and a lot of those are typos and misspellings.
CHAPTER 8
■
EVERYBODY NEEDS FEEDBACK234
9810ch08.qxd 6/3/08 2:12 PM Page 234
A recurrent theme is failure to understand the problem domain and the design of the software
i
tself. Happily, most errors seem to be easy to fix.
One plausible reason for the difference in quantifiable results between studies is that dif-
ferent environments, both social and technological, lead to different errors. The individuals in
the mix probably contribute, too, so it is important to build on your organization’s experience.
I suspect that collecting per-user and per-group information to build targeted defect profiles
is an area that is ripe for research and/or commercialization.
There are some practices that make errors easy to find. The first of these is an extensive
suite of tests, which I’ve already discussed in previous chapters. Tests provide feedback, but
there is further feedback about the quality of those tests, which is explored here.
Simple design, a core agile practice, focuses on building only the minimal functionality
that allows the program to meet the user’s needs. There are measures that successfully capture
and quantify various aspects of a program’s complexity.
Writing clear code helps to pinpoint errors. Clear code is written with the intention that it
will be read.
2
It focuses on communicating intent to the user, with the computer as a second-
ary concern. Various tools assist in writing clear code. They check conformance with coding
standards and consistency of style.
Stylistic consistency is one of the hallmarks of easily read code. In such code, names are
chosen well, and they are chosen in a way that reflects the underlying system metaphor. Those
names and the choices they embody are propagated throughout the code base. Typographical
conventions are the same throughout, blocks are indented the same way in the same situa-
tions, spaces are added or omitted in the same manner, and so on. These choices are made in
a way that is both simple and self-consistent.
While tools can help with some aspects of these practices, human eyeballs and proce-
dural or cultural practices are often the best ways of helping to achieve these goals. The
problem with tools is determining which aspects of these practices can be measured.
Measuring Software Quality
Measurements give you feedback. Quantitative measures give you precise numbers character-
izing an attribute, while qualitative measures describe the general properties of the subject
you’re studying. They tell you what you have, but not how much of it.
Q
uantitative measures are appealing in that they can often be automated. They tell you a
precise value of a specific attribute, but their specificity limits their utility. The results can be
rendered graphically, making them favorites for management. (There are some people who
fall in love with anything that you put in a spreadsheet.) They invite abuse at times, and in the
wrong hands they render discussion moot, even if there is a point to be discussed.
Qualitative measures are much fuzzier, but they can often lead to greater insight. They are
judgments such as “the code stinks,” or “the style is awful.” They constrain the mind less, and
their contemplation often leads to ideas for quantitativ
e measures. Qualitative measures don’t
lend themselves to automation, so those with a penchant for automation often give them
short shrift.
CHAPTER 8
■
EVERYBODY NEEDS FEEDBACK 235
2. As Tom Welsh (my editor) said, “Indeed, the more successful your code, the more times it will be
read—and by more people.”
9810ch08.qxd 6/3/08 2:12 PM Page 235
Measurements
W
ith any measure, the first question is “What are we trying to measure?” There are several
factors characterizing the measure:
There are
attributes and instruments. The underlying phenomena may be characterized
by attributes that can be measured. Those attributes are determined, and the instruments
of measurement are decided upon.
The instruments’ results must be
reported. A means of storage and presentation must be
decided upon. They may be dumped into a database and analyzed, or they may be spit to
sys.stderr. The means of presentation doesn’t have to be fancy, it just has to be effective.
Often you measure to
effect change. Do the chosen measurements provide effective feed-
back? Do the measurements of code complexity result in less complex code? Does a
measure of test coverage result in better test coverage? Does it tell you where the poor-
quality code resides?
Measurements often have
side effects. Are your programmers now competing to see who
can get the highest cyclomatic complexity number? Are programmers just adding tests to
increase coverage instead of really testing the code? Will this cause the measure to lose its
effectiveness at identifying poor-quality code?
Before you begin measuring, there are some fundamental questions for which the
answers need to be understood:
What is the purpose of the measurement? What are you trying to accomplish? Is this for
your own use, or is it intended to change the way everyone codes? If the measurement is
for your own use, then the variance may be high, and the technique doesn’t need much
justification; you can be sloppy. If the measurement is intended to change the way every-
one codes, then you need to choose a well-understood measure, and you need to do it in
a consistent manner, as you’ll need to justify your choices.
What is the scope? How widely will this measurement be used? The wider it is applied,
the more impact it may have, both through positive control effects and unintended side
effects.
What attributes are being measured? Imprecise ideas about what is being measured are
likely to yield imprecise results.
What ar
e the units
? U
nless y
ou understand the units, you can’t determine how it relates to
other quantifiable values. Measuring an amoeba in feet is nearly useless. Measuring an
elephant in angstroms is meaningless (although it does bring up the interesting question
of wher
e the elephant begins and ends).
What is the v
ariability of the attribute
? U
nless you understand the variability of a meas-
ure, you can’t determine how accurate your measurement is.
What is the measuring instrument? Don’t use a micrometer to measure an elephant. Don’t
use a yardstick to measure an amoeba. Don’t use line counts to measure program com-
plexity. (Don’t use a bathroom scale with an elephant either. It breaks.)
CHAPTER 8
■
EVERYBODY NEEDS FEEDBACK236
9810ch08.qxd 6/3/08 2:12 PM Page 236
What are the units of the instrument? This ties in with the previous question. The units of
t
he instrument must be compatible with the units of the attribute.
What is the reading’s variability? Most instruments are imperfect. They have errors. Net-
work problems cause sampling problems with remote probes. Statistical profilers can
only give approximate usage reports.
How do the measurements and attributes interact? Retrieving page counts from a web
server by making an HTTP connection increases the number of hits. For small, low-traffic
web sites, this could be a problem. Measuring code coverage through execution affects
how quickly tests run. Timing tests might exhibit failures while coverage is being examined.
What are the foreseeable side effects? Are the page hits artificially inflated? Are the timing
tests dying mysteriously? Will reporting cyclomatic complexity result in an obfuscated
code competition? Will reporting code coverage cause code coverage to improve? Will you
be fired for stepping on your boss’s turf?
Quantitative Measurements: How Much Is That
Doggie in the Window?
There are common quantitative measures to which you’ve probably been exposed. These
include the following:
• Test coverage
• Source lines of code (SLOC)
• Cyclomatic complexity
• Churn
• Recorded defect rates
• Development velocity
W
e’ll be looking at three of these in detail: coverage, cyclomatic complexity, and develop-
ment velocity.
Code Coverage
Code coverage is a family of measurements. There are many different kinds of code coverage.
Cem Kaner covers 101 of them in his paper “Software Negligence and Testing Coverage”
(
www.kaner.com/coverage.htm).
With 100 percent statement coverage, all statements in a pro-
gram have been executed. This is not to say that all expressions have been executed. It is also
not the same as saying that all branches have been executed. An if-then-else statement has
been executed even if only the else block has been traversed.
CHAPTER 8
■
EVERYBODY NEEDS FEEDBACK 237
9810ch08.qxd 6/3/08 2:12 PM Page 237
With 100 percent branch coverage, every branch of every statement has been executed. In
a
n if-then-else statement, both the then block and the else block have been traversed. Branch
coverage is a much stronger metric, but it still doesn’t guarantee that all expressions have been
evaluated. In some definitions, a short-circuit logical operator is considered to have been exe-
cuted even if the second operand has never been evaluated.
Branch coverage is appealing in several ways. It is easy to count. In many languages, the
tracing mechanism can be used to obtain this number. It is unambiguous. When you say that
70 percent of statements have been executed, little further explanation is needed. The ease
with which it is explained is part of its appeal. Anyone can grasp it in a moment.
Those factors make branch coverage seductive. There is a temptation to see it as a goal,
but it is not. It is simply a tool, and like any other tool it has limitations.
Branch coverage tells you nothing about data flow. It doesn’t tell you that a variable has
never been initialized, that a constant is returned instead of the value your code spent hours
calculating, or that an invariant value is being rewritten every time a loop is entered.
One hundred percent branch coverage only covers those branches that have been written,
so it doesn’t cover sins of omission. Necessary, but unwritten, code is invisible to this metric.
According to one survey study, these kinds of errors account for between 22 and 54 percent of
all bugs.
3
Weak tests may hit all statements, but they don’t hit them very hard. The tests don’t exer-
cise every predicate in the conditional clauses. Loops are only executed once, and many bugs
don’t occur until they’re executed several times. Default values are modified, and the new
values leak into subsequent calls, but the test framework clears them every time.
Mock objects short-circuit interactions between methods. In Python, they allow complete
isolation, so it’s possible that the real function is never called. Although the statement has
been executed, it hasn’t been executed with real data.
Branch coverage doesn’t report errors that take a while to manifest. It doesn’t catch envi-
ronmental interactions. Table-driven code is inscrutable to branch coverage tools, which miss
all of the embedded logic. They miss any place where work is done in data instead of code,
and branch coverage completely misses the interactions between interrupts and signal
handlers.
With all these problems, why use branch coverage? Because it yields useful information;
but you have to be aware of that information’s limitations. If you have low test coverage, then
y
ou probably have a problem. You should look at where the test coverage is missing, and then
decide if it should be addressed. If it’s old code that’s well debugged and rarely changes, then
it’s probably not worth focusing efforts there. If it’s in highly defective code, or code with a
high chur
n, then it might be worth focusing testing effor
ts there.
What constitutes low test coverage? Below 85 percent is a number that’s bandied about,
but there seems to be little academic basis for it. It may be a number that someone picked out
of a hat at some point and has been r
eferenced ev
er since, like an urban legend.
What is the branch statement coverage of your code? Unless you’re measuring it, you’re
probably overestimating it. Typically, unit tests only cover 50 to 60 percent of the code in a sys-
tem.
Y
ou can pr
obably look at my code and get a feel for the coverage, but when you look at
CHAPTER 8
■
EVERYBODY NEEDS FEEDBACK238
3. Brian Marick, “Faults of Omission,” Software Testing and Quality Engineering Magazine (January,
2000), www.testing.com/writings/omissions.pdf.
9810ch08.qxd 6/3/08 2:12 PM Page 238
your own code your estimate will be too high. People tend to have a blind spot when it comes
t
o their own weaknesses. There is likely to be a moment of shock the first time you wire up one
of the tools described later in this chapter.
Some have an aversion to measurement. There’s not really an excuse for this. Refusing to
measure when you have the tools available means that you are willfully ignorant, but there
are reasons to tread carefully. Measurement has motivational effects, and these effects can be
good or bad. People tend to optimize for anything that they are being judged by. People like
to look busy and productive, so measure and report carefully.
Complexity Measurements
As with code coverage measurements, there are many different kinds of complexity measure-
ments. The example we’ll be wiring up later is called cyclomatic complexity, or McCabe
complexity, developed by Thomas McCabe in 1976. The measure was almost a side effect of
the paper’s larger achievement of defining what an “unstructured program” is. It determines
complexity on a per-function or per-member basis by examining a program’s control flow
graph.
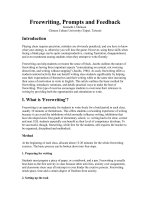
A control flow graph pictorially represents how execution passes through a program. In
these diagrams, statements that don’t affect execution paths are ignored. Only those state-
ments that entail decision points are included. The flow graph for the following program is
shown in Figure 8-1.
def foo(x):
while x > 5:
if x < 2:
print "a"
else:
print "b"
The cyclomatic complexity algorithm adds a link from the end of the program to the
beginning. This is shown as a dotted line in Figure 8-1.
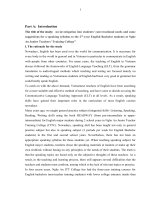
In hard mathematical terms, cyclomatic complexity is the smallest number of linearly
independent paths that it takes to span the flow graph. A set of partial paths span a graph
when ev
ery possible path through the graph can be described using a combination of these
partial paths. A set of paths that span this graph is shown in Figure 8-2. Every path through
this graph can be described by combining these five graphs.
The next par
t of the definition is
linear independence. I
f y
ou
’
ve had a linear algebra class,
this should be familiar. The paths through the graph are linearly independent if there is no
way to combine all of them at the same time in such a way that they cancel each other out.
I
magine that you
’re dropping breadcrumbs as you walk one of the partial graphs. Then
you try walking one of the other paths that connect to this one, and you continue doing this
until you’ve walked through all of the partial paths. If you can pick up all the breadcrumbs
y
ou
dr
opped, then your paths were not linearly independent.
CHAPTER 8
■
EVERYBODY NEEDS FEEDBACK 239
9810ch08.qxd 6/3/08 2:12 PM Page 239
Figure 8-1. The control flow for an if-then-else statement inside a while loop
In Figure 8-2, the three paths on the right (3, 4, and 5) are not linearly independent. You
can walk path 3 and then path 4 dropping breadcrumbs along the way, and you’ll end up at
the beginning. Then you can follow path 5 backward, picking up the breadcrumbs as you go,
and you’ll end up at the beginning having collected all the crumbs.
Figure 8-2. A spanning set that is not linearly independent
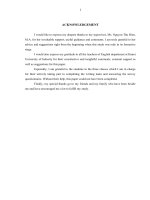
Figure 8-3 shows a linearly independent set of partial paths that span the graph. This is
not the only one possible, but three is the smallest possible number for this graph. No set of
two partial paths can be combined to describe all possible paths, and no complete set of four
CHAPTER 8
■
EVERYBODY NEEDS FEEDBACK240
9810ch08.qxd 6/3/08 2:12 PM Page 240
or more partial paths is linearly independent if it spans the graph. Every closed directed graph
c
an be characterized like this.
Figure 8-3. A linearly independent minimal spanning set
So that’s a description of what cyclomatic complexity really means. It’s how many differ-
ent control flows are in a section of code. You could calculate it by drawing graphs and figuring
out the spanning sets, but there’s a much easier shorthand:
C = 1 + number of decisions
There is always at least one straight line through any graph, so cyclomatic code complex-
ity starts with one. Each decision point adds another possible path. Some constructs add more
than one. Every time a construct is encountered, the complexity index is increased by a speci-
fied amount. A simple calculation might use Table 8-1.
Table 8-1. Sample Scores for Use in Calculating Cylcomatic Code Complexity
Construct Effect Reason
If +1 A decision is made.
Each elif +1 A decision is made.
If-else +1 A decision is made. (A plain If statement has an implicit, but
empty else clause.)
While
+1
A decision is made
.
For +1 A decision is made.
Try +1 Exceptions generate a new flow of control.
First except 0 The first is already accounted for by the try block.
Subsequence excepts +1 A new choice is added.
Finally 0 All paths just rejoin here.
W
ith
0
No control flow is visible to the routine.
Decorators 0 There is no alteration of the program flow.
CHAPTER 8
■
EVERYBODY NEEDS FEEDBACK 241
9810ch08.qxd 6/3/08 2:12 PM Page 241
There is more than one way to derive the cyclomatic complexity for a routine. The differ-
e
nces are based primarily on the control flow graph that is generated. Each logical comparison
in an if-then or while statement can be viewed as generating an alternate condition. This can
potentially result in much higher cyclomatic complexity numbers.
Generally, the lower the cyclomatic complexity, the better. Values in the range of 1 to 5 are
considered to be trivial. Values from 6 to 10 are considered to be low risk. Numbers between 11
and 20 signify moderate risk. Numbers between 21 and 50 are considered high risk. At 50, you
should consider submitting your routine to an obfuscated code contest rather than your
source repository. The word
untestable is often used in this context. These cutoffs are some-
what arbitrary, and as far as I know, there is no basis for their use other than experience and
informed opinion.
Velocity: When Are We Done?
Velocity is a quantitative metric describing how much work a group can accomplish in a given
time. Velocity is the primary measure for capacity estimation in most agile methodologies. It is
most frequently used in development environments with well-defined iterations.
At the beginning of each iteration, the tasks available are placed on a board. Together, all
the developers assign an effort estimate to each task. The estimates come from a small set of
possible choices that correspond to point values. At the end of the iteration, the team sees
how many points of work they’ve completed. The team’s velocity is the number of points com-
pleted divided by the number of days worked.
4
The first time through, the team is flying blind. They can make the estimates, but they
can’t convert those work estimates to time estimates. Velocity provides this conversion.
In successive iterations, the previous velocity measurements are combined to produce
an average velocity, and this value should become more accurate over time. As the accuracy
improves, the team can use this number to reschedule development or drop features as
appropriate.
There are different methods for assigning estimates. Some use raw points, and some map
between a natural language scale and points (e.g., small, medium, large, and that’s-too-big-to-
estimate). No matter what the details, they all use a small set of values, often no more than
four or five.
N
ext, I’ll describe two scales I’ve had direct experience with. One scale uses a raw point
range of 0 to 3. A 0-point job is trivial. A 3-point job should probably be broken into smaller
pieces. The numbers in this scale are not linear—a 2-point job takes much more than twice as
much effort as a 1-point job, and 1-point job takes much more effort than a 0-point job.
Another scale uses the sizes extra small, small, medium, large, and epic. At one end of the
spectrum are extra-small tasks, which are trivial, and at the other end are epic tasks, which are
inestimable and need to be broken down into more manageable chunks. The rationale for
using siz
es rather than point values is that sizes can be mapped to a nonlinear scale, so that
small might be 1 point and large might be 8.
CHAPTER 8
■
EVERYBODY NEEDS FEEDBACK242
4. Here the units are points per day. Always know your units.
9810ch08.qxd 6/3/08 2:12 PM Page 242
The scrum methodology uses direct time estimates in hours, in which no task takes more
t
han a day. All of these can be interchanged to some degree.
These values are purposefully fuzzy. Each group’s definition will be a little different. What
matters is that the team is consistent. Over time, the velocity calculations—whether in points,
effort, or hours—become more accurate. The team works in small enough increments that
daily stand-up meetings and periodic sprint retrospectives give them timely feedback, and
this allows for improvements in estimation.
Qualitative Measurements: It’s a Shih Tzu!
We are capricious beasts, and we are rarely as rational as we’d like to believe. Often, qualitative
measures are the things that truly matter to us. I can have the best job in the world, but some-
thing goes wrong. My manager changes, and nothing else really changes about my job. The
new guy is personable, in fact downright likable. By any measure of wage or work hours, or a
listing of responsibilities, my job has remained the same, but suddenly I hate it. Getting to
work is a chore. I’m constantly stressed. My ability to complete work declines.
Something has changed, but I can’t say what. I can’t measure the cause, but it’s real and it
matters. There has been a qualitative change, and its ruining my job.
IS THAT REALLY A MEASUREMENT?
Somewhere along the line, I was asked if qualitative judgment could really be called a measurement. I have a
background in biochemistry, and I spent a small chunk of my life in a lab. Lab notebooks were full of qualita-
tive measurements like this:
Tube A: Clear
Tube B: Cloudy
Tube C: Kind of murky
Tube D: Completely opaque
Each one of those is a measurement. You’re determining some kind of data and recording it. You can
describe code similarly:
Function A: Terrible code
Function B: Not too bad
Function C:
Pretty good
Function D: Obviously Noah F
riedman
5
So I think it’
s fair to say that readability
,
continuity, and elegance are measurements, even if they don’t
have an obvious numerical representation. It’s the systematic recording that makes something a measurement.
CHAPTER 8
■
EVERYBODY NEEDS FEEDBACK 243
5. Noah Friedman wrote large chunks of Emacs. People who read his code have been known to laugh out
loud with pleasure. My programming skill is measured in millifriedmans.
9810ch08.qxd 6/3/08 2:12 PM Page 243
In the same way, there are many qualitative measures related to software. These are the
t
hings that you feel with your gut. These are the elements of judgment. When you read a pro-
gram listing and you smile at the cleverness and clarity of the bounds checking, that’s a
qualitative judgment. In the same way, the sudden feeling of revulsion when you look at
Bugzilla’s code is also a qualitative judgment. These judgments are the measures of appropri-
ateness of naming, agreement among those names, and elegance of control flow.
Qualitative changes often have quantitative effects. Poor architecture leads to a lower
velocity, as do many other flawed development aspects. One of these is readability. Code that
is hard to read is hard to modify. Code that is inconsistent is harder to read. The need for con-
sistency leads to coding conventions.
Coding Conventions
There are three primary aspects to coding conventions. The typographical standards dictate
the code’s appearance. How many spaces is each block indented? Do spaces bracket the equal
sign in an assignment? How about in a keyword assignment?
Naming conventions determine how names for variables, classes, and methods are cho-
sen. They provide a common grammar and map the system metaphor into the programming
language.
Structural conventions determine how a project is laid out. They determine where data
and documentation can be found, and where the code and tests live. They provide a structure
so that both developers and tools can examine the code base.
Coding conventions supply your project with a common language. They allow you to take
more for granted. You don’t have to decide where a file will go. You only have to decide what
kind of a file it is. The convention supplies the location.
Coding conventions help to transfer knowledge across projects. When multiple projects
share the same conventions, the developers can use each other’s knowledge. They know where
the unit tests are. They know that
ViewInterface names a class rather than a method, and that
view_interface defines a method or variable.
This consistency allows developers to learn new code more quickly.
Naming standards reduce name proliferation. A
linear_transformation could reasonably
be called a
linear_matrix, a linear_transform, a transform, a scaling_matrix, or a rotation.
Choosing one leaves less to remember.
Naming standards can compensate for language weaknesses. Unlike Java, Python doesn’t
provide interfaces as a language feature, but they can be simulated using various techniques.
The standard can declare that classes used as interfaces shall be given names like
FooInterface.
Any time a developer sees
BarInterface, they will know how it is being used. This lets develop-
ers bring along a useful feature from one language to another without formal support in the
new language.
N
aming standards can also emphasize the relationships between items. Declaring that
collections must have plural names, and that each element in a collection must be referred to
by the singular of that collection’s name, instantly gives the user reading a loop a clear idea of
the variables’ relationships.
Almost any convention is better than none. Convention can be understood as a gradient,
and the more that is specified, the less has to be deduced. Conversely, the less that is specified,
the more must be deduced, and each deduction takes time and mental energy. Any reduction
in variety will help.
CHAPTER 8
■
EVERYBODY NEEDS FEEDBACK244
9810ch08.qxd 6/3/08 2:12 PM Page 244