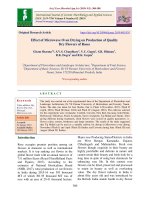
Effect of drip fertigation levels on fruit quality characters of Aonla (Emblica officinalis Gaertn.) cv. NA-7
Bạn đang xem bản rút gọn của tài liệu. Xem và tải ngay bản đầy đủ của tài liệu tại đây (272.47 KB, 7 trang )
Int.J.Curr.Microbiol.App.Sci (2018) 7(10): 2353-2359
International Journal of Current Microbiology and Applied Sciences
ISSN: 2319-7706 Volume 7 Number 10 (2018)
Journal homepage:
Original Research Article
/>
Effect of Drip Fertigation Levels on Fruit Quality Characters of Aonla
(Emblica officinalis Gaertn.) cv. NA-7
P.M. Suresh1*, S. Kumar2, V. Swaminathan3, A. Gurusamy4 and T. Shivakumar5
1
School of Agricultural Sciences, Kalasalingam Academy of Research and Education,
Krishnankoil - 626 126, India
2
(Horticulture) Anbil Dharmalingam Agricultural College and Research Institute, Tamil Nadu
Agricultural University, Tiruchirappalli, India
3
(Horticulture) Horticultural College and Research Institute, Tamil Nadu Agricultural
University, Periyakulam - 625 604, India
4
Department of Agronomy, Agricultural College and Research Institute, Tamil Nadu
Agricultural University, Madurai - 625 104, India
5
Department of Crop Physiology, Tamil Nadu Agricultural University,
Coimbatore - 641 003, India
*Corresponding author
ABSTRACT
Keywords
Aonla, Drip
fertigation and fruit
characters
Article Info
Accepted:
18 September 2018
Available Online:
10 October 2018
Investigations were undertaken to study the influence of drip fertigation levels on fruit
quality characters in aonla was carried out during 2011 to 2013. The experiment was laid
out in randomized block design with eight treatments of fertigation levels, namely 75, 100
and 125% recommended dose of water soluble fertilizers including, soil application
(control) and replicated three times, to test various fruit quality attributes of 8 years aonla
cv. NA.7 grown under drip fertigation. The investigation indicated that 125 %
recommended dose of water soluble fertilizers (T 8) applied through fertigation resulted in
maximum fruit quality characters viz., TSS (13.1 0 Brix and 13.6 0 Brix), Acidity (2.10 %
and 2.15%), Ascorbic acid (575.8mg gand 580.6mg g), Reducing sugar (2.70 % and 3.10
%), Non-Reducing sugar (1.60% and 1.85 %) and Total sugar (4.30% and 4.95%) during
2011-2012 and 2012-2013 respectively. Therefore (T 8) 125 % recommended doses of
NPK in the form of water soluble fertilizers can be suggested for increasing the yield of
eight years old aonla cv. NA.7 significantly.
Introduction
Aonla (Emblica officinalis L. Gaertn) is an
important indigenous emerging fruit crop
owing to its hardiness and ability to withstand
adverse soil and climatic conditions and
belongs to the family Euphorbiceae subfamily
Phyllanthoideae (Arun et al., 2009). It is
originated in tropical South East Asia
particularly South India (Virendra Singh et al.,
2009). It is being cultivated since ancient
times in India. The fruit is highly nutritive for
human consumption. It is the richest source of
vitamin C (600-1300 mg/100g) among the
2353
Int.J.Curr.Microbiol.App.Sci (2018) 7(10): 2353-2359
fruits next to Barbados cherry and also useful
for general improvement of health and
medicinal purpose (Ram Kumar et al., 2011).
Aonla is mainly cultivated in Mayanmar,
Bangladesh, Sri Lanka Iran and Iraq. India
ranks first in the world in aonla area and
production. The area under aonla cultivation
in India is about 77,000 hectares with an
annual production 8, 26,000 tonnes (Anon,
2011). Since the natural ground water
potential is diminishing, many farmers in
India have opted drip irrigation. Through drip
irrigation, fertigation is easier with high
nutrient use efficiency, saving in labour, less
weed infestation besides enhancing the
productivity (Thiyagarajan, 2006).
Aonla responds to applied fertilizers to meet
its nutrient requirements. Through fertigation
methods, nutrients are added to the soil in
adequate doses and interval through which
qualitative improvement of produce can also
be attained to a larger extent. Production of
quality fruits in aonla will enable the farmers
to earn more income. In Tamil Nadu, a dose of
200:500:200 g NPK tree-1year-1 is generally
recommended (TNAU) for aonla.
This study was aimed to evaluate the
fertigation system involving drip irrigation
methods; various levels of fertilizers with a
comparison on the farmers practice (surface
irrigation + soil application of RDF) on leaf
NPK and yield per tree of aonla
on growth, yield and quality of aonla. The
details of materials used T1-Surface Irrigation
with soil application of 100% RDF (Control),
T2-Drip Irrigation with soil application of 100
% RDF T3-Drip Fertigation of 75% RDF as
Commercial Fertilizers, T4-Drip Fertigation of
100 % RDF as Commercial Fertilizers, T5Drip Fertigation of 125% RDF as Commercial
Fertilizers T6-Drip Fertigation of 75% RDF as
Water Soluble Fertilizers (WSF), T7-Drip
Fertigation of 100% RDF as Water Soluble
Fertilizers (WSF) T8- Drip Fertigation of 125%
RDF as Water Soluble Fertilizers (WSF). All
other recommended package of practices were
followed to raise the crop as per the Crop
Production Techniques of Horticultural Crops
(2012).
For the treatment T1-Soil application with
surface irrigation was done in two split doses
during April and September. For the treatment
T2-Soil application with drip irrigation was
done in two split doses during April and
September. For drip fertigation treatments (T3T5) P was applied as basal through SSP, N and
K were injected at weekly in equal splits. For
drip fertigation treatments (T6- T8) the WSF
namely MAP, SOP and Urea were injected at
weekly intervals in equal splits (52 weeks).
RDF: 200:500:200 g NPK/tree/year.
Results and Discussion
Effect of drip
parameters
fertigation
on
quality
Materials and Methods
A field experiment was conducted at the
Department of Horticulture, Agricultural
College and Research Institute, Tamil Nadu
Agricultural University, Madurai during the
year 2011-12 and 2012-13. The research
experiment conducted at College Model
Orchard was aimed to standardize the
fertigation schedule for aonla, to study the
effect of fertigation with N, P and K fertilizers
In any production system, the primary goal is
to achieve the highest fruit yield per unit area
with optimum fruit quality. In aonla, the
quality is mainly judged by total soluble solids
(TSS), total sugars, acidity and ascorbic acid
content in fruits. Application of nutrients,
either through soil (or) fertigation, has made a
remarkable effect on fruit quality as observed
by Syamal and Mishra (1988), Suriyapananant
(1992) and Shah et al., (2002).
2354
Int.J.Curr.Microbiol.App.Sci (2018) 7(10): 2353-2359
Total Soluble Solids
The total soluble solid content was
significantly differed among the treatments.
This increased by application of 125 per cent
RDF through fertigation (13.1 and 13.6 oBrix)
followed by 100 per cent RDF through
fertigation (12.6 and 13.2 oBrix) during 20112012 to 2012 -2013 respectively. The lowest
total soluble solid content was recorded in
control i.e. 6.5 and 7.0 oBrix in 2011-2012 to
2012 -2013 respectively.
Pooled Mean total soluble solid content was
the highest due to 125 per cent RDF through
fertigation (T8) (13.34 oBrix) and it was
followed by 100 per cent RDF through
fertigation (T7) (12.90o Brix). The lowest total
soluble solid (6.75 o Brix) was recorded in
control (T1).The role of potassium in
carbohydrate synthesis, breakdown and
translocation, synthesis of protein and
neutralization of physiologically important
organic acids (Tistale and Nelson, 1966).
Besides, potassium is involved in phloem
loading and unloading of sucrose and amino
acids and storage of sucrose in the form of
starch in developing fruits by activating the
enzyme ‘starch synthase’ (Mengel and Kirkby,
1987) (Table 1).
highest titrable acidity (3.35 %). The lowest
titrable acidity was recorded in treatments T8
followed by T7 (2.12 and 2.18 %) respectively.
Increased level of potassium application
results in reduced acid content of fruits. This
could be due to the fact that under low
potassium level, phosphoenol pyruvate (PEP)
was apparently shunted into alternate
pathways resulting in shortage of acetyl Co-A
(Pattee and Teel, 1967). Hence, oxaloacetate
appeared to be preferentially formed from PEP
in plants with low levels of K and these
organic
acid
derivatives
accumulated
Neutralization of organic acid due to high K
level in tissues could have also resulted in
reduction in acidity (Tistale and Nelson, 1966)
(Table 2).
Ascorbic acid content
Ascorbic acid content of fruit was
significantly different among the treatments
and increased by application of 125 per cent
RDF through fertigation (T8) (575.8 and 580.6
mg g-1). It was followed by T7, application of
100 per cent RDF through fertigation (540.3
and 560.3 mg g-1) during 2011-2012 to 2012 2013 respectively. The lowest ascorbic acid
(335.6 and 350.4 mg g-1) content was recorded
in treatment T1 in 2011-2012 to 2012 -2013
respectively.
Titrable acidity
Titrable acidity was significantly influenced
among the treatments and increased by
application of 100 per cent RDF through soil
application, i.e. control (3.20 and 3.50 %). The
lowest titrable acidity was recorded in
treatments T8 (2.10 and 2.15 %) during 20112012 to 2012 -2013, respectively. It was
followed by T7 i.e. (2.17 and 2.20 %) in 20112012 to 2012 -2013 respectively.
Similar trend was noticed in the pooled mean
values also. The application of 100 per cent
RDF through soil i.e. control recorded the
Similar trend was noticed in the pooled mean
values also. The application of 125 per cent
RDF through fertigation (T8) registered the
highest ascorbic acid content (578.20 mg g-1).
It was followed by T7, (550.29 mg g-1). The
lowest ascorbic acid content (343.0 mg g-1)
was recorded in treatment 100 per cent RDF
through soil (T1) i.e. control (T1). Potassium is
responsible for energy production in the form
of ATP and NADPH in chloroplasts by
maintaining balanced electric charges. This
high-energy status promotes synthesis of
secondary metabolites like ascorbic acid
(Mengel, 1997) (Table 3).
2355
Int.J.Curr.Microbiol.App.Sci (2018) 7(10): 2353-2359
Table.1 Effect of drip fertigation levels on TSS (0 Brix) of aonla cv. NA-7
2012
2013
Treatments
R1
R2
R3
Mean Treatments
R1
R2
R3
Mean
6.57 6.72 6.21
7.26 6.65 7.09
T1
6.50
T1
7.00
8.47 8.62 8.11
9.88 9.53 9.39
T2
8.40
T2
9.60
9.39 9.16 9.96
10.22 10.21 10.17 10.2
T3
9.50
T3
9.44 10.28 9.68
11.70 11.45 11.35 11.5
T4
9.80
T4
11.50 11.49 11.51 11.5
12.37 12.39 12.44 12.4
T5
T5
9.92 9.17 9.71
11.28 10.90 11.43 11.2
T6
9.60
T6
12.57
12.64
12.59
13.03 13.24 13.33 13.2
T7
12.6
T7
13.74 12.62 12.94 13.1
13.76 13.65 13.38 13.6
T8
T8
SEd
0.287
SEd
0.182
CD(0.05)
0.615
CD(0.05)
0.390
Pooled mean
2012-2013
6.75
9.00
9.85
10.65
11.95
10.40
12.90
13.34
0.169
0.348
Table.2 Effect of drip fertigation levels on titrable acidity (%) of aonla cv. NA-7
2012
Treatments
R1
R2
3.19 3.22
T1
2.53 2.69
T2
2.49 2.48
T3
2.48 2.34
T4
2.24 2.23
T5
2.52 2.46
T6
2.18 2.21
T7
2.12 2.15
T8
SEd
CD(0.05)
R3
3.20
2.64
2.53
2.38
2.22
2.43
2.12
2.03
Mean
3.20
2.62
2.50
2.40
2.23
2.47
2.17
2.10
0.042
0.091
2013
Treatments
R1
R2
3.50 3.50
T1
2.80 2.75
T2
2.61 2.57
T3
2.43 2.40
T4
2.31 2.28
T5
2.52 2.54
T6
2.20 2.20
T7
2.20 2.14
T8
SEd
CD(0.05)
R3
3.50
2.62
2.62
2.52
2.30
2.59
2.20
2.11
Mean
3.50
2.72
2.60
2.45
2.30
2.55
2.20
2.15
0.038
0.083
Pooled mean
2012-2013
3.35
2.67
2.55
2.42
2.26
2.51
2.18
2.12
0.028
0.059
Table.3 Effect of drip fertigation levels on ascorbic acid (mg g-1) of aonla cv. NA-7
2012
Treatments
R1
R2
333.53 329.38
T1
434.24 425.69
T2
442.55 414.67
T3
440.50 440.50
T4
513.87 507.62
T5
444.26 439.31
T6
530.98 537.19
T7
577.24 580.12
T8
SEd
CD(0.05)
R3
343.89
422.27
434.58
440.50
509.41
437.33
552.73
570.04
2013
Mean Treatments
R1
R2
332.95 354.76
335.6
T1
452.84 430.54
427.4
T2
432.53 440.18
430.6
T3
441.53 449.37
440.5
T4
541.10 508.20
510.3
T5
437.75 454.99
440.3
T6
555.40 545.59
540.3
T7
576.97 569.71
575.8
T8
6.244
SEd
13.393
CD(0.05)
2356
R3
363.49
421.62
437.99
452.50
517.60
450.06
579.91
595.12
Mean
350.4
435.0
436.9
447.8
522.3
447.6
560.3
580.6
10.963
23.516
Pooled mean
2012-2013
343.00
431.20
433.75
444.15
516.30
443.95
550.29
578.20
6.309
12.933
Int.J.Curr.Microbiol.App.Sci (2018) 7(10): 2353-2359
Table.4 Effect of drip fertigation levels on total sugar (%) of aonla cv. NA-7
2012
Treatments
R1
R2
2.31 2.28
T1
2.92 2.85
T2
3.12 2.98
T3
3.35 3.38
T4
3.85 3.82
T5
3.12 3.08
T6
3.96 3.98
T7
4.36 4.32
T8
SEd
CD(0.05)
R3 Mean
2.21 2.27
2.87 2.88
3.08 3.06
3.47 3.40
3.73 3.80
3.11 3.10
3.91 3.95
4.21 4.30
0.042
0.092
2013
Treatments R1
R2
2.35 2.47
T1
3.00 3.05
T2
3.17 3.40
T3
3.76 3.85
T4
4.07 4.24
T5
3.49 3.20
T6
4.56 4.45
T7
5.08 4.77
T8
SEd
CD(0.05)
R3 Mean
2.52 2.45
3.01 3.02
3.33 3.30
3.55 3.72
4.12 4.14
3.41 3.37
4.40 4.47
4.99 4.95
0.101
0.218
Pooled mean
2012-2013
2.36
2.95
3.18
3.56
3.96
3.23
4.20
4.62
0.054
0.112
Table.5 Effect of drip fertigation levels on reducing sugar (%) of aonla cv. NA-7
2012
Treatments
R1
R2
1.44 1.34
T1
1.82 1.86
T2
1.88 1.93
T3
2.20 2.21
T4
2.47 2.30
T5
2.05 1.96
T6
2.50 2.52
T7
2.61 2.82
T8
SEd
CD(0.05)
R3
1.41
1.72
1.89
2.20
2.42
1.99
2.49
2.67
Mean
1.40
1.80
1.90
2.20
2.40
2.00
2.50
2.70
0.052
0.112
2013
Treatments
R1
R2
1.54 1.51
T1
1.90 1.90
T2
2.11 2.13
T3
2.23 2.39
T4
2.61 2.47
T5
2.28 2.09
T6
2.78 2.74
T7
3.07 3.09
T8
SEd
CD(0.05)
R3
1.44
1.90
2.06
2.28
2.42
2.23
2.88
3.14
Mean
1.50
1.90
2.10
2.30
2.50
2.20
2.80
3.10
0.057
0.122
Pooled mean
2012-2013
1.45
1.85
2.00
2.25
2.45
2.10
2.64
2.90
0.039
0.080
Table.6 Effect of drip fertigation levels on non-reducing sugar (%) of aonla cv. NA-7
2012
Treatments R1
R2
0.86 0.88
T1
1.06 1.09
T2
1.16 1.16
T3
1.23 1.21
T4
1.41 1.37
T5
1.09 1.12
T6
1.46 1.44
T7
1.63 1.56
T8
SEd
CD(0.05)
R3 Mean
0.87 0.87
1.10 1.08
1.16 1.16
1.16 1.20
1.42 1.40
1.10 1.10
1.45 1.45
1.61 1.60
0.019
0.042
2013
Treatments R1
R2
0.96 0.91
T1
1.13 1.15
T2
1.23 1.19
T3
1.49 1.37
T4
1.64 1.64
T5
1.14 1.16
T6
1.68 1.61
T7
1.83 1.86
T8
SEd
CD(0.05)
2357
R3 Mean
0.98 0.95
1.08 1.12
1.18 1.20
1.40 1.42
1.64 1.64
1.21 1.17
1.71 1.67
1.87 1.85
0.030
0.065
Pooled mean
2012-2013
0.91
1.10
1.18
1.31
1.52
1.13
1.56
1.72
0.018
0.037
Int.J.Curr.Microbiol.App.Sci (2018) 7(10): 2353-2359
Apart from higher sugar content observed
with higher level of K applied, increased
ascorbic acid content was noticed in fruits.
This might be due to the fact that K could
have helped to slow down the enzyme system
that encouraged the oxidation of ascorbic
acid, thus helping the plants to accumulate
more ascorbic acid content in fruits (Ananthi,
2002). The present results are in agreement
with that of Brantley and Warren (1960),
Deswal and Patil (1984), Balakrishnan et al.,
(1996) and Mahalakshmi et al., (2000) in
banana.
Total sugars
The total sugar content in the fruit was
significantly different among the treatments
and increased by application of 125 per cent
RDF through fertigation (T8) (4.30 and 4.95
%) followed by 100 per cent RDF through
fertigation (T7) (3.95 and 4.47 %) during
2011-2012 to 2012 -2013 respectively. The
lowest total sugar was recorded in control i.e.
2.27 and 2.45 % (T1) in 2011-2012 to 2012 2013 respectively (Table 4).
Pooled mean values of total sugars were the
highest in 125 per cent RDF through
fertigation (T8) (4.62 %). It was followed by
100 per cent RDF through fertigation T7
(4.20%). The lowest total sugar content was
recorded by control (T1) (2.36 %). Post
flowering application of K also favours the
conversion of starch into simple sugars during
ripening by activating ‘sucrose synthase’
enzyme, resulting in higher sugar content in
fruits.
In plants, well supplied with K, the osmotic
potential of the phloem sap and the volume
flow rate are higher than that observed in
plants supplied with low available potassium
level and as a result, sucrose concentration in
the phloem sap is increased in well-nourished
trees (Marschner, 1995).
Reducing sugars
The reducing sugar content in the fruit was
significantly different among the treatments
and increased by application of 125 per cent
RDF through fertigation (T8) (2.70 and 3.10
%). It was followed by 100 per cent RDF
through fertigation (T7) (2.50 and 2.80 %)
during
2011-2012
to
2012
-2013,
respectively. The lowest reducing sugar (1.40
and 1.50 %) was recorded in control (T1) in
2011-2012 to 2012-2013 respectively. The
mean of reducing sugar content was the
highest (2.90 %) in 125 per cent RDF
fertigation treatment (T8). It was followed by
T7 (100 per cent RDF) through fertigation
(2.64%). The lowest reducing sugar was
recorded by control (1.45 %) (T1) (Table 5).
Non-reducing sugars
Among the two years taken for study, a
significant effect was noticed during 20112012 to 2012 -2013 for the treatments applied
with respect to non-reducing sugar content.
The non-reducing sugar content in the fruit
(1.60 and 1.85 %) was significantly increased
by application of 125 per cent RDF through
fertigation (T8) (Table 6). It was followed by
100 per cent RDF through fertigation (1.45
and 1.67 %) (T7) during 2011-2012 to 2012 2013, respectively. The lowest non-reducing
sugar (0.87 and 0.95 %) was recorded in
control (T1) in 2011-2012 to 2012 -2013
respectively. The pooled mean of nonreducing sugar content was the highest (1.72
%) in 125 per cent RDF fertigation treatment
(T8). It was followed by T7 through fertigation
(1.56 %). The lowest non-reducing sugar was
recorded by control (0.91 %). Quality
characters such as TSS, Ascorbic acid,
Titrable Acidity, Reducing Sugar, Non
Reducing Sugar and Total Sugar of the fruits
were significantly enhanced due to
application of 125 per cent RDF as WSF
through drip in both the years of
experimentation.
2358
Int.J.Curr.Microbiol.App.Sci (2018) 7(10): 2353-2359
References
Anonymous, 2011. Agriculture Statistics at a
glance, Ministry of
Agriculture
Goverment of India.
Arun Shukla, K., D. Singh, and Anil Shukla,
K. 2009. Performance of Indian
gooseberry
(Emblica
officinalis)
cultivars under arid region of India.
Ind.J.Agr.Sci., 79 (11): pp. 849-852
Brantley, B.B. and G.F. Warren. 1960. Effect of
nitrogen on flowering, fruiting and quality
of the watermelon. Proc. of Amer. Soc.
Hort. Sci., 75: 644-649.
Deswal, I.S. and V.K. Patil. 1984. Effects of
N, P and K on the fruit of watermelon.
J. Maharashtra Agric. Univ., 9(3): 308309
Hanamanth, Y. A. 2002. Irrigation and
fertilization studies in high density
mango (Mangifera indica L.). M.Sc.,
Thesis submitted to Division of
Horticulture, UAS, G.K.V.K, Bangalore
Lata, S. and R.P. Singh. 1993. Effect of
nitrogen level and growth regulators on
growth, yield and quality of chilli
(Capsicum annuum L.) variety Pant C1. Veg. Sci., 20(1): 40-43
Mrinalini Raghava and J.P. Tiwari. 1998.
Effect of boron on growth, quality and
shelf-life of fruits of guava (Psidium
guajava L.) cv. Sardar. Prog. Hort.,
30(1-2): 68-72.
Opazo, D. and B. Razeto. 2001. Efecto de
diferentes fertilizantes potásicos en
elcontenido foliar de nutrientes,
producción y calidad de fruta en naranjo
cv. Valencia. Agricultura Técnica,
61:51-54.
Ram Kuamr, M.M., S.Syamal, V.Dwivedi,
R.K.Anand and Vishwanath. 2011.
Plant Archives, 11(2): pp.1053-1056.
Ruiz, R. 2000. Nutrición Mineral. In: Jorge
Valenzuela (ed.), Uva de mesa en Chile.
Instituto
de
Investigaciones
Agropecuarias. pp. 113-143.
Ruiz, R. 2006. Effects of different potassium
fertilizers on yield, fruit quality and
nutritional status of Fairlane Nectarine
trees and on soil fertility. Acta Hort.,
721: 185-190.
Singh, K. K., P. K. Singh, P. K. R. Pandey
and K. N. Shukla. 2006. Integrated
water and nutrient management of
young mango crop in tarai region of
Uttaranchal. In: 3rd Asian Regional
Conference, Sep. 10 - 16, PWTC, Kuala
Lumpur. pp. 314
Thiyagarajan, T. 2006. Effect of micro
sprinkler on growth, yield and nutrient
dynamics pattern in groundnut. Ph.D
(Engineering) Thesis, Tamil Nadu Agri.
Univ., Coimbatore
Vijayakumar, R.M. 2001. Studies on
influence of months of sowing and
growth regulation on annual moringa
(Moringa pterygosperma Gaertn.).
Ph.D., thesis submitted to Tamil Nadu
Agricultural University, Coimbatore
Virendra Singh, Prabhakar Singh and A.
Kumar Singh. 2009. Pysico- chemical
composition and evaluation of aonla
cultivars under chhattisgarh conditions.
Ind.J.Hort.66 (2). pp.267-270.
How to cite this article:
Suresh, P.M., S. Kumar, V. Swaminathan, A. Gurusamy and Shivakumar, T. 2018. Effect of
Drip Fertigation Levels on Fruit Quality Characters of Aonla (Emblica officinalis Gaertn.) cv.
NA-7. Int.J.Curr.Microbiol.App.Sci. 7(10): 2353-2359.
doi: />
2359