Preclinical efficacy of dual mTORC1/2 inhibitor AZD8055 in renal cell carcinoma harboring a TFE3 gene fusion
Bạn đang xem bản rút gọn của tài liệu. Xem và tải ngay bản đầy đủ của tài liệu tại đây (1.79 MB, 12 trang )
Kauffman et al. BMC Cancer
(2019) 19:917
/>
RESEARCH ARTICLE
Open Access
Preclinical efficacy of dual mTORC1/2
inhibitor AZD8055 in renal cell carcinoma
harboring a TFE3 gene fusion
Eric C. Kauffman1,2†, Martin Lang1†, Soroush Rais-Bahrami1,3, Gopal N. Gupta1,4, Darmood Wei1, Youfeng Yang1,
Carole Sourbier1,5 and Ramaprasad Srinivasan1*
Abstract
Background: Renal cell carcinomas (RCC) harboring a TFE3 gene fusion (TfRCC) represent an aggressive subset of
kidney tumors. Key signaling pathways of TfRCC are unknown and preclinical in vivo data are lacking. We
investigated Akt/mTOR pathway activation and the preclinical efficacy of dual mTORC1/2 versus selective mTORC1
inhibition in TfRCC.
Methods: Levels of phosphorylated Akt/mTOR pathway proteins were compared by immunoblot in TfRCC and
clear cell RCC (ccRCC) cell lines. Effects of the mTORC1 inhibitor, sirolimus, and the dual mTORC1/2 inhibitor,
AZD8055, on Akt/mTOR activation, cell cycle progression, cell viability and cytotoxicity were compared in TfRCC
cells. TfRCC xenograft tumor growth in mice was evaluated after 3-week treatment with oral AZD8055,
intraperitoneal sirolimus and respective vehicle controls.
Results: The Akt/mTOR pathway was activated to a similar or greater degree in TfRCC than ccRCC cell lines and
persisted partly during growth factor starvation, suggesting constitutive activation. Dual mTORC1/2 inhibition with
AZD8055 potently inhibited TfRCC viability (IC50 = 20-50 nM) due at least in part to cell cycle arrest, while benign
renal epithelial cells were relatively resistant (IC50 = 400 nM). Maximal viability reduction was greater with AZD8055
than sirolimus (80–90% versus 30–50%), as was the extent of Akt/mTOR pathway inhibition, based on significantly
greater suppression of P-Akt (Ser473), P-4EBP1, P-mTOR and HIF1α. In mouse xenograft models, AZD8055 achieved
significantly better tumor growth inhibition and prolonged mouse survival compared to sirolimus or vehicle
controls.
Conclusions: Akt/mTOR activation is common in TfRCC and a promising therapeutic target. Dual mTORC1/2
inhibition suppresses Akt/mTOR signaling more effectively than selective mTORC1 inhibition and demonstrates in
vivo preclinical efficacy against TFE3-fusion renal cell carcinoma.
Keywords: TFE3, MITF, Translocation renal cell carcinoma, Fusion gene, mTOR inhibitor, AZD8055
Background
Renal cell carcinoma (RCC) consists of distinct subtypes
with characteristic histologic features, genetic mutations
and clinical behaviors [1]. The RCC subtype harboring an
Xp11.2 chromosomal rearrangement (Xp11 Translocation
RCC, TFE3-fusion RCC, TfRCC) comprises 1–5% of all
* Correspondence:
†
Eric C Kauffman and Martin Lang are co-first authors.
1
Urologic Oncology Branch, Center for Cancer Research, National Cancer
Institute, National Institutes of Health, Building 10 - Hatfield CRC, Room
1-5940, Bethesda, MD 20892, USA
Full list of author information is available at the end of the article
RCC cases [2–5]. Rearrangements include an inversion or
translocation of the TFE3 gene (Xp11.2), which is a member of the Microphthalmia-associated transcription factor
(MiT) family that regulates growth and differentiation [6].
The resulting gene-fusion product links the TFE3 Cterminus with the N-terminus of a fusion partner [e.g.
PRCC (1q23), ASPSCR1 (17q25), SFPQ (1p34), NONO
(Xq13) or CLTC (17q23)] [6]. Introduction of a constitutively active promoter upstream of the 3′ TFE3 gene portion is thought to promote carcinogenesis through
increased TFE3 C-terminus expression, nuclear localization
© The Author(s). 2019 Open Access This article is distributed under the terms of the Creative Commons Attribution 4.0
International License ( which permits unrestricted use, distribution, and
reproduction in any medium, provided you give appropriate credit to the original author(s) and the source, provide a link to
the Creative Commons license, and indicate if changes were made. The Creative Commons Public Domain Dedication waiver
( applies to the data made available in this article, unless otherwise stated.
Kauffman et al. BMC Cancer
(2019) 19:917
and transcriptional activity [6]. Characteristic clinical features include common diagnosis in early or mid-adulthood,
frequent metastasis at presentation [7] and other atypical
risk factors for RCC, including female gender and childhood chemotherapy [3, 7–9]. Defining histologic features
include clear and eosinophilic cells, papillary and/or nested
architecture, and occasional psammoma bodies [8, 10]. The
diagnosis is suggested by young age, tumor histology and
nuclear immunoreactivity for the TFE3 C-terminus; however, confirmation of diagnosis requires cytogenetic or molecular evidence of an Xp11 rearrangement or fusion
transcript [8, 10, 11].
Effective drug therapies are yet to be identified for
TfRCC, and there is no clinical standard for systemic
treatment. Prospective drug trials in metastatic TfRCC
patients have not been performed due to the lack of
known agents with preclinical efficacy. Retrospective
studies suggest rapid progression with cytokine therapy
and only occasional, partial responses to rapalogs or
anti-angiogenesis therapies [2, 12–17]. Mouse models of
xenografted TfRCC patient tumor cell lines are established and provide a promising tool for preclinical drug
discovery [6].
Novel drug discovery for TfRCC will benefit from
identification of key molecular pathways driving this disease [6]. A variety of cellular functions are governed by
wild-type TFE3, and the simultaneous dysregulation of
these functions might be sufficient to promote carcinogenesis. Key pathways regulated by TfRCC may involve
TGFβ, ETS transcription factor, E-cadherin, MET tyrosine kinase, insulin receptor, folliculin, Rb and other cell
cycle proteins [6]. Intriguingly, a common connection
among these pathways/proteins is the involvement of
Akt, a key regulator of cell growth, metabolism and
cytoskeletal reorganization. Akt activation is common in
many cancers and the target of ongoing clinical trials
[18, 19]. We and others have previously described common phosphorylation of Akt in clear cell RCC (ccRCC)
tumors and cell lines, including constitutively in the absence of exogenous growth factor stimulation, but similar investigation in TfRCC models is lacking [18–21].
An important downstream target of Akt signaling is
the mTOR-containing protein complex, mTORC1, a
master regulator of protein synthesis, cellular metabolism and autophagy. Activation of mTORC1 is thought to
promote ccRCC carcinogenesis, at least in part, through increased cap-dependent translation of the hypoxia-inducible
factor alpha (HIFα) transcript [22]. Selective pharmacologic
inhibition of mTORC1 with temsirolimus is approved by
the FDA for treatment of high risk metastatic RCC patients
and prolongs their survival [23]. However, clinical resistance to mTORC1 inhibition limits its long-term efficacy and may be mediated by several mechanisms,
including a feedback loop involving a second mTOR-
Page 2 of 12
containing complex, mTORC2, which phosphorylates
Akt in response to mTORC1 inhibition [24, 25]. Concomitant targeting of mTORC1 and mTORC2 is an
intriguing therapeutic strategy that has been evaluated
in several malignancies, including ccRCC, with promising preclinical results [26]. Previous studies have
described increased activation of mTORC1 in TfRCC
tumors [27, 28], which supports the Akt/mTOR pathway to be a potential pharmacological target for
TfRCC [28].
Here we examined Akt/mTOR pathway activation and
the preclinical efficacy of dual mTORC1/2 inhibition
compared to selective mTORC1 inhibition in TfRCC
preclinical in vitro and in vivo models. The results support an important role for Akt/mTOR activation in
TfRCC carcinogenesis and identify dual mTORC1/2 inhibition as a systemic therapeutic strategy with in vivo
preclinical efficacy against this cancer.
Methods
Cell lines and culture
The UOK109, UOK120, UOK124 and UOK146 cell lines
had previously been derived from tumors excised from four
TfRCC patients who were treated at the National Cancer
Institute (NCI, Bethesda, MD), and had been shown to harbor the NONO-TFE3 or PRCC-TFE3 gene fusions [29–31].
The UOK111, UOK139 and UOK150 cell lines had been
derived from ccRCC tumors excised from RCC patients
treated at the NCI and were shown to harbor VHL gene
mutations [32, 33]. Collection of this material was approved
by the Institutional Review Board of the National Cancer
Institute and all patients had provided written informed
consent. RCC4 was obtained from ECACC General Cell
Collection (Salisbury, UK; Cat Nr. 03112702) and the human renal cortical epithelial (HRCE) cell line was obtained
from ATCC (Manassas, VA; Cat Nr. PCS-400-011). All cell
lines were maintained in vitro in DMEM media supplemented with L-glutamine (4 mM), sodium pyruvate (110
mg/l), glucose (4.5 g/l), and 1X essential amino acids
(Gibco, Gaithersburg, MD), with or without 10% fetal bovine serum (Sigma Aldrich, St. Luis, MO). Cell lines were
authenticated using short tandem repeat DNA profiling
(Genetica DNA Laboratories, Burlington, NC) and confirmed to be mycoplasma-free by LookOut® Mycoplasma
qPCR Detection Kit (Sigma Aldrich).
Immunoblotting
Phosphorylated and total levels of Akt/mTOR pathway proteins were measured by immunoblot in TfRCC and ccRCC
cell lines. ccRCC cell lines were used for comparison since
we have previously shown that this RCC subtype has frequent constitutive activation of the Akt/mTOR pathway
[20]. Akt kinase activation was evaluated by measurement
of phosphorylated levels of Akt (Thr308) and Akt (Ser473),
Kauffman et al. BMC Cancer
(2019) 19:917
the latter also served as a reporter for mTORC2 activation
[25], in addition to levels of phosphorylated GSK3β, which
is an Akt kinase target. Activation of mTORC1 was
assessed by measuring phosphorylated levels of S6 ribosomal protein (Ser240/244) and 4EBP1 (Thr37/46 and Ser65);
levels of HIF1α protein, whose translation is suppressed by
hypophosphorylated 4EBP1 through its interaction with
eIF4E, provided an indirect measure of mTORC1 activity
[34]. Levels of phosphorylated mTOR provided additional
measures of mTORC1 and mTORC2 activity, where
mTOR Ser2448 is activated by S6K1 kinase and reflects
amino acid and nutrient status [35] and mTOR Ser2481 autophosphorylation site correlates with intrinsic mTOR catalytic activity [26, 36]. Protein lysates were harvested from
cell lines at 60–70% confluency using RIPA buffer
(Thermo-Fischer Scientific, Waltham, MA) supplemented
with 1 mM PMSF protease inhibitor (Sigma Aldrich). Twodimensional electrophoretic separation of proteins was performed using 10 μg protein/well in 4–20% gradient polyacrylamide gels (Biorad, Hercules, CA) and transferred
onto PVDF membranes (BioRad). Membranes were
blocked for 1 h at room temperature in 5% fat-free milk
with 0.1% tween, followed by overnight incubation at 4 °C
with primary antibody in either fat-free milk and 0.1%
tween or TBS with 5% bovine serum albumin and 0.1%
tween. Primary antibodies included rabbit anti-P-mTOR
(Ser2448), rabbit anti-P-mTOR (Ser2481), rabbit antimTOR (total), rabbit anti-P-Akt (Thr308), rabbit anti-PAkt (Ser473), mouse anti-Akt (total), rabbit anti-P-GSK3β
(Ser9), rabbit anti-GSK3β total, rabbit anti-P-S6 (Ser240/
244), rabbit anti-S6 (total), rabbit anti-P-4EBP1 (Thr37/46),
rabbit anti-P-4EBP1 (Ser65), rabbit anti-4EBP1 (total),
rabbit anti-VHL, and mouse anti-β-actin (all from Cell Signaling Technology, Danvers, MA); mouse anti-HIF1α (BD
Biosciences, San Jose, CA); and goat anti-TFE3 (Santa Cruz
Biotechnology, Santa Cruz, CA). All primary antibodies
were incubated at a 1:1000 dilution, with the exception of
the anti-VHL and anti-HIF1α, for which a 1:500 dilutions
were used. Primary antibody-stained membranes were incubated for 1 h at room temperature with horseradish peroxidase-conjugated secondary antibody, including goat
anti-mouse 1:2000 (Cell Signaling Technology), goat antirabbit 1:5000 (Cell Signaling Technology) or donkey antigoat 1:5000 (Santa Cruz Biotechnology). Secondary-antibody stained membranes were developed using a chemiluminescence kit (Pierce, Rockford, IL) followed by
radiographic film exposure.
Drug agents
The dual mTORC1/2 inhibitor, AZD8055 (AstraZeneca,
London, UK), was prepared for in vitro assays by dissolution in DMSO to 10 mM (4.65 mg/mL), per manufacturer
instructions. The selective mTORC1 inhibitor, sirolimus
(Selleckchem, Houston, TX), was prepared for in vitro
Page 3 of 12
assays by dissolution in 100% ethanol to 10.9 mM (10 mg/
mL). For in vivo assays, AZD8055 was dissolved by sonication in 30% Captisol (CyDex Pharmaceuticals, Lenexa, KS)
to a working concentration of 2 mg/ml and pH of 5.0 per
manufacturer instructions. For in vivo assays, sirolimus was
dissolved in 5% Tween-80 (Sigma Aldrich) and 5% PEG400 (Hampton Research, Aliso Viejo, CA) to a working
concentration of 0.4 mg/ml. Doses of ~ 200 μl drugs were
administered to each animal.
Cell viability assay
Cell viability in vitro was measured using the tetrazolium
salt 3-(4,5-dimethylthiazol-2-yl)-2,5- diphenyltetrazolium
bromide (MTT, Sigma Aldrich) in a 96-well plate format
after 72 h of treatment as previously described [20].
Cytotoxicity assay
Cell cytotoxicity in vitro was measured with the lactate
dehydrogenase (LDH)-based Cytotoxicity Detection Kit
(Roche, Indianapolis, IN) using the modified protocol
described by Smith et al. [37]. Briefly, 1–5 × 10³ cells
were plated onto a 96-well plate to achieve approximately 20% cell confluency 1 day after plating, and drug
treatment was initiated in pyruvate-free media. Media
without cells served as a control for baseline LDH levels
in serum (“media control”). After 48 h of treatment, 4 μl
Triton X-100 detergent was added to half of the wells
for each drug concentration to lyse all live cells (“high
controls”). Reaction mixture was made per manufacturer
instructions and added to all wells, and absorbance was
measured at 490 nm wavelength (Abs490). Cytotoxicity
for each concentration was calculated as [Abs490 (condition) – Abs490 (media control)] / [Abs490 (condition high
control) – Abs490 (media control)] [37]. The drug
LY294002 was used as a positive control for cytotoxicity
induction.
Cell cycle analysis
Cell cycle analysis was performed following 24-h drug
treatment as previously described [38].
TfRCC mouse xenograft experiments
Animal studies were approved by the NIH Institutional
Animal Care and Use Committee (IACUC; Protocol
Number: PB-029) and conducted in accordance with US
and International regulations for protection of laboratory
animals. TfRCC tumor xenografts were generated using
the UOK120 and UOK146 cell lines in female immunocompromised athymic Nude mice (Foxn1nu; Jackson Laboratory, Bar Harbor, ME) at 4–6 weeks of age. Mice
were housed under specific pathogen free conditions.
Briefly, 5 × 10⁶ cells in PBS suspension with 30%
(UOK120) or 50% (UOK146) Matrigel (BD Biosciences,
Franklin Lakes, NY) were injected subcutaneously into
Kauffman et al. BMC Cancer
(2019) 19:917
Page 4 of 12
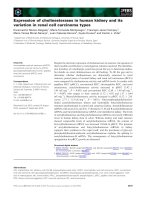
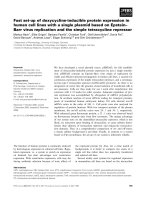
Fig. 1 Akt/mTOR pathway member protein expression and activation in TfRCC and ccRCC cell lines. a Akt/mTOR pathway member protein
expression was determined by Western blot for TfRCC cell lines relative to ccRCC cell lines after 48 h of culture in standard serum-supplemented
media. Akt/mTOR pathway activation levels in TfRCC cell lines are comparable to levels in ccRCC cell lines, as shown by similar protein
phosphorylation levels of mTOR, Akt, GSK3β, S6 Ribosomal Protein, and 4EBP1. HIF1α expression, a hallmark of ccRCC due to VHL functional loss,
is less pronounced in TfRCC than ccRCC cell lines. b Akt/mTOR pathway member protein expression was determined by Western blot after serum
starvation versus serum stimulation of TfRCC cell lines. Cells were cultured for 18 h in media without serum supplementation followed by culture
for 6 h in the presence (+) or absence (−) of 10% serum supplementation. In the absence of serum stimulation, some levels of phosphorylation
are preserved in mTOR, Akt, its kinase target protein GSK3β, S6, and 4EBP1, indicating some constitutive activation of mTORC1, mTORC2 and Akt
the mouse right flank. When UOK120 (N = 34) or
UOK146 (N = 40) tumors were palpable (volume 0.05–
0.20 cm3), treatment was initiated with doses of 4 mg/kg
sirolimus intraperitoneal (IP) weekly, IP vehicle control
weekly (5% Tween-80 and 5% PEG-400), AZD8055 20
mg/kg oral (PO) daily, or PO vehicle control daily (30%
Captisol, pH 5.0). 24 UOK120 mice were randomly
assigned to receive either AZD8055 (N = 12) or PO control (N = 12), while 10 UOK120 mice were randomly
assigned to receive sirolimus (N = 5) or IP control (N =
5). 40 UOK146 mice were randomly assigned to receive
AZD8055 (N = 10), PO control (N = 10), sirolimus (N =
10), or IP control (N = 10). Mouse weights were monitored weekly. Tumor dimensions were measured every
2 days and volume was calculated using the formula:
0.4 × (width)2× (length). Mice were sacrificed by CO2
asphyxiation and cervical dislocation when the longest
tumor diameter reached 2 cm per institutional regulations. An additional 8 mice xenografted with UOK120
or UOK146 tumors underwent the same treatments
(N = 2 mice per treatment) and were sacrificed at 6 h
after their first drug dose for analysis of tumor protein. Protein lysates were prepared by mincing tissue
and solubilization in RIPA Buffer (Thermo Fisher Scientific). Immunoblotting was performed as described
above, with the exception that detection was performed with a Licor Odyssey Imager (LI-COR Biosciences, Lincoln, NE).
Tumor growth of mouse xenografts was compared by
calculating linear regressions of growth curves over the
treatment period and calculation of p-values through a
Mann-Whitney test. Survival times were analyzed
through a log-rank test and graphed with GraphPad
Prism 7.01 (La Jolla, CA).
Kauffman et al. BMC Cancer
(2019) 19:917
Page 5 of 12
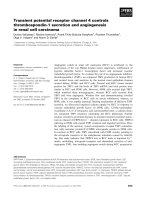
Fig. 2 Cell viability, cytotoxicity and cell cycle progression in TfRCC cell lines treated with mTOR inhibitors. a, b Cell viability, as measured by MTT
assay for TfRCC cell lines and the benign renal epithelial cell line HRCE after 72 h of treatment with up to 1000 nM concentrations of the dual
mTORC1/2 inhibitor, AZD8055 (a), or selective mTORC1 inhibitor, sirolimus (b). Viability in TfRCC cells was suppressed by approximately 80–90%
with AZD8055 and 30–50% with sirolimus relative to the untreated (0 nM drug) condition. Both drugs inhibited growth to a greater degree in
TfRCC cells than in benign renal cells. c, d Cell cytotoxicity, as measured by LDH release by UOK120 and UOK146 TfRCC cell lines after 48 h of
treatment with 1 μM of AZD8055 (c) or sirolimus (d). Only slight cytotoxicity in UOK120 cells and no cytotoxicity in UOK146 cells was observed
after AZD8055 treatment, while sirolimus treatment had no cytotoxic effect. Multi protein inhibitor LY294002 [100 μM] was used as a positive
control. e, f Relative fraction of cells in S-phase of the cell cycle, as measured by BrdU incorporation in UOK120 (e) and UOK146 (f) cell lines
treated for 24 h with low (50 nM) and high (500 nM) concentrations of AZD8055 or sirolimus. Dose-dependent reductions in S-phase in both cell
lines with either drug mirror the magnitude of reductions observed in cell viability (a, b), supporting a predominantly cytostatic mechanism of
growth inhibition for both drugs. *p < 0.05; **p < 0.01; ***p < 0.001; NS = non-significant
Results
Akt/mTOR pathway activation in TfRCC cells
Akt/mTOR pathway activation was observed in all serumsupplemented TfRCC cell lines (Fig. 1a). Activation of
mTORC2 and Akt based on phosphorylated Akt (Ser473)
or Akt (Thr308) and phosphorylated GSK3β was more
consistently detected in TfRCC than in ccRCC cell lines.
Increased levels of phosphorylated S6 ribosomal protein,
Kauffman et al. BMC Cancer
(2019) 19:917
Page 6 of 12
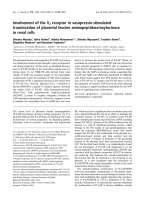
Fig. 3 Differential Akt/mTOR pathway suppression in TfRCC cells treated with dual mTORC1/mTORC2 versus selective mTORC1 inhibition. A
representative Western blot shows time- and dose-dependent effects of dual mTORC1/2 inhibition with AZD8055 versus selective mTORC1
inhibition with sirolimus in a TfRCC cell line (UOK146). Cells were cultured with 0–500 nM of either drug for 0, 1 and 6 h. Dose- and timedependent reductions by AZD8055 treatment in levels of phosphorylated S6 or 4EBP1 and Akt (Ser473) confirmed target inhibition of mTORC1
and mTORC2, respectively, with complete suppression of each achieved with 500 nM by 6 h. Similar dose- and time-dependent suppression was
observed for other Akt/mTORC pathway members, including phosphorylated GSK3β, phosphorylated mTOR and HIF1α. In contrast, sirolimus
achieved complete suppression of phosphorylated S6 by 6 h, but caused time- and dose-dependent increases in other Akt/mTOR pathway
members consistent with feedback activation
indicative of mTORC1 activation, was observed in all
TfRCC cell lines to an extent comparable with ccRCC cell
lines (Fig. 1a). The proportion of total 4EBP1 protein that
was phosphorylated was similar between TfRCC and
ccRCC cell lines; however, higher levels of both phosphorylated and total 4EBP1 protein were present in ccRCC cell
lines. Simultaneous phosphorylation of mTOR at both the
Ser2448 and Ser2481 residues was detected in all TfRCC
cell lines compared to only a minority of ccRCC cell lines.
All TfRCC cell lines expressed VHL and HIF1α protein,
although HIF1α levels were much higher in HIF1α(+)
ccRCC cell lines compared to any TfRCC cell line, a consequence of posttranslational stabilization due to VHL inactivation in ccRCC [33].
Constitutive activation of Akt and mTOR in TfRCC cells
To determine whether Akt and mTORC1/2 are constitutively active in TfRCC, levels of phosphorylated mTOR, Akt,
S6 and 4EBP1 were measured in the TfRCC cell lines grown
in the absence of exogenous serum growth factors as compared to serum stimulation conditions (Fig. 1b). Compared
to serum stimulation, phosphorylation levels of all assessed
proteins were slightly decreased after serum starvation.
However, some level of phosphorylation was maintained for
S6 and 4EBP1 even after prolonged serum starvation, indicating that there is some degree of constitutive mTORC1
activation in TfRCC cells. Similarly, persistent phosphorylation after prolonged serum starvation was also observed for
Akt at Ser473, supporting some constitutive activation for
Akt and mTORC2 in TfRCC cell lines. Phosphorylation of
mTOR at Ser2448 and Ser2481 was also largely preserved
upon serum starvation. Taken together, these results show
some degree of constitutive activation of the Akt/mTORC1/
mTORC2 pathway that suggests its importance for TfRCC
cell line growth and/or survival.
TfRCC cell viability in vitro is suppressed more effectively
with dual mTORC1/2 inhibition than selective mTORC1
inhibition
We performed MTT assays to compare effects of a dual
mTORC1/2 inhibitor, AZD8055, and the selective mTORC1
inhibitor, sirolimus, on in vitro cell viability of TfRCC cell
lines and the benign renal epithelial cell line, HRCE (Fig. 2).
AZD8055 potently suppressed viability in all TfRCC cell
lines (IC50 range = 20–50 nM), with maximal viability reduction of approximately 80–90% at 500–1000 nM (Fig. 2a).
In contrast, AZD8055 caused relatively little reduction in viability in benign renal cells, with an approximately ten-fold
higher IC50 (400 nM) and only 50% maximal viability reduction at 500–1000 nM. An inhibitory effect of sirolimus
on viability was observed at low nanomolar concentrations
Kauffman et al. BMC Cancer
(2019) 19:917
Page 7 of 12
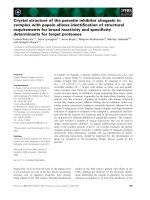
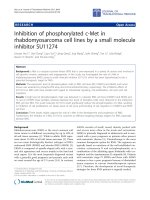
Fig. 4 TfRCC tumor growth and mouse survival after treatment with dual mTORC1/mTORC2 versus selective mTORC1 inhibition. Nude mice
bearing UOK120 or UOK146 tumor xenografts were treated with oral (PO) AZD8055, PO vehicle control, intraperitoneal (IP) sirolimus or IP vehicle
control for a 3-week period. a, b Tumor growth curves showing average tumor volume over time for each treatment condition in UOK120 (a)
and UOK146 (b) xenograft-bearing mice. AZD8055 significantly reduced tumor size compared to PO control (UOK120: p < 0.0001; UOK146: p <
0.0001) or sirolimus (UOK120: p = 0.004; UOK146: p = 0.0003). Growth curves are truncated at the time of the first mouse death for that condition.
c, d Survival curves for xenograft-bearing mice. Sirolimus treatment showed no significant benefit on mouse survival compared to vehicle treated
controls, while AZD8055 treatment extended survival compared to the PO control and sirolimus treatments in mice harboring UOK120 (c) or
UOK146 (d) xenografts. Log-rank p-values: p = 0.021 for AZD8055 vs. PO control (UOK120); p = 0.076 for AZD8055 vs. sirolimus (UOK120); p = 0.815
for sirolimus vs. IP control (UOK120); p < 0.0001 for AZD8055 vs. PO control (UOK146); p < 0.0001 for AZD8055 vs. sirolimus (UOK146); p = 0.729 for
sirolimus vs. IP control (UOK146)
in all cell lines but concentrations above 10 nM had minimal
additional effect. Viability suppression of TfRCC cell
lines with sirolimus was less effective at higher concentrations compared to AZD8055, achieving only approximately 30–50% maximal reduction at 500–1000
nM. With the exception of UOK120 (IC50 = 50 nM),
the IC50 of sirolimus was not reached in TfRCC cell
lines at concentrations up to 1000 nM (Fig. 2b). Similar to observations with AZD8055, the inhibitory effect of sirolimus was less in benign renal cell lines
(approximately 20% maximal reduction) compared to
TfRCC cells.
Cell cycle arrest contributes to TfRCC growth suppression
from dual or selective mTOR inhibition
Because of their ability to generate tumors rapidly in
mouse models, the UOK120 and UOK146 cell lines
were selected for further in vitro and in vivo studies.
First, we examined the mechanism by which
AZD8055 and sirolimus inhibited TfRCC cell viability.
Activity of LDH released from dying/dead cells was
measured in the media of AZ8055- and sirolimustreated TfRCC cells to determine whether the growth
suppression observed in MTT assays was due to cytotoxicity. No significant increase in cytotoxicity was
detectable at 1000 nM for sirolimus in the UOK120
and UOK146 cell lines. No cytotoxicity was observed
in UOK146 cells and only slight cytotoxicity was observed in UOK120 cells after 1000 nM AZD8055
treatment, despite substantial growth reduction of
both cell lines with this dose in MTT assays (Fig. 2c
and d). These data suggested that inhibition of cell
proliferation rather than induction of cytotoxicity
might be the mechanism of TfRCC suppression by
AZD8055 and sirolimus. To confirm this hypothesis,
cell cycle analysis was performed for the UOK120
and UOK146 cell lines after treatment with either
drug. A dose-dependent decrease in S-phase was observed in both cell lines upon treatment with
AZD8055, and, to a lower extent, with sirolimus (Fig.
Kauffman et al. BMC Cancer
(2019) 19:917
Page 8 of 12
Fig. 5 Dual mTORC1/2 inhibitor and selective mTORC1 inhibitor treatments achieve on-target effects in TfRCC xenograft models. Western Blot of
UOK120 and UOK146 xenograft tumors 6 h after treatment with a selective mTORC1 inhibitor (sirolimus), a dual mTORC1/2 inhibitor (AZD8055) or
respective vehicle controls. Reduction in phosphorylation levels of S6 with sirolimus compared to vehicle control (IPC) confirmed on-target
inhibition of mTORC1. Reduction in phosphorylation levels of S6(Ser240/244) and Akt (Thr473) by AZD8055 treatment compared to vehicle
control (POC) confirmed on-target inhibition of mTORC1 and mTORC2, respectively. Levels of phosphorylated mTOR were suppressed with
AZD8055 but not sirolimus compared to respective controls
2e and f, Additional file 1: Figure S1). The magnitude
of S-phase reduction (~ 30–50% for 500 nM sirolimus,
~ 80% for 500 nM AZD8055) mirrored the magnitude
of growth reduction in the MTT assays at similar
concentrations. These findings support cell cycle arrest as a primary mechanism by which AZD8055 and
sirolimus suppress TfRCC growth.
Akt/mTOR pathway suppression is more effective with
dual mTORC1/2 inhibition than selective mTORC1
inhibition
We next compared effects of AZD8055 and sirolimus
treatment on Akt/mTOR pathway activation in TfRCC
cells (Fig. 3). Akt/mTOR pathway suppression was more
effective with AZD8055 than sirolimus, as demonstrated
by more complete downregulation of phosphorylated
pathway members (Akt (Ser473), GSK3β, mTOR, 4EBP1)
and HIF1α, although S6 phosphorylation was suppressed
equally by the two drugs. While AZD8055 suppressed
phosphorylated Akt (Ser473), GSK3β and 4EBP1, sirolimus had the opposite effect, increasing each of these
phosphorylated proteins in a dose- and time-dependent
fashion. Similarly, suppression of HIF1α and phosphorylated mTOR (at either phosphorylation site) by sirolimus
was only partial and became progressively less effective
with higher sirolimus concentrations. These findings are
consistent with feedback activation of Akt/mTOR signaling in response to mTORC1 inhibition, as previously reported [24–26, 39, 40]. In contrast to sirolimus, AZD8055
treatment suppressed phosphorylation of all key Akt/
mTOR pathway members to completion in a time- and
dose-dependent fashion and achieved nearly 100% reduction in HIF1α protein levels.
Dual mTORC1/2 inhibition is associated with more
effective growth inhibition than selective mTORC1
inhibition in TfRCC mouse xenograft models
Efficacy of dual mTORC1/2 versus selective mTORC1 inhibition was next evaluated in two mouse xenograft models
of TfRCC (UOK120, UOK146). In both models, treatment
with AZD8055 resulted in significant inhibition of tumor
growth (UOK146: p < 0.0001; UOK120: p < 0.0001). The
mean tumor volume after the 3-week AZD8055 treatment
period was reduced by 56% (UOK120) and 64% (UOK146)
compared to mice treated with the vehicle control (Fig. 4a
and b). However, the suppressive effect of AZD8055 on
tumor growth was not maintained following treatment
cessation.
In comparison to AZD8055, IP sirolimus resulted in
more modest growth inhibition, with tumor volume reductions of approximately 20–25% compared to control
mice. In both xenograft models, this tumor volume reduction with sirolimus did not reach statistical significance
relative to the corresponding vehicle control (UOK146:
p = 0.315; UOK120: p = 0.691) and was of significantly
lower magnitude compared to the reduction achieved with
AZD8055 (UOK146: p = 0.0003; UOK120: p = 0.004).
Mouse survival, which was driven by tumor size, was significantly longer in AZD8055-treated mice compared to
oral vehicle control-treated mice (UOK146: p < 0.0001;
UOK120: p = 0.021) or sirolimus-treated mice (UOK146:
p < 0.0001; UOK120: p = 0.076) (Fig. 4c and d).
Kauffman et al. BMC Cancer
(2019) 19:917
Immunoblot analysis of Akt/mTOR pathway members
in tumor lysates confirmed on-target effects for both sirolimus and AZD8055 at 6 h after treatment (Fig. 5, Additional file 1: Figure S2). Both drugs achieved complete
suppression of S6 phosphorylation indicative of mTORC1
inhibition, while AZD8055 additionally suppressed phosphorylation of Akt (Ser473) indicative of mTORC2
inhibition.
Discussion
TfRCC is an aggressive RCC subtype with no known effective therapy in the clinical or preclinical setting [2, 12–17].
TfRCC incidence has been historically underestimated because of frequent misdiagnosis as either ccRCC or papillary
RCC due to overlapping histologic features, particularly
when clinical suspicion for TfRCC (i.e., young age) is otherwise lacking [8]. Retrospective identification of TFE3-fusion
gene mutations by the TCGA project in several patients
diagnosed originally with ccRCC or papillary RCC is consistent with the 1–5% incidence of retrospective identification reported among nephrectomy patients by others [2–5]
and may be even higher among metastatic RCC patients.
Development of novel therapeutic strategies for TfRCC
patients warrants investigation, and identification of key
molecular pathways driving TfRCC carcinogenesis is a critical first step.
The current study reveals Akt/mTOR pathway activation
in TfRCC cell lines. Akt and mTORC1 pathway activation is
common in many human cancers, including ccRCC [18–22]
and is mediated by phosphoinositide kinase 1 (PDK-1), the
VHL/EGLN suppressive pathway [41], and the mTORC2
complex. mTORC1 activation, as measured by downstream
S6 phosphorylation, is reported to be higher in suspected or
genetically confirmed TfRCC tumors compared to ccRCC
or papillary RCC tumors [27, 28]. We similarly observed
high levels of phosphorylated S6 in TfRCC cell lines, comparable to levels in ccRCC cell lines. Levels of Akt activity in
TfRCC cell lines generally surpassed those in ccRCC cell
lines evaluated and were partly independent of exogenous
growth factor stimulation, as previously described for ccRCC
[20]. Persistent phosphorylation of mTOR targets in the absence of exogenous growth factor stimulation is consistent
with some level of constitutive activation of the mTORC1
and mTORC2 complexes in TfRCC cells. These results suggest that dysregulated Akt and mTOR activation may play
an important role in TfRCC carcinogenesis.
To further explore this possibility, we evaluated the efficacy of a dual mTORC1/2 inhibitor, AZD8055, and compared it with a selective mTORC1 inhibitor, sirolimus, in
TfRCC cell lines, observing consistently greater growth inhibition with dual mTORC1/2 inhibition. The inhibitory
mechanism for both AZD8055 and sirolimus included cell
cycle arrest without significant cytotoxicity induction,
consistent with the effect of rapalogs reported in other
Page 9 of 12
cancer types [42]. Both drugs caused less growth inhibition in benign renal epithelial cells compared to TfRCC
cells, indicating a largely cancer-specific effect. Greater
growth suppression with AZD8055 than sirolimus in vitro
was validated in vivo using two separate mouse xenograft
models of TfRCC. These results are consistent with another preclinical study that recently reported PI3K/mTOR
pathway dysregulation in TfRCC and suggested that more
complete inhibition of this pathway with a dual TORC1/2
and PI3K inhibitor (BEZ-235) results in a greater antiproliferative effect than a selective TORC1 inhibitor [28].
Greater TfRCC suppression with AZD8055 relative to
sirolimus is likely due to more complete suppression of the
Akt/mTOR pathway. AZD8055- versus sirolimus-treated
TfRCC cell lines and mouse xenografts demonstrated clear
differences in Akt/mTOR pathway activation. Selective
mTORC1 inhibition induced feedback activation of Akt
kinase and, consequently, less effective inhibition of downstream S6 phosphorylation, whereas dual mTORC1/2 inhibition suppressed both upstream Akt activation and
downstream S6 phosphorylation. Feedback activation of
Akt in response to mTORC1 inhibitors is well described in
many cancers and may directly mediate clinical resistance
in RCC patients [24–26, 39, 40, 43]. Dual mTORC1/2 inhibition blocks this feedback activation and hence
provides a promising strategy for overcoming clinical resistance to selective mTORC1 inhibition.
To date, no drug treatment strategy has demonstrated consistent clinical efficacy for metastatic
TfRCC patients. Clinical studies are limited by small cohort sizes, retrospective designs, lack of genetic confirmation
of TFE3-fusion, and heterogeneity in treatment parameters
[2, 12–17]. Cytokine therapy is largely ineffective [2, 14–16],
and the efficacy of angiogenesis inhibitors has been limited,
with progression-free survival typically under 1 year [16, 17].
Similarly, case reports of mTORC1 inhibitors in TfRCC patients suggest rapid progression during treatment [12, 13].
There is hence a clear need for novel therapeutic strategies
that broaden the therapeutic target beyond mTORC1. Combinations of mTORC1 and angiogenesis inhibitors have not
yet demonstrated clinical benefit over VEGF pathway antagonists alone, and do not address the resistance mechanism
of upstream Akt reactivation [44]. The combination of Akt
and mTORC1 inhibitors has demonstrated synergistic preclinical efficacy in various cancer types [39, 45]. Dual
mTORC1/2 inhibitors such as AZD8055 or Ku0063794
suppress growth of ccRCC cell lines, including those
resistant to angiogenesis inhibitors [26, 40]. Although
dual mTORC1/2 inhibition with AZD2014 proved inferior to everolimus in metastatic ccRCC patients
[46], preclinical studies from our group and others
suggest that AZD8055 is superior to rapalogs in
ccRCC [40, 47]. The present study extends this prior
work to TfRCC, and provides encouraging preclinical
Kauffman et al. BMC Cancer
(2019) 19:917
rationale for clinical investigation of dual mTORC1/2
inhibition in TfRCC patients [48].
The mechanism underlying constitutive activation of
mTOR and Akt in TfRCC warrants future investigation.
Activating mutations in the MTOR gene have not yet
been detected in patient tumors harboring a TFE3 gene
fusion, nor have mutations in PIK3CA or PTEN [4].
Likewise, genetic characterization of commonly mutated
cancer genes in the TfRCC cell lines used in this study
did not reveal any pathogenic mutations (unpublished
results). Both PI3K and PTEN are implicated as upstream activators of mTORC2 [43]. Given the potential
ability of PI3K to activate both mTORC2 and PDK-1,
dysregulated PI3K could theoretically explain the high
phosphorylation at both Akt (Ser473) and Akt (Thr308)
observed in TfRCC. Simultaneous pharmacologic inhibition of PI3K and mTORC1 has demonstrated preclinical
efficacy in ccRCC, however dose-limiting toxicity has
hindered clinical use [49, 50]. Dual mTORC1/2 inhibition might have lower toxicity owing to its narrower
target spectrum, as suggested by a phase I trial of
AZD8055 [51]. The MET tyrosine kinase, an upstream
activator of Akt, has been proposed to mediate TfRCC
carcinogenesis [52], however the putative MET inhibitor,
Tivantinib, had no objective responses and poor progression free survival (median 1.9 months) in a small number
of RCC patients with a MiT family gene fusion [53].
Such findings warrant reexamination of the importance
of MET in TfRCC and are consistent with our prior
work showing no significant baseline MET activation in
TfRCC cell lines or growth inhibition of these cell lines
in response to biologically relevant concentrations of
multiple MET-selective inhibitors [6, 54].
Conclusion
The current study uncovers an important role for the
Akt/mTOR signaling axis in TfRCC. Adding to recently
published results that suggest therapeutic potential for
PI3K/mTOR inhibition in TfRCC [28], our work shows
dual mTORC1/2 inhibition suppresses the Akt/mTOR
pathway and tumor growth in TfRCC preclinical models
more effectively than selective mTORC1 inhibition.
These findings provide an encouraging preclinical rationale for the clinical investigation of dual mTORC1/2
inhibitors in TfRCC patients.
Additional file
Additional file 1: Figure S1. Flow cytometry representing suppression
of S-phase of cell cycle in TfRCC cells using mTOR inhibitors Cell cycle
profile of mTOR inhibitor-treated UOK120 and UOK146 cells measured by
flow cytometry and displayed as time-course experiment showing
percentage of cells in G2/M-phase, S-phase and G0/G1 phase of the cell
cycle at 12 h, 24 h, 48 h and 72 h following drug treatment with 50 nM
and 500 nM of Sirolimus and AZD8055 (a and b). Representative scatter
Page 10 of 12
plots of total DNA content versus newly synthesized DNA content are
shown in c and d. Dose-dependent reduction in the proportion of cells
in S-phase is apparent in both cell lines at all time points, with a greater
reduction observed using dual mTORC1/2 inhibition (AZD8055) than
selective mTORC1 inhibition (sirolimus). An accumulation over time of
cells arrested in G0/G1 phase of the cell cycle can be observed. Figure
S2. Dual mTORC1/2 inhibitor and selective mTORC1 inhibitor treatments
achieve on-target effects in TfRCC xenograft models. A quantitative
analysis of the changes of phosphorylated protein levels of mTOR
pathway proteins in UOK120 and UOK146 xenograft tumors 6 h after
treatment with a selective mTORC1 inhibitor (sirolimus), a dual mTORC1/
2 inhibitor (AZD8055) or respective vehicle controls (see Fig. 5) is shown
as normalized intensity based on β-actin protein levels. (PDF 670 kb)
Abbreviations
ccRCC: Clear cell renal cell carcinoma; MiT: Microphthalmia-associated
transcription factor family; RCC: Renal cell carcinomas; TfRCC: TFE3–fusion
renal cell carcinoma
Acknowledgments
This research was supported by the Intramural Research Program of the NIH,
National Cancer Institute, Center for Cancer Research. We would like to thank
Dr. W. Marston Linehan for generously providing cell lines and reagents for
this study and Dr. Christopher Ricketts for critical reading of the manuscript.
Authors’ contributions
ECK, SRB, ML and RS conceived the work and designed the study. ECK, ML,
SRB, GNG, DW, YY and CS acquired data; ECK, ML, SRB analyzed the data; ML,
ECK, SRB, and RS drafted and revised the manuscript. All authors read and
approved the final manuscript.
Funding
This research was supported by the Intramural Research Program of the NIH,
National Cancer Institute, Center for Cancer Research. The funding body was
not involved in the design of the study and collection, analysis, and
interpretation of data and in writing the manuscript.
Availability of data and materials
All data generated or analyzed during this study are included in this
published article and its supplementary information files.
Ethics approval and consent to participate
Animal studies were approved by the NIH Institutional Animal Care and Use
Committee (IACUC) and conducted in accordance with US and International
regulations for protection of laboratory animals.
Consent for publication
Not applicable
Competing interests
The authors declare that they have no competing interests.
Author details
1
Urologic Oncology Branch, Center for Cancer Research, National Cancer
Institute, National Institutes of Health, Building 10 - Hatfield CRC, Room
1-5940, Bethesda, MD 20892, USA. 2Present address: Departments of Urology
and Cancer Genetics, Roswell Park Cancer Institute, Buffalo, NY 14263, USA.
3
Present address: Department of Urology and Department of Radiology,
University of Alabama at Birmingham School of Medicine, Birmingham, AL
35294, USA. 4Present address: Department of Urology, Loyola University
Medical Center, Chicago, IL 60153, USA. 5Present address: Office of
Biotechnology Products, Office of Pharmaceutical Quality, Center for Drug
Evaluation and Research, U.S. Food and Drug Administration, Silver Spring,
MD 20993, USA.
Kauffman et al. BMC Cancer
(2019) 19:917
Received: 17 April 2019 Accepted: 26 August 2019
References
1. Linehan WM, Bratslavsky G, Pinto PA, Schmidt LS, Neckers L, Bottaro DP,
Srinivasan R. Molecular diagnosis and therapy of kidney cancer. Annu Rev
Med. 2010;61:329–43.
2. Komai Y, Fujiwara M, Fujii Y, Mukai H, Yonese J, Kawakami S, Yamamoto S,
Migita T, Ishikawa Y, Kurata M, et al. Adult Xp11 translocation renal cell
carcinoma diagnosed by cytogenetics and immunohistochemistry. Clin
Cancer Res. 2009;15(4):1170–6.
3. Zhong M, De Angelo P, Osborne L, Paniz-Mondolfi AE, Geller M, Yang Y,
Linehan WM, Merino MJ, Cordon-Cardo C, Cai D. Translocation renal cell
carcinomas in adults: a single-institution experience. Am J Surg Pathol.
2012;36(5):654–62.
4. Cancer Genome Atlas Research N. Comprehensive molecular characterization
of clear cell renal cell carcinoma. Nature. 2013;499(7456):43–9.
5. Cancer Genome Atlas Research N, Linehan WM, Spellman PT, Ricketts CJ,
Creighton CJ, Fei SS, Davis C, Wheeler DA, Murray BA, Schmidt L, et al.
Comprehensive Molecular Characterization of Papillary Renal-Cell
Carcinoma. N Engl J Med. 2016;374(2):135–45.
6. Kauffman EC, Ricketts CJ, Rais-Bahrami S, Yang Y, Merino MJ, Bottaro DP,
Srinivasan R, Linehan WM. Molecular genetics and cellular features of TFE3
and TFEB fusion kidney cancers. Nat Rev Urol. 2014;11(8):465–75.
7. Argani P. MiT family translocation renal cell carcinoma. Semin Diagn Pathol.
2015;32(2):103–13.
8. Argani P, Olgac S, Tickoo SK, Goldfischer M, Moch H, Chan DY, Eble JN,
Bonsib SM, Jimeno M, Lloreta J, et al. Xp11 translocation renal cell
carcinoma in adults: expanded clinical, pathologic, and genetic spectrum.
Am J Surg Pathol. 2007;31(8):1149–60.
9. Argani P, Lae M, Ballard ET, Amin M, Manivel C, Hutchinson B, Reuter VE,
Ladanyi M. Translocation carcinomas of the kidney after chemotherapy in
childhood. J Clin Oncol. 2006;24(10):1529–34.
10. Camparo P, Vasiliu V, Molinie V, Couturier J, Dykema KJ, Petillo D, Furge KA,
Comperat EM, Lae M, Bouvier R, et al. Renal translocation carcinomas:
clinicopathologic, immunohistochemical, and gene expression profiling
analysis of 31 cases with a review of the literature. Am J Surg Pathol. 2008;
32(5):656–70.
11. Green WM, Yonescu R, Morsberger L, Morris K, Netto GJ, Epstein JI, Illei PB, Allaf M,
Ladanyi M, Griffin CA, et al. Utilization of a TFE3 break-apart FISH assay in a renal
tumor consultation service. Am J Surg Pathol. 2013;37(8):1150–63.
12. Parikh J, Coleman T, Messias N, Brown J. Temsirolimus in the treatment of
renal cell carcinoma associated with Xp11.2 translocation/TFE gene fusion
proteins: a case report and review of literature. Rare Tumors. 2009;1(2):e53.
13. Lim B, You D, Jeong IG, Kwon T, Hong S, Song C, Cho YM, Hong B, Hong
JH, Ahn H, et al. Clinicopathological features of Xp11.2 translocation renal
cell carcinoma. Korean J Urol. 2015;56(3):212–7.
14. Argani P, Antonescu CR, Illei PB, Lui MY, Timmons CF, Newbury R, Reuter VE,
Garvin AJ, Perez-Atayde AR, Fletcher JA, et al. Primary renal neoplasms with
the ASPL-TFE3 gene fusion of alveolar soft part sarcoma: a distinctive tumor
entity previously included among renal cell carcinomas of children and
adolescents. Am J Pathol. 2001;159(1):179–92.
15. Meyer PN, Clark JI, Flanigan RC, Picken MM. Xp11.2 translocation renal
cell carcinoma with very aggressive course in five adults. Am J Clin
Pathol. 2007;128(1):70–9.
16. Malouf GG, Camparo P, Oudard S, Schleiermacher G, Theodore C, Rustine A,
Dutcher J, Billemont B, Rixe O, Bompas E, et al. Targeted agents in
metastatic Xp11 translocation/TFE3 gene fusion renal cell carcinoma (RCC):
a report from the Juvenile RCC Network. Ann Oncol. 2010;21(9):1834–8.
17. Choueiri TK, Lim ZD, Hirsch MS, Tamboli P, Jonasch E, McDermott DF, Dal
Cin P, Corn P, Vaishampayan U, Heng DY, et al. Vascular endothelial growth
factor-targeted therapy for the treatment of adult metastatic Xp11.2
translocation renal cell carcinoma. Cancer. 2010;116(22):5219–25.
18. Altomare DA, Testa JR. Perturbations of the AKT signaling pathway in
human cancer. Oncogene. 2005;24(50):7455–64.
19. Samuels Y, Ericson K. Oncogenic PI3K and its role in cancer. Curr Opin
Oncol. 2006;18(1):77–82.
20. Sourbier C, Lindner V, Lang H, Agouni A, Schordan E, Danilin S, Rothhut S, Jacqmin
D, Helwig JJ, Massfelder T. The phosphoinositide 3-kinase/Akt pathway: a new
target in human renal cell carcinoma therapy. Cancer Res. 2006;66(10):5130–42.
Page 11 of 12
21. Hager M, Haufe H, Lusuardi L, Schmeller N, Kolbitsch C. p-AKT
overexpression in primary renal cell carcinomas and their metastases. Clin
Exp Metastasis. 2010;27(8):611–7.
22. Pantuck AJ, Seligson DB, Klatte T, Yu H, Leppert JT, Moore L, O'Toole T,
Gibbons J, Belldegrun AS, Figlin RA. Prognostic relevance of the mTOR
pathway in renal cell carcinoma: implications for molecular patient selection
for targeted therapy. Cancer. 2007;109(11):2257–67.
23. Hudes G, Carducci M, Tomczak P, Dutcher J, Figlin R, Kapoor A,
Staroslawska E, Sosman J, McDermott D, Bodrogi I, et al. Temsirolimus,
interferon alfa, or both for advanced renal-cell carcinoma. N Engl J
Med. 2007;356(22):2271–81.
24. Wan X, Harkavy B, Shen N, Grohar P, Helman LJ. Rapamycin induces
feedback activation of Akt signaling through an IGF-1R-dependent
mechanism. Oncogene. 2007;26(13):1932–40.
25. Sarbassov DD, Guertin DA, Ali SM, Sabatini DM. Phosphorylation and regulation of
Akt/PKB by the rictor-mTOR complex. Science. 2005;307(5712):1098–101.
26. Zhang H, Berel D, Wang Y, Li P, Bhowmick NA, Figlin RA, Kim HL. A comparison of
Ku0063794, a dual mTORC1 and mTORC2 inhibitor, and temsirolimus in preclinical
renal cell carcinoma models. PLoS One. 2013;8(1):e54918.
27. Argani P, Hicks J, De Marzo AM, Albadine R, Illei PB, Ladanyi M, Reuter VE,
Netto GJ. Xp11 translocation renal cell carcinoma (RCC): extended
immunohistochemical profile emphasizing novel RCC markers. Am J Surg
Pathol. 2010;34(9):1295–303.
28. Damayanti NP, Budka JA, Khella HWZ, Ferris MW, Ku SY, Kauffman EC, Wood AC,
Ahmed K, Chintala VN, Adelaiye-Ogala R, et al. Therapeutic targeting of TFE3/IRS1/PI3K/mTOR axis in translocation renal cell carcinoma. Clin Cancer Res. 2018;
24(23):5977–89. Epub 2018 Jul 30.
29. Sidhar SK, Clark J, Gill S, Hamoudi R, Crew AJ, Gwilliam R, Ross M, Linehan
WM, Birdsall S, Shipley J, et al. The t(X;1)(p11.2;q21.2) translocation in
papillary renal cell carcinoma fuses a novel gene PRCC to the TFE3
transcription factor gene. Hum Mol Genet. 1996;5(9):1333–8.
30. Weterman MA, Wilbrink M. Geurts van Kessel A: Fusion of the transcription
factor TFE3 gene to a novel gene, PRCC, in t(X;1)(p11;q21)-positive papillary
renal cell carcinomas. Proc Natl Acad Sci U S A. 1996;93(26):15294–8.
31. Clark J, Lu YJ, Sidhar SK, Parker C, Gill S, Smedley D, Hamoudi R, Linehan
WM, Shipley J, Cooper CS. Fusion of splicing factor genes PSF and NonO
(p54nrb) to the TFE3 gene in papillary renal cell carcinoma. Oncogene.
1997;15(18):2233–9.
32. Anglard P, Trahan E, Liu S, Latif F, Merino MJ, Lerman MI, Zbar B, Linehan
WM. Molecular and cellular characterization of human renal cell carcinoma
cell lines. Cancer Res. 1992;52(2):348–56.
33. Sourbier C, Srivastava G, Ghosh MC, Ghosh S, Yang Y, Gupta G, Degraff W,
Krishna MC, Mitchell JB, Rouault TA, et al. Targeting HIF2alpha translation
with Tempol in VHL-deficient clear cell renal cell carcinoma. Oncotarget.
2012;3(11):1472–82.
34. Duvel K, Yecies JL, Menon S, Raman P, Lipovsky AI, Souza AL, Triantafellow
E, Ma Q, Gorski R, Cleaver S, et al. Activation of a metabolic gene regulatory
network downstream of mTOR complex 1. Mol Cell. 2010;39(2):171–83.
35. Chiang GG, Abraham RT. Phosphorylation of mammalian target of
rapamycin (mTOR) at Ser-2448 is mediated by p70S6 kinase. J Biol Chem.
2005;280(27):25485–90.
36. Soliman GA, Acosta-Jaquez HA, Dunlop EA, Ekim B, Maj NE, Tee AR, Fingar
DC. mTOR Ser-2481 autophosphorylation monitors mTORC-specific catalytic
activity and clarifies rapamycin mechanism of action. J Biol Chem. 2010;
285(11):7866–79.
37. Smith SM, Wunder MB, Norris DA, Shellman YG. A simple protocol for using
a LDH-based cytotoxicity assay to assess the effects of death and growth
inhibition at the same time. PLoS One. 2011;6(11):e26908.
38. Yang Y, Vocke CD, Ricketts CJ, Wei D, Padilla-Nash HM, Lang M, Sourbier C,
Killian JK, Boyle SL, Worrell R, et al. Genomic and metabolic characterization
of a chromophobe renal cell carcinoma cell line model (UOK276). Genes
Chromosomes Cancer. 2017;56(10):719–29.
39. Holland WS, Tepper CG, Pietri JE, Chinn DC, Gandara DR, Mack PC, Lara PN
Jr. Evaluating rational non-cross-resistant combination therapy in advanced
clear cell renal cell carcinoma: combined mTOR and AKT inhibitor therapy.
Cancer Chemother Pharmacol. 2012;69(1):185–94.
40. Serova M, de Gramont A, Tijeras-Raballand A, Dos Santos C, Riveiro ME,
Slimane K, Faivre S, Raymond E. Benchmarking effects of mTOR, PI3K, and
dual PI3K/mTOR inhibitors in hepatocellular and renal cell carcinoma
models developing resistance to sunitinib and sorafenib. Cancer Chemother
Pharmacol. 2013;71(5):1297–307.
Kauffman et al. BMC Cancer
(2019) 19:917
41. Guo J, Chakraborty AA, Liu P, Gan W, Zheng X, Inuzuka H, Wang B, Zhang J,
Zhang L, Yuan M, et al. pVHL suppresses kinase activity of Akt in a prolinehydroxylation-dependent manner. Science. 2016;353(6302):929–32.
42. Saqcena M, Patel D, Menon D, Mukhopadhyay S, Foster DA. Apoptotic
effects of high-dose rapamycin occur in S-phase of the cell cycle. Cell Cycle.
2015;14(14):2285–92.
43. Zou Z, Chen J, Yang J, Bai X. Targeted Inhibition of Rictor/mTORC2 in
Cancer Treatment: A New Era after Rapamycin. Curr Cancer Drug Targets.
2016;16(4):288–304.
44. Flaherty KT, Manola JB, Pins M, McDermott DF, Atkins MB, Dutcher JJ,
George DJ, Margolin KA, DiPaola RS. BEST: A Randomized Phase II Study of
Vascular Endothelial Growth Factor, RAF Kinase, and Mammalian Target of
Rapamycin Combination Targeted Therapy With Bevacizumab, Sorafenib,
and Temsirolimus in Advanced Renal Cell Carcinoma--A Trial of the ECOGACRIN Cancer Research Group (E2804). J Clin Oncol. 2015;33(21):2384–91.
45. Cirstea D, Hideshima T, Rodig S, Santo L, Pozzi S, Vallet S, Ikeda H, Perrone
G, Gorgun G, Patel K, et al. Dual inhibition of akt/mammalian target of
rapamycin pathway by nanoparticle albumin-bound-rapamycin and
perifosine induces antitumor activity in multiple myeloma. Mol Cancer Ther.
2010;9(4):963–75.
46. Powles T, Wheater M, Din O, Geldart T, Boleti E, Stockdale A, Sundar S,
Robinson A, Ahmed I, Wimalasingham A, et al. A Randomised Phase 2
Study of AZD2014 Versus Everolimus in Patients with VEGF-Refractory
Metastatic Clear Cell Renal Cancer. Eur Urol. 2016;69(3):450–6.
47. Gupta GN, Lin KY, Sourbier C, Baba M, Guichard S, Linehan WM, Srinivasan R:
Abstract 645: Preclinical efficacy of AZD8055, an ATP-competitive mammalian
target of rapamycin (mTOR) kinase inhibitor,in vitroin clear cell renal cell carcinoma
(RCC). Proceedings of the 102nd Annual Meeting of the American Association for
Cancer Research 2014, 71(8 Supplement):645–645.
48. Figlin RA, Kaufmann I, Brechbiel J. Targeting PI3K and mTORC2 in metastatic
renal cell carcinoma: new strategies for overcoming resistance to VEGFR
and mTORC1 inhibitors. Int J Cancer. 2013;133(4):788–96.
49. Seront E, Rottey S, Filleul B, Glorieux P, Goeminne JC, Verschaeve V,
Vandenbulcke JM, Sautois B, Boegner P, Gillain A, et al. Phase II study of
dual phosphoinositol-3-kinase (PI3K) and mammalian target of rapamycin
(mTOR) inhibitor BEZ235 in patients with locally advanced or metastatic
transitional cell carcinoma. BJU Int. 2016;118(3):408–15.
50. Carlo MI, Molina AM, Lakhman Y, Patil S, Woo K, DeLuca J, Lee CH, Hsieh JJ,
Feldman DR, Motzer RJ, et al. A Phase Ib Study of BEZ235, a Dual Inhibitor of
Phosphatidylinositol 3-Kinase (PI3K) and Mammalian Target of Rapamycin (mTOR),
in Patients With Advanced Renal Cell Carcinoma. Oncologist. 2016;21(7):787–8.
51. Naing A, Aghajanian C, Raymond E, Olmos D, Schwartz G, Oelmann E,
Grinsted L, Burke W, Taylor R, Kaye S, et al. Safety, tolerability,
pharmacokinetics and pharmacodynamics of AZD8055 in advanced solid
tumours and lymphoma. Br J Cancer. 2012;107(7):1093–9.
52. Tsuda M, Davis IJ, Argani P, Shukla N, McGill GG, Nagai M, Saito T, Lae M,
Fisher DE, Ladanyi M. TFE3 fusions activate MET signaling by transcriptional
up-regulation, defining another class of tumors as candidates for
therapeutic MET inhibition. Cancer Res. 2007;67(3):919–29.
53. Wagner AJ, Goldberg JM, Dubois SG, Choy E, Rosen L, Pappo A, Geller J,
Judson I, Hogg D, Senzer N, et al. Tivantinib (ARQ 197), a selective inhibitor
of MET, in patients with microphthalmia transcription factor-associated
tumors: results of a multicenter phase 2 trial. Cancer. 2012;118(23):5894–902.
54. Kauffman E, Gupta G, Cecchi F, Raffensperger K, Linehan WM, Bottaro DP,
Srinivasan R. 448 Characterization of the Akt-mTOR Pathway in Tfe3-Fusion Renal
Cell Cancers and Implications for Targeted Therapy. J Urol. 2012;187(4):e183–4.
Publisher’s Note
Springer Nature remains neutral with regard to jurisdictional claims in
published maps and institutional affiliations.
Page 12 of 12