nghiên cứu y học Nghiên cứu hiệu quả của phác đồ ngắn hMG và phác đồ ngắn rFSH để xử trí buồng trứng đáp ứng kém trong TTTON
Bạn đang xem bản rút gọn của tài liệu. Xem và tải ngay bản đầy đủ của tài liệu tại đây (1006.28 KB, 25 trang )
1
TV N
M t trong các quy trình quan tr ng c a th tinh trong ng nghi m (TTTON)
là khâu kích thích bu ng tr ng (KTBT). D i tác đ ng c a thu c KTBT, kho ng
80% các chu k có đáp ng bu ng tr ng phù h p, 5-10% có xu h ng quá kích
bu ng tr ng, nh ng có kho ng 10-20% bu ng tr ng đáp ng kém ho c hoàn
toàn không đáp ng. T l bu ng tr ng đáp ng kém trong TTTON x y ra vào
kho ng 9 – 24%. H u qu làm gi m s noãn thu đ c, gi m s phôi chuy n,
gi m t l thành công và làm t ng chi phí đi u tr .
Nh ng b ng ch ng th c nghi m và lâm sàng ch ng t vai trò c a LH trong
s phát tri n nang noãn t i u, tr ng thành hoàn toàn nang noãn và gây phóng
noãn.Các nghiên c u (NC) c ng ch ra r ng b sung LH cho nhóm bu ng tr ng
đáp ng kém làm t ng t l thành công c a các chu k TTTON trên nhóm b nh
nhân này. Tuy nhiên các NC khác nhau đ a ra nh ng k t qu khác nhau do cách
l a ch n đ i t ng NC, thi t k NC và c m u khác nhau nên v n ch a th ng nh t
đ c ph ng pháp nào th c s hi u qu .
Trung tâm H tr sinh s n (HTSS) - B nh vi n Ph S n Trung
ng
(BVPST ) là m t trung tâm TTTON l n nh t mi n B c. T l đáp ng kém b nh
nhân dùng phác đ dài là 21%. Phác đ ng n agonist k t h p v i FSH đ n thu n
ho c b sung LH là nh ng l a ch n đ u tay v i nhóm b nh nhân có ti n s ho c có
nguy c đáp ng kém. LH có th là LH tái t h p, c ng có th t hMG (human
Menopausal Gonadotropin). Trên th tr ng hi n nay không có ch ph m LH tái t
h p đ n thu n mà ch có ch ph m FSH k t h p v i LH tái t h p theo t l 2:1 có
giá thành cao. Vì v y LH có trong hMG là m t l a ch n khi c n ph i b sung LH.
Tuy nhiên vi c s d ng LH có trong hMG c ng còn nhi u tranh cãi và còn ph
thu c vào kinh nghi m riêng c a t ng bác s . Hi u qu c a LH v i nhóm đáp ng
kém s ra sao? B sung LH có làm t ng nguy gây hoàng th hoá s m không? LH
có nh h ng đ n NMTC và t l có thai nh th nào?
tr l i nh ng câu h i
trên, nh m tìm ra phác đ KTBT có hi u qu đ i v i nhóm có bu ng tr ng đáp ng
kém trong th tinh trong ng nghiêm chúng tôi ti n hành NC: “Nghiên c u hi u
qu c a phác đ ng n/hMG và phác đ ng n/rFSH đ x trí bu ng tr ng đáp
ng kém trong TTTON” v i các m c tiêu sau:
1. ánh giá hi u qu c a phác đ ng n/hMG và phác đ ng n/rFSH đ x trí
bu ng tr ng đáp ng kém trong th tinh ng nghi m t i BVPST .
2. Phân tích m t s y u t liên quan đ n k t qu KTBT - TTTON c a hai phác
đ này.
2
Ý NGH A TH C TI N VÀ ÓNG GÓP M I C A LU N ÁN
NH NG ÓNG GÓP M I C A LU N ÁN
1. Nghiên c u đánh giá hi u qu c a phác đ ng n/hMG và phác đ
ng n/rFSH đ x trí bu ng tr ng đáp ng kém trong TTTON. Phác đ
ng n/hMG cho k t qu t t h n so v i phác đ ng n/rFSH v s noãn trung
bình, ch t l ng phôi đ 3, s phôi đông, s chu k có phôi đông. K t qu
này giúp t ng c h i thành công c a nhóm có bu ng tr ng đáp ng kém
trong TTTON. Phác đ ng n/ hMG là phác đ h ng t i b nh nhân v i
m c đích an toàn, hi u qu và kinh t .
2. Nghiên c u ch ng minh vi c s d ng phác đ ng n b sung LH có trong
hMG v i li u 75IU/ngày không làm nh h ng đ n ch t l ng noãn, đ
dày và hình d ng niêm m c t cung, không gây hi n t ng hoàng th hoá
s m.
3. Nghiên c u đã cho th y đ dày niêm m c t cung, n ng đ P4 ngày hCG
và ch t l ng phôi là các y u t liên quan đ n c t l làm t và t l thai
lâm sàng.
C U TRÚC LU N ÁN
Ngoài ph n đ t v n đ và k t lu n, lu n án g m 4 ch ng: Ch ng 1: T ng
quan tài li u, 36 trang; Ch ng 2:
i t ng và ph ng pháp NC, 17 trang;
Ch ng 3: K t qu NC, 16 trang; Ch ng 4: Bàn lu n, 34 trang. Lu n án có 12
hình, 26 b ng, 8 bi u đ , 3 s đ , 133 tài li u tham kh o (28 tài li u ti ng Vi t, 105
tài li u ti ng Anh).
Ch
ng I. T NG QUAN
1.1. Khái ni m v “c a s LH” trong KTBT
1.1.1.Vai trò c a LH trong m t chu k phát tri n nang noãn t nhiên
LH đ c t ng h p b i các t bào h ng sinh d c thùy tr c tuy n yên. S
ti t LH bình th ng ph thu c vào nh p đi u ch ti t sinh h c c a GnRH, đ c cân
b ng b i c ch feedback âm và d ng. N ng đ estrogen cao pha nang noãn s t o
feedback d ng và n ng đ progesterone cao pha hoàng th s t o feedback âm lên
s ch ti t LH. Nh v y, n u n ng đ LH d i m c t i thi u c n thi t, thì n ng đ
estrogen t ng h p s không đ y đ cho s phát tri n c a nang noãn và c a NMTC.
S phóng noãn: nh LH kh i phát m t chu i các s ki n d n đ n s
phóng noãn: nh LH kích thích ti p t c phân chia gi m nhi m c a noãn, s
hoàng th hoá c a các t bào h t, s t ng h p progesteron và prostaglandin
trong nang. Progesteron làm t ng ho t đ ng c a các men ly gi i cùng v i
prostagladin làm v nang. nh FSH gi a chu k làm cho noãn đ c t do kh i
nang noãn, chuy n plasminogen thành enzym ly gi i protein, plasmin.
LH kích thích s t ng h p androgen t bào v , đ c v n chuy n qua t
bào h t, là ti n ch t t ng h p estrogen t bào h t; làm bu ng tr ng t ng nh y
3
4
c m v i FSH; tr ng thành nang noãn; phóng noãn; gia t ng kh n ng hoàng th
hoá c a nang noãn khi ti p xúc v i hCG; th th LH còn đ c tìm th y trên
NMTC, do đó LH có vai trò trong quá trình làm t c a phôi.
1.1.2. Khái ni m v c a s LH trong KTBT
Các phác đ KTBT trong TTTON đ u c ch LH n i sinh, do đó v m t lý
thuy t m t s tr ng h p c n b sung LH. Th c t có kho ng 10-20% b nh
nhân đáp ng không phù h p v i các phác đ KTBT hi n s d ng đ c cho là
thi u LH. Tuy nhiên đ i t ng nào có l i ích t b sung LH và b sung LH
nh th nào v n còn đ c tranh lu n nhi u. Các NC nh n th y:
LH th p <1,2 mIU/ml: S phát tri n nang noãn b gi m, gi m t ng h p
hormone steroid, không có s tr ng thành noãn hoàn toàn, t l có thai th p .
LH cao >5mIU/ml: Th th LH m t đi do quá trình đi u hoà gi m th th ,
c ch s t ng tr ng c a t bào h t, làm nh h ng đ n k t qu c a TTTON, t l
th tinh và t l làm t kém và t l có thai kém.
1,2mIU/ml < LH < 5mUI/ml: S phát tri n nang noãn t i u và tr ng
thành noãn hoàn toàn.
1.1.3. Các đ i t ng c n b sung LH:
Suy bu ng tr ng trung tâm (nhóm 1 theo phân lo i không phóng noãn
c a T ch c y t Th gi i)
Ti n s bu ng tr ng đáp ng kém (<4 noãn v i KTBT v i phác đ chu n,
li u FSH t i thi u 300IU/ngày)
áp ng bu ng tr ng không t i u trong chu k đang đi u tr : ngày 6 FSH
(không có nang >10mm, E2 < 200pg/ml, NMTC < 6mm)
Tu i ≥ 35
1.2. Các phác đ KTBT trong TTTON
1.2.1. Phác đ gonadotropins đ n thu n
Phác đ này hi n ít dùng do không ki m soát đ c s xu t hi n c a đ nh
LH s m, có th nh h ng x u đ n k t qu KTBT và t l thành công.
1.2.2. Phác đ GnRH agonist + gonadotropins
S d ng FSH đ kích thích s phát tri n c a nang noãn. S d ng GnRH
agonist đ ng n ng a s xu t hi n đ nh LH s m, h n ch hoàn toàn hi n t ng
phóng noãn và hoàng th hóa s m, làm t ng s noãn thu đ c trong m t chu k và
t l noãn tr ng thành cao. Có hai phác đ KTBT ph bi n, đó là phác đ dài và
phác đ ng n.
1.2.3. Phác đ GnRH antagonist + gonadotropins
GnRH antagonist đ c s d ng đ KTBT trong HTSS giúp ng n ng a đ c
đ nh LH. Phác đ này có th i gian KTBT ng n h n, l ng thu c s d ng ít h n so
v i phác đ dài.
1.3. BU NG TR NG ÁP NG KÉM
1.3.1. Khái ni m:
Bu ng tr ng đáp ng kém trong TTTON là tình tr ng s nang noãn v t
tr i vào ngày tiêm hCG và s noãn ch c hút đ c th p. Hi n nay v n ch a có s
th ng nh t trong y v n v tiêu chu n ch n đoán đáp ng kém (low responder, poor
responder). Tuy nhiên nhi u tác gi đã s d ng m t s ng ng sau đ đánh giá
bu ng tr ng đáp ng kém:
Có < 4 nang noãn vào ngày tiêm hCG.
ho c hàm l ng E2 <500 pg/ml vào ngày tiêm hCG.
ho c ch c hút đ c < 4 noãn.
Bu ng tr ng đáp ng kém th ng x y ra nh ng ph n l n tu i (trên 35
tu i), hàm l ng FSH c b n cao và s nang th c p ít, nh ng ng i có ph u thu t
bóc u bu ng tr ng làm gi m th tích mô lành c a bu ng tr ng, nh ng ng i dính
ti u khung n ng ho c b l c NMTC n ng.
1.3.2. Nguyên nhân
T t c nh ng nguyên nhân gây nên gi m d tr bu ng tr ng nh : tu i, ti n s
ph u thu t t i bu ng tr ng ho c ti u khung, l c NMTC, u x t cung... là nh ng
nguyên nhân d n đ n bu ng tr ng đáp ng kém.Tuy nhiên có m t nhóm b nh nhân
có d tr bu ng tr ng bình th ng nh ng bu ng tr ng v n kém đáp ng.
1.3.3. Tiêu chu n ch n đoán
Ch n đoán bu ng tr ng đáp ng kém d a vào s hi n di n c a 1 trong 2 d u
hi u sau:
• S l ng nang noãn trên siêu âm ngày tiêm hCG hay s noãn ch c hút
đ c d i 4 nang.
• N ng đ E2 ngày 6 c a KTBT < 200pg/ml ho c n ng đ E2 ngày tiêm
hCG < 500pg/ml.
1.3.4. Phân lo i đáp ng kém: B nh nhân đáp ng kém th ng m t trong
ba nhóm sau:
B nh nhân có ti n s bu ng tr ng đáp ng kém mà n ng đ FSH c b n
trong gi i h n bình th ng
B nh nhân tr tu i nh ng có n ng đ FSH c b n cao kéo dài
B nh nhân l n tu i và có n i ti t b t th ng
Trong ba nhóm trên ch có 2 nhóm đ u khi thay đ i phác đ đi u tr m i có
kh n ng c i thi n t l thành công. V i nhóm th 3 thì ph ng án đi u tr hi u qu
nh t cho nh ng tr ng h p này là k thu t TTTON xin noãn.
IT
CH
NG 2
NG VÀ PH
NG PHÁP NGHIÊN C U
IT
NG NGHIÊN C U
Bao g m nh ng b nh nhân làm TTTON t i Trung tâm HTSS, BVPST
trong th i gian t tháng 1 n m 2012 đ n tháng 6 n m 2013.
* Tiêu chu n l a ch n:
- Nhóm có ti n s bu ng tr ng đáp ng kém trong TTTON:
( s nang trên siêu âm ngày tiêm hCG ≤ 4 nang, ch c hút ≤ 4 noãn)
2.1.
6
5
- Nhóm có nguy c đáp ng kém khi có 1 trong các d u hi u sau:
• Tu i ≥ 35
• AFC (Antral Follicle Count- Siêu âm đ m nang th c p) < 5 nang
• FSH c b n >10mIU/ml
* Tiêu chu n lo i tr :
- Tu i > 40
- Có ti n s ph u thu t bu ng tr ng
- L c NMTC bu ng tr ng và t cung
- Có b t th ng t cung: u x t cung, t cung x hoá, dính bu ng t cung
- Tinh d ch đ c a ch ng b t th ng
- S l n làm TTON ≥ 3
2.2. PH
NG PHÁP NGHIÊN C U
2.2.1. Thi t k : th nghi m lâm sàng ng u nhiên so sánh hai phác đ
2.2.2. C m u: theo công th c tính c m u cho NC can thi p c a WHO [92]
N
Z1 / 2
2 P 1 P z1 P1 1 P1 P2 1 P2
2
P1 P2 2
- N = s l ng đ i t ng cho m i nhóm
- M c ý ngh a: = 5%, Z1- /2 = 1,96
m nh: 1-=80%, Z1- = 0,84
- P1= 42,3%: t l thai lâm sàng phác đ agonist/hMG theo NC
c a Kolibianakis (2007 t i Bilbao- Spain) [93].
- P2= 30% t l thai lâm sàng c a phác đ agonist/rFSH theo NC
c a Marr R, Scholcaraft (2004 t i Colorado – USA) [94].
- P= (P1 + p2)2/2 = (0,42+ 0,3)2/2 ~ 0,26
Thay s ta có N= 93
D ki n t l hu b đi u tr là 15%.
Nh v y, NC s l y c m u là 110 BN cho m i phác đ .
2.2.3.Các ph ng ti n và v t li u nghiên c u
2.2.3.1. Các thu c đ c s d ng trong nghiên c u
GnRH agonist: GnRH agonist đ c s d ng trong NC này là
triptorelin. Bi t d c c a triptorelin là Diphereline® do công ty
Beaufour Ipsen c a Pháp s n xu t và phân ph i. Thu c đ c tiêm
d i da v i li u 0,1 mg vào ngày 2 c a vòng kinh, 0,5mg/ngày t
ngày 3 c a vòng kinh.
FSH tái t h p (rFSH): rFSH đ c s d ng là Gonal- F® (s n xu t b i
Laboratoires Serono S.A., Th y S , phân ph i t i Vi t Nam b i MerkSerono) hàm l ng 75IU, 300IU, 450IU ho c Puregon® (s n xu t b i
Organon, Hà Lan, phân ph i t i Vi t Nam b i MSD) hàm l ng 50IU,
100IU, 300IU, 600IU. S d ng rFSH b ng đ ng tiêm d i da.
hMG (Human Menopausal Gonadotropins -hMG): hMG đ c s
d ng trong NC là Menogon (Hãng s n xu t và phân ph i - Ferring), hàm
l ng 75 IU (FSH:LH = 1:1) [47]. S d ng đ ng tiêm b p.
hCG :hCG có bi t d c là Pregnyl® hàm l ng 5000 IU (s n xu t b i
công ty Organon, Hà Lan, phân ph i t i Vi t Nam b i công ty MSD). Li u
dùng 5000 IU-10000 IU. S d ng hCG b ng đ ng tiêm b p.
Progesterone (P4): đ c s d ng đ h tr pha hoàng th là Utrogestan®
do công ty Tedis c a Pháp s n xu t có hàm l ng là 100mg, 200 mg. S
d ng Utrogestan b ng đ ng đ t trong âm đ o v i li u dùng là 600 mg
m i ngày.
2.2.4. Các b c ti n hành nghiên c u:
2.2.4.1. Khám lâm sàng và xét nghi m
Tr c khi b t đ u th c hi n các quy trình TTTON, m i c p v ch ng đ u
đ c khám lâm sàng và làm các xét nghi m c b n
2.2.4.2. Các phác đ KTBT
Nhóm hMG (Phác đ ng n/hMG)
- B nh nhân có kinh ngày 2 xét nghi m LH, E2, P4 và siêu âm.
-Tiêm d i da Diphereline 0,1mg vào ngày 2 c a chu k kinh.
- T ngày 3 c a chu k kinh, tiêm d i da ½ ng Diphereline 0,1mg và hMG. Li u
kh i đ u FSH 300IU/ngày (225IU rFSH + 75IU hMG).
Nhóm rFSH: Phác đ ng n/rFSH
- B nh nhân có kinh ngày 2 xét nghi m LH, E2, P4 và siêu âm.
- Tiêm d i da Diphereline 0,1mg vào ngày 2 c a chu k kinh.
- T ngày th 3 c a chu k kinh, tiêm d i da ½ ng Diphereline 0,1mg và rFSH.
Li u kh i đ u c a rFSH là 300IU/ngày.
2.2.4.3.Theo dõi s phát tri n c a nang noãn
Theo dõi s phát tri n c a nang noãn b ng siêu âm đ ng âm đ o và các xét
nghi m n i ti t.
Siêu âm nang noãn vào các th i đi m: ngày 8, ngày 10 ho c ngày 11... sau khi
tiêm rFSH. Khi có ít nh t m t nang noãn có đ ng kính ≥ 18 mm trên siêu âm
thì tiêm b p hCG 10000 IU đ tr ng thành noãn.
Xét nghi m các ch s n i ti t E2, LH, P4 vào các th i đi m: ngày 2, ngày 7,
ngày 10 sau khi tiêm FSH và ngày tiêm hCG.
2.2.4.4. Hút noãn
Hút noãn đ c ti n hành sau khi tiêm hCG 34-36 gi .
2.2.4.5. Chu n b tinh trùng
7
Ng i ch ng kiêng xu t tinh 3 - 5 ngày và l y tinh trùng vào ngày ng i
v ch c hút noãn, tinh trùng đ c l c r a theo ph ng pháp thang n ng đ sau đó s th
tinh v i noãn.
2.2.4.6. Ph ng pháp th tinh: ICSI: Ph ng pháp th tinh b ng cách tiêm tinh
trùng vào bào t ng c a noãn
2.2.4.7. Chuy n phôi vào bu ng t cung: Chuy n phôi vào bu ng t cung ngày 3
sau khi hút noãn d i s h ng d n c a siêu âm đ ng b ng.
2.2.4.8. H tr pha hoàng th
H tr pha hoàng th b ng Utrogestan đ t âm đ o v i li u m i ngày 600
mg, b t đ u ngay sau hút noãn.
2.2.4.9. Xác đ nh có thai
nh l ng hCG 14 ngày sau chuy n phôi. N u có thai thì siêu âm
xác đ nh túi thai 4 tu n sau chuy n phôi. Xác đ nh s túi thai và s ho t đ ng
c a tim thai.
2.2.5. Các tiêu chu n đánh giá liên quan đ n nghiên c u
ánh giá BMI: BMI = cân n ng(kg)/chi u cao2 (m): (1) BMI: < 18,5: th p
cân; (2) BMI: 18,5-22,9: bình th ng; (3)BMI: ≥ 23: d cân.
Tiêu chu n v tinh d ch đ bình th ng: WHO 1999
Tiêu chu n xác đ nh đ dày NMTC:Siêu âm đ u dò âm đ o đ xác đ nh
NMTC m t c t d c gi a c a t cung và đo đ dày NMTC kho ng cách
l n nh t tính t ranh gi i gi a NMTC và c t cung.
ánh giá s th tinh:16-18 gi sau khi ICSI. Noãn đã th tinh là khi có 2
ti n nhân quan sát d i kính hi n vi đ o ng c.
Xác đ nh t l th tinh = s noãn th tinh/ t ng s noãn ICSI.
ánh giá ch t l ng phôi: Tiêu chu n Ariff Bongso [98]
Xác đ nh t l làm t = t ng s túi i/t ng s phôi chuy n.
Xác đ nh có thai sinh hóa: nh l ng hCG trong máu 2 tu n sau chuy n
phôi. N u hCG < 25 IU/l là không có thai. Thai sinh hóa là khi có thai xác
đ nh b ng hCG ≥ 25 IU/l nh ng không phát tri n thành thai lâm sàng.
Xác đ nh có thai lâm sàng:Thai lâm sàng đ c xác đ nh khi có hình nh túi
i trên siêu âm đ ng âm đ o sau chuy n phôi 3 tu n.
T l thai lâm sàng/chuy n phôi = s tr ng h p có thai lâm sàng/s
tr ng h p chuy n phôi.
Bu ng tr ng đáp ng kém: khi có ≤ 4 nang noãn có kích th c ≥ 14 mm
vào ngày tiêm hCG ho c có ≤ 4 noãn sau khi ch c hút.
áp ng bình th ng v i KTBT: là các tr ng h p không có các d u
hi u c a h i ch ng quá kích bu ng tr ng và không bao g m các tr ng
h p đáp ng kém.
8
Ch
ng 3. K T QU NGHIÊN C U
3.1. TÍNH
NG NH T C A HAI PHÁC
B ng 3.1. Tính đ ng nh t c a hai phác đ v đ c đi m đ i t
c đi m chung
Nhóm hMG
n
(%)
34,2 ± 4,3
8,3 ± 4,9
20,6 ± 2,1
6,4 ± 2,0
Tu i trung bình (n m)
FSH c b n (IU/L)
BMI
AFC (nang)
ng NC
Nhóm rFSH
n
(%)
35,1 ± 5,7
8,0 ± 2,7
20,1 ± 1,9
5,8 ± 1,9
p
0,9
0,4
0,9
0,7
B ng 3.2. Tính đ ng nh t c a hai phác đ v đ c đi m NC
c đi m chung
Nguyên nhân
L n tu i
Gi m DTBT
Ph i h p
Ti n s đáp ng kém
Không
Có
Nhóm hMG
n
(%)
Nhóm rFSH
n
(%)
21
32
43
19,1
29,1
39, 1
23
27
44
34
76
30,9
69,1
33
77
20,9
24,5
40,0
30
70
p
0,8
0,9
3.2. ÁNH GIÁ HI U QU C A HAI PHÁC
B ng 3.3. ánh giá k t qu KTBT
c đi m chu k KTBT-TTON
T
T
T
T
l
l
l
l
thai lâm sàng
hu chu k
đáp ng kém
th tinh trung bình
Nhóm hMG
n
(%)
18
16,4
6
5,5
35
31,18
Nhóm rFSH
n
(%)
15
13,6
5
4,6
41
37,27
p
0,72
0,63
0,58
B ng 3.4. ánh giá k t qu KTBT
c đi m chu k KTBT-TTON Nhóm hMG
Nhóm rFSH
n
(%)
n
(%)
S ngày tiêm FSH (IU/L)
9,11 ±0,69
9,41±0,93
T ng li u FSH (IU/L)
3063,75±387,04 3586,36±462,02
NMTC trung bình (mm)
10,79±2,2
11,65±3,4
S noãn trung bình
5,44±2,59
4,77±2,35
s noãn th tinh TB
81,04±20,20
76,45± 27,63
p
0,34
0,05
0,15
0,32
0,61
10
9
3.3. THEO DÕI S
E2
(pg/ml)
BI N
I N I TI T TRONG QUÁ TRÌNH KTBT
ng/m
Bi u đ 3.1. S thay đ i n ng đ E2
LH
(IU/L)
Bi u đ 3.4.
ánh giá s thay đ i n ng đ P4
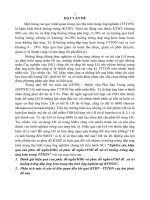
S noãn
3
2,5
2,5
2
1,9
1,5
1,5
1,7
1,3 1,2
1
0,5
0
Bi u đ 3.3. S thay đ i n ng đ LH
Bi u đ 3.5. ánh giá ch t l
ng noãn c a hai phác đ
11
S phôi
12
3.3. CÁC Y U T LIÊN QUAN
N K T QU TTTON C A HAI PHÁC
3.3.1. Các y u t liên quan đ n đáp ng kém v i KTBT
B ng 3.5. Mô hình h i quy logistic đa bi n liên quan đ n bu ng tr ng đáp ng kém
Các y u t liên quan
(các bi n đ c l p)
Bi u đ 3.5. Ch t l
ng phôi c a hai nhóm
Bi u đ 3.8. T l thai lâm sàng/chuy n phôi
áp ng kém
(bi n ph thu c)
Kho ng tin c y 95% (CI)
OR
≥ 35
Tu i
2,23
1.1 – 4.8 (*)
< 35
≥ 23
BMI
1,39
0,5 – 4,1
<23
≥ 10
FSH c b n
2,31
1,1 – 4,7 (*)
(IU/l)
< 10
≤5
AFC
2,9
1.1 – 8,3 (*)
(nang)
<5
≤ 300
E2 ngày 7
12,9
5.6 – 67,8 (*)
> 300
(pg/ml)
≤ 1000
E2 ngày hCG
1,2
0,7 – 2,2
(pg/ml)
> 1000
≤ 1,2
LH ngày 7
2,55
1,1 – 5,68 (*)
(IU/l)
> 1,2
≤ 1,2
LH ngày hCG
0,77
0.3 - 1.8
> 1,2
(IU/l)
>1
P4 ngày 7
0,34
0.3 - 1.5
(nmol/l)
≤1
> 1,5
P4 ngày hCG
1,75
0.9 – 3,9
≤ 1,5
(nmol/l)
(*): S khác bi t có ý ngh a th ng kê v i p < 0,05
Khi tu i trên 35, nguy có bu ng tr ng đáp ng kém cao g p 2,23 l n so
v i nhóm có tu i d i 35. Nhóm có s nang th c p AFC d i 5 nang có nguy c
đáp ng kém cao g p 2,9 l n so v i nhóm có s nang th c p AFC trên 5 nang.
B nh nhân có hàm l ng E2 ngày 7 ≤ 300 pg/ml có nguy c đáp ng kém cao
g p 12,9 l n so v i b nh nhân có E2 ngày 7 > 300 pg/ml.
14
13
3.3.2. Các y u t liên quan đ n s noãn
B ng 3.6. Mô hình h i quy đa bi n c a tu i, FSH ngày 3, s nang ≥ 14 mm và
hàm l ng E2 ngày hCG đ i v i s l ng noãn
S noãn (Y)
Coefficient
Std Err
p
95% CI
Tu i
-0,062
0,021
0,004
-0,104 ; -0,020
FSH ngày 3
-0,047
0,038
0,002
-0.121 ; 0,027
S nang ≥ 14
0,891
0,049
< 0,001
0,795 ; 0,987
E2 ngày hCG
0,00008
0,00007
0,0001
-0,00006 ; 0,0002
Constant
2.511
Constant: h ng s . Coefficient: h s . Std Err: sai s chu n. R2 = 60%
Ph ng trình h i quy đa bi n v tác đ ng c ng đ ng c a các bi n đ c l p
nh tu i, FSH ngày 3, s nang ≥ 14 mm, và E2 ngày hCG đ i v i bi n ph thu c
(s noãn):
Y(s noãn) =a +b. (tu i) + c.(FSH ngày3) +d. (s nang ≥ 14 mm) + e.(E2 ngày hCG)
V i a = 2,511; b = – 0,062; c = – 0,047; d = 0,891; e = 0,00008
Ph ng trình Y (s noãn) t ng quan ngh ch bi n v i s tu i, n ng đ FSH
ngày 2 và t ng quan đ ng bi n v i s noãn ≥ 14mm và n ng đ E2 vào ngày tiêm
hCG. Do đó, tu i càng cao, FSH ngày 3 càng cao thì s noãn hút đ c càng ít. S
nang ≥ 14 mm, n ng đ E2 ngày hCG càng cao thì s noãn thu đ c càng nhi u.
p < 0,05 và R2 = 60% cho th y ph ng trình này có ý ngh a r t cao đ đánh
giá s noãn theo các y u t nêu trên.
3.3.3. Liên quan gi a n ng đ E2 và s noãn
B ng 3.7. Liên quan gi a n ng đ E2 và s noãn
E2 ngày hCG
(pg/ml)
≤ 1000
1001 - ≤ 2500
2501 - ≤ 3500
3501 - ≤ 4500
> 4500
T ng s
S noãn c a nhóm hMG
S noãn c a nhóm rFSH
n
X ± SD
n
X ± SD
3
29
41
21
16
110
6,00 ± 3,61
4,69 ± 1,95
5,61 ± 2,51
6,71 ± 2,47
8,13 ± 1,89
P=0,001
9
35
26
18
22
110
1,56 ± 0,88
3,66 ± 1,98
5,15 ± 1,41
6,17 ± 2,26
6,64 ± 2,65
P=0,001
p
0,01
0,72
0,56
0,23
0,18
i v i c hai nhóm hMGvà rFSH, s noãn trung bình t ng lên theo n ng
đ E2 ngày hCG. N ng đ E2 ngày hCG càng cao thì s noãn càng nhi u. S t ng
lên khác bi t có ý ngh a th ng kê v i p = 0,001
3.3.4. Các y u t liên quan đ n t l làm t
B ng 3.8. Các y u t liên quan đ n t l làm t
Các y u t
OR
95% CI
>8
NMTC (mm)
1,39
0,4 – 5,1
≤8
≤ 1,5
P4 ngày hCG
1,47
0,6 -3,5
(nmol/l)
> 1,5
≥1
S phôi đ 3
<1
7,66
1,1-15,6 (*)
<5
(*): S khác bi t có ý ngh a th ng kê v i p < 0,05
Các y u t liên quan đ n t l làm t đ c xem xét là NMTC, n ng đ P4,
s phôi đ 3. T l làm t
nhóm có ít nh t 1 phôi đ 3 cao h n 7,66 so v i nhóm
không có phôi đ 3, s khác bi t có ý ngh a th ng kê v i p <0,05.
3.3.5. Các y u t liên quan đ n t l có thai lâm sàng
B ng 3.9. Mô hình h i quy logistic đa bi n liên quan đ n t l có thai lâm sàng
T l có thai lâm sàng
Các y u t liên quan
Kho ng tin c y
Bi n đ c l p
OR
95% CI
< 35
Tu i
2,48
1,2 – 5,3
≥ 35
< 23
BMI
4,8
0.6 – 99,3
(kg/m2)
≥ 23
< 10
FSH c b n (IU/l)
2,6
1,1 – 5,8
≥ 10
>8
dày NMTC (mm)
3,0
1.1 - 8.7 (*)
≤8
>4
S noãn
1,1
0.3 - 4
≤4
> 1000
E2 ngày hCG (pg/ml)
0,4
0.1 - 1.2
≤ 1000
> 1,2
LH ngày hCG
1,3
0.5 – 3,3
(IU/l)
≤ 1,2
< 1,5
P4 ngày hCG
1,8
1.1 - 3.2 (*)
(nmol/l)
≥ 1,5
>3
S phôi chuy n
3,1
0.9 - 10.1
≤3
≥1
S phôi đ 3
3,2
1.5 - 7.2 (*)
<1
(*): S khác bi t có ý ngh a th ng kê v i p < 0,05
15
16
Kh n ng có thai nh ng b nh nhân có đ dày NMTC > 8 mm cao g p 3
l n so v i ng i có NMTC ≤ 8 mm.
Kh n ng có thai nh ng b nh nhân có P4 ngày hCG ≤ 1,5ng/ml cao g p
1,8 l n so v i ng i có P4 ngày hCG > 1,5ng/ml
Kh n ng có thai nh ng b nh nhân có ít nh t 1 phôi đ 3 cao g p 3,2 l n
so v i ng i không có phôi đ 3 nào.
c a nhóm hMG cao h n so v i nhóm rFSH (6,0 ± 2,5 so v i 4,7 ± 2,4), s khác
bi t có ý ngh a th ng kê v i p=0,02. K t qu c a NC th p h n so v i NC c a V
Minh Ng c (2006) có s noãn thu đ c là 8,3 ± 4,7. S d có k t qu này có th do
s l a ch n đ i t ng NC khác nhau. Tuy nhiên đây c ng là k t qu kh quan c a
NC khi s d ng hMG trong KTBT v i nhóm đáp ng kém.
4.13. Bàn lu n v t l h y chu k c a hai phác đ
B ng 3.9 cho th y t l chu k có phôi chuy n nhóm hMG là 94,6%,
nhóm rFSH là 95,5%, s khác bi t không có ý ngh a th ng kê v i p>0,05. Nhóm
hMG có 4 tr ng h p không đ c chuy n phôi vì lý do noãn không th tinh, 2
tr ng h p ch c hút không có noãn. Nhóm rFSH, có 5 tr ng h p ch c hút có
noãn nh ng noãn không th tinh nên không có phôi chuy n. Nh v y nhóm hMG
ch còn 104 b nh nhân và nhóm rFSH còn 105 bênh nhân đ c chuy n phôi. T l
h y chu k c a hai nhóm t ng ng là 5,4% và 4,5%, không có ý ngh a th ng kê
(p>0,05). T l hu chu k trong NC c a chúng tôi cao h n so v i NC c a Nguy n
Xuân H i (2011) là 1,4%, c a V Minh Ng c là 2,6. S khác bi t này là do s l a
ch n đ i t ng NC khác nhau gi a các NC.
4.2. BÀN LU N V S THAY
I C A CÁC HORMON TRONG QUÁ
TRÌNH KTBT C A HAI PHÁC
4.2.1. Bàn lu n v s thay đ i hàm l ng E2
Xét nghi m đánh giá n ng đ E2 trong máu là xét nghi m th ng quy và r t
c n thi t trong quá trình theo dõi s phát tri n c a nang noãn khi KTBT, có giá tr
trong vi c đánh giá t c đ phát tri n nang noãn và s tr ng thành c a noãn.
E2 c b n t ng có th tiên l ng bu ng tr ng đáp ng kém. Ngay c khi
FSH còn trong gi i h n bình th ng, n u E2 v t quá 75 ho c 80 pg/ml kh n ng
có thai gi m rõ r t. D tr bu ng tr ng đ c coi là gi m khi n ng đ E2 c b n
>75pg/ml . N ng đ E2 c b n c a chu k t ng đ ng gi a hai nhóm sau đó t ng
lên trong quá trình KTBT. N ng đ E2 ngày 7 FSH t ng nhanh, s khác bi t có ý
ngh a th ng kê gi a hai nhóm v i p<0,05. Tuy nhiên ngày tiêm hCG n ng đ E2
c a hai nhóm hMG và rFSH t ng đ ng là 2855,3 ± 1561,4 và 2708,4 ± 1490,3
khác bi t không có ý ngh a th ng kê v i p>0,05. ây là m t k t qu r t kh quan
c a NC vì n ng đ E2 s t ng ng v i s noãn và ch t l ng noãn. K t qu này
s xin đ c bàn lu n thêm ph n các y u t liên quan.
4.2.2. Bàn lu n v s thay đ i n ng đ LH
S d ng LH có trong hMG khi n các nhà lâm sàng luôn đ t ra câu h i liên
quan đ n đ nh LH và hi n t ng hoàng th hoá s m. Tuy nhiên bi u đ 3.3 cho
th y, n ng đ LH c a c hai nhóm gi m rõ r t sau khi s d ng GnRH agoinist và
ti p t c gi m đ n ngày 7 c a FSH và duy trì t i ngày tiêm hCG. N ng đ LH c
b n vào ngày 3 chu k cao h n nhóm hMG (6,3 ± 0,6) so v i nhóm rFSH (4,9 ±
2,2) s khác bi t ch a có ý ngh a th ng kê v i p>0,05. Vào ngày tiêm hCG, n ng
đ LH c a hai nhóm t ng đ ng nhau..
LH cao vào ngày đ u KTBT s làm bu ng tr ng t ng nh y c m v i FSH,
t ng kh n ng chiêu m nang noãn, t ng s noãn. i u này lý gi i k t qu c a NC
Ch
ng 4. BÀN LU N
4.1. BÀN LU N V K T QU KTBT C A HAI PHÁC
K t qu KTBT c a hai phác đ đ c đánh giá và bàn lu n bao g m: áp ng
c a bu ng tr ng, s noãn thu đ c sau ch c hút, t l hu chu k .
4.1.1. Bàn lu n v đáp ng c a bu ng tr ng
áp ng c a bu ng tr ng tùy thu c vào đ c đi m c a b nh nhân, các kh o
sát đánh giá d tr bu ng tr ng, phác đ KTBT và li u FSH ban đ u. Vi c l a
ch n phác đ và li u FSH phù h p d a trên các đ c đi m c a b nh nhân s giúp
b nh nhân có đ c đáp ng phù h p. Ngoài ra vi c theo dõi s phát tri n c a nang
noãn, theo dõi s bi n đ i n i ti t trong quá trình KTBT giúp các nhà lâm sàng có
nh ng đi u ch nh h p lý đ có đ c đáp ng bu ng tr ng t i u, thu đ c noãn có
ch t l ng t t.
Tiêu chu n bu ng tr ng đáp ng kém trong NC đ c tính khi có d i 4 nang
noãn thu đ c sau ch c hút noãn. T l đáp ng bình th ng c a nhóm hMG là
63,6%, c a nhóm FSH là 58,2%, s khác bi t ch a có ý ngh a th ng kê v i p>0,05.
T l đáp ng kém trong NC này cao h n so v i các NC khác Vi t Nam. Tác gi
V ng Th Ng c Lan NC t i B nh vi n Ph s n T D n m 2002, t l đáp ng kém
là 22,7%. Tác gi V Minh Ng c NC t i BVPST n m 2006 th y t l đáp ng kém
c a phác đ dài là 22,6%. S khác bi t này là do đ i t ng NC là nhóm có ti n s
ho c nguy c đáp ng kém ch không ph i là nhóm có tiên l ng đáp ng bu ng
tr ng bình th ng. C ng do đ c đi m này mà c hai nhóm NC đ u không có tr ng
h p nào b quá kích bu ng tr ng.
Tuy nhiên khi l a ch n đ i t ng vào NC thì s b nh nhân có ti n s đáp ng
kém t chu k TTTON tr c chi m 69,1% nhóm hMG và 70% nhóm rFSH. Sau
khi s d ng hai phác đ này thì t l đáp ng kém gi m xu ng ch còn là 36,4%
nhóm hMG và 41,8% nhóm rFSH. ây là k t qu có giá tr nh t c a NC khi s
d ng hai phác đ này nói chung và s d ng hMG trong KTBT nói riêng. Ngoài ra k t
qu này còn mang tính nhân v n cao c , giúp t ng c h i có thai b ng chính noãn c a
mình cho nh ng ph n hi m mu n tr c khi đi đ n gi i pháp cu i cùng là TTTON
xin noãn.
4.1.2. Bàn lu n v s noãn thu đ c c a hai phác đ
M t trong nh ng m c đích c a KTBT là t ng s noãn thu đ c. Ch đ nh
tiêm thu c hCG gây tr ng thành noãn khi có ít nh t 1 nang kích th c ≥ 18mm
ho c có 2 nang ≥ 17mm. K t qu NC cho th y m c dù s nang kích th c ≥14mm
ngày tiêm hCG không khác bi t gi a hai nhóm nh ng s noãn trung bình thu đ c
17
18
có t ng s noãn thu đ c nhóm hMG so v i nhóm rFSH. LH th p vào ngày 7
FSH và ngày hCG đã ch ng t đ c vai trò c ch LH c a GnRH agonist. K t qu
này c a NC làm c ng c thêm ni m tin cho các nhà lâm sàng khi s d ng hMG
trong kich thích bu ng tr ng.
4.2.3. Bàn lu n v s thay đ i n ng đ P4
ánh giá di n bi n s thay đ i n ng đ P4 cho th y: P4 t ng d n t ngày 2
chu k đ n ngày 7 FSH và ngày tiêm hCG. Tuy nhiên n ng đ P4 vào ngày tiêm
hCG gi a hai nhóm hMG và rFSH t ng ng là 1,4 ± 0,7 và 1,3 ± 0,4. S khác bi t
không có ý ngh a th ng kê v i p>0,05. i u này ch ng minh đ c vi c s d ng
LH có trong hMG cùng v i GnRH agonist không làm t ng n ng đ P4 huy t thanh
ngày tiêm hCG.
Tóm l i, phân tích s thay đ i n ng đ E2, LH, và P4 đã ch ng minh đ c
phác đ ng n agonist k t h p v i hMG và rFSH không làm t ng đ nh LH trong quá
trình KTBT. K t qu này góp thêm b ng ch ng và kinh nghi m v vi c s d ng
hMG trong phác đ KTBT trong TTTON.
4.3. BÀN LU N V K T QU TTTON C A HAI PHÁC
.
4.3.1. Bàn lu n v ch t l ng noãn gi a hai phác đ
Ph ng pháp th tinh s d ng trong NC là ICSI , ph ng pháp này ch th c
hi n đ c trên noãn tr ng thành (noãn MII). Do đó vi c thu đ c noãn tr ng thành
là m c đích cu i cùng c a KTBT. B ng 3.12 cho th y s noãn tr ng thành trung bình
cho c 3 lo i t t, trung bình và x u nhóm hMG là t ng ng là 2,5; 1,9; 1,3 xu h ng
cao h n so v i nhóm rFSH là 1,5; 1,7; 1,2, tuy nhiên s khác bi t ch a có ý ngh a th ng
kê v i p>0,05. Vi c thu đ c nhi u noãn tr ng thành h n nhóm hMG giúp t ng s
phôi thu đ c, t ng s phôi đông và t ng c h i thành công c a m t chu k TTTON.
4.3.2. Bàn lu n v s noãn th tinh và t l th tinh trung bình
S noãn th tinh và t l th tinh là k t qu t ng h p c a ch t l ng noãn,
ch t l ng tinh trùng và ph ng pháp th tinh. S noãn th tinh và t l th tinh
trung bình c a NC có xu h ng cao h n nhóm hMG so v i nhóm rFSH, s khác
bi t ch a có ý ngh a th ng kê v i p>0,05. NC c a Safdarian th c hi n ICSI 100%
cho t l th tinh c a nhóm hMG là 97,7% t ng đ ng v i nhóm rFSH là 98,9%,
cao h n NC c a chúng tôi (79,4% và 67,6%). Vì ch t l ng tinh trùng và k thu t
th tinh là nh nhau, t l th tinh s ph thu c vào ch t l ng noãn. Nhóm có ti n
s đáp ng kém và nguy c đáp ng kém th ng có s l ng và ch t l ng noãn
kém h n so v i nhóm có đáp ng bình th ng, đi u này lý gi i t l th tinh c a
nhóm NC th p h n so v i các NC khác. Tuy nhiên s noãn thu đ c sau ch c hút
c a nhóm hMG cao h n có ý ngh a th ng kê so v i nhóm rFSH nên có th lý gi i
t l th tinh có xu h ng cao h n nhóm hMG so v i nhóm rFSH.
4.3.3. Bàn lu n v s phôi và ch t l ng phôi c a hai phác đ
S phôi trung bình thu đ c c a nhóm hMG và nhóm rFSH t ng ng là
4,2 ± 2,3 và 3,6 ± 2,0, s khác bi t ch a có ý ngh a th ng kê v i p>0,05. K t qu
c a NC th p h n so v i NC c a V Minh Ng c (6,7± 3,9) và c a Nguy n Xuân
Huy (6,6 ± 3,1) do đ i t ng NC khác nhau.
V i s phôi trung bình th p d i 5 phôi th ng ch đ đ chuy n phôi t i,
không có phôi tr . Tuy nhiên đi u khác bi t gi a hai nhóm là ch t l ng phôi. s
phôi đ 3 nhóm hMG cao h n có ý ngh a th ng kê so v i nhóm rFSH v i p<0,05
(3,1 ± 1,9 so v i 2,6 ± 1,6) và c ng cao h n so v i ph i đ 2 và đ 1. S phôi đ 3 là
phôi có ch t l ng t t nh t, bao g m các phôi bào đ ng đ u và không có m nh v .
i u này s r t có ý ngh a đ gi m s phôi chuy n, t ng c h i có phôi đông, đ m
b o t l thành công c a chu k TTTON và gi m t l đa thai.
4.3.4. Bàn lu n v s phôi chuy n c a hai phác đ
S phôi chuy n t i u là làm t ng t l có thai và gi m t l đa thai vì đa
thai trong TTTON s gây ra nh ng bi n ch ng nh t ng t l quá kích bu ng
tr ng nh ng ng i có nguy c , t ng kh n ng s y thai, đ non, ti n s n gi t ...
Theo khuy n cáo c a Hi p h i Sinh s n Hoa K , n u tu i d i 35, s phôi nên
chuy n ≤ 3 phôi. N u tu i t 35-40 thì s phôi nên chuy n ≤ 4 phôi. N u tu i trên
40 thì s phôi nên chuy n ≤ 5 phôi. N u ch t l ng phôi t t thì gi m s phôi
chuy n đ tránh đa thai.
Vi t Nam, ch a có quy đ nh v h n ch s l ng phôi chuy n trong m i
chu k . T i trung tâm HTSS c a BVPST , s l ng phôi chuy n trong m t chu k
đi u tr trong các NC th ng là 4 phôi. Nh ng b nh nhân l n tu i, đã t ng th t b i
v i nh ng l n làm TTTON tr c đó th ng đ c chuy n nhi u phôi h n. Tuy
nhiên, v i nh ng ti n b v các k thu t HTSS hi n nay, cùng v i s phát tri n
trong vi c nuôi c y phôi và t l có thai cao có th cho phép gi m s l ng phôi
chuy n trong m i chu k .
T l chuy n 3 phôi vào bu ng t cung chi m t l cao nh t trong c hai
nhóm, 46,2% nhóm hMG và 37,1% nhóm rFSH, s phôi chuy n trung bình c a 2
nhóm t ng ng là 2,5 ± 1,2 và 2,7 ± 1,2, tuy nhiên s khác bi t ch a có ý ngh a
th ng kê v i p>0,05. S phôi chuy n trong NC này th p h n so v i NC c a V ng
Th Ng c Lan (3,4 ± 1,4) và t ng đ ng so v i NC c a Dal Prato v i s phôi
chuy n nhóm hMG là 2,2 ± 0,6 và nhóm rFSH là 2,2 ± 0,5.
S d có s khác bi t này là do s phôi đ 3 c a nhóm hMG cao h n có ý
ngh a th ng kê so v i nhóm rFSH (p<0,05), và c ng lý gi i cho vi c s phôi
chuy n trung bình c a nhóm hMG th p h n so v i nhóm rFSH. Nhóm đáp ng
kém s noãn thu đ c th ng th p, vi c có nhi u phôi đ 3 đ gi m đ c s phôi
chuy n s làm t ng c h i có phôi đông, t ng t l có thai c ng d n cho m t chu k
TTTON.
4.3.5. Bàn lu n v s phôi đông và t l chu k có phôi đông c a hai phác đ
S phôi đông trung bình c a nhóm hMG là 2,5 ± 1,2 và c a nhóm rFSH là
1,6 ± 1,3. S khác bi t có ý ngh a th ng kê v i p = 0,03 (p<0,05). K t qu này cao
h n so v i NC c a V ng Th Ng c Lan khi NC b sung rLH trên nhóm bu ng
tr ng đáp ng kém (1,8 ± 1,0 và 1,1 ± 0,8). Nhóm hMG có 41 tr ng h p đông
phôi, nhóm rFSH có 28 tr ng h p đông phôi. T l đông phôi c a nhóm hMG là
39,4% và c a nhóm rFSH là 26,7%. S khác bi t v t l đông phôi gi a hai nhóm
có ý ngh a th ng kê v i p = 0,05 (p<0,05).
19
20
Vi c t ng s phôi đông và t ng t l chu k có phôi đông giúp t ng t l thai
c ng d n c a m t chu k KTBT- TTTON. ây l i ích kinh té c a nhóm hMG so
v i nhóm rFSH mà NC ghi nh n đ c, gi m chi phí đi u tr cho nhóm đáp ng
kém trong TTTON.
4.3.6. Bàn lu n v t l làm t c a hai phác đ
T l làm t đ c tính b ng t s gi a s túi thai và s phôi chuy n vào
bu ng t cung. T l làm t v a ph n ánh đ c ch t l ng phôi, phôi t t có kh
n ng phát tri n thành túi thai, v a ph n ánh đ c ch t l ng c a NMTC đ ti p
nh n s phát tri n c a phôi.
T l làm t c a nhóm hMG là 23,2 cao h n so v i nhóm rFSH là 16,% v i
p>0,05 (b ng 3.9). T l này th p h n so v i NC c a Nguy n Xuân H i (2008) là
41,3% và 39.9% khi so sánh gi a hai phác đ [109]. i u này lý gi i do đ i t ng
NC khác nhau.
Nh v y qua NC v bi n đ i n ng đ n i ti t trong quá trình KTBT, ch t
l ng noãn, đ dày và hình nh NMTC, t l làm t cho th y hi u qu khi s d ng
LH có trong hMG trong KTBT v i nhóm có nguy c đáp ng kém.
4.3.7 Bàn lu n v k t qu thai nghén c a hai phác đ
Thai sinh hóa: Thai sinh hoá là các tr ng h p th hCG ≥ 25IU/L sau
chuy n phôi 14 ngày nh ng sau đó siêu âm không có túi i trong bu ng t cung và
hàm l ng hCG gi m d n. B ng 3.17 cho th y t l thai sinh hoá nhóm hMG là
2,7% và rFSH là 3,6%, s khác bi t ch a có ý ngh a th ng kê v i p>0,05. So sánh
v i các NC tr c cho th y k t qu này c ng t ng đ ng v i các tác gi khác và
không th y khác bi t gi a các phác đ trên các đ i t ng NC.
Ch a ngoài t cung: Khác v i thai sinh hoá, thai ch a ngoài t cung
có hàm l ng hCG t ng cao t i vài nghìn đ n v , siêu âm sau chuy n phôi 4-5
tu n không th y có túi thai trong bu ng t cuung. B ng 3.17 cho k t qu t l
thai ch a ngoài t cung gi a hai nhóm t ng ng là 0,9% và 1,8%, t ng
đ ng v i các tác gi khác.
S y thai và thai l u: NC c a Nguy n Xuân Huy t l s y thai nói
chung c a TTTON là 7,7%, thai l u là 3.1% . S y thai và thai l u trong HTSS
ph thu c vào phác đ TTTON và phác đ h tr pha hoàng th . K t qu c a
NC có t l s y thai và thai l u xu h ng th p h n so v i các NC khác. Nh
v y, s h tr hoàng th t i BVPST là h p lý và có hi u qu .
4.3.8. Bàn lu n v t l thai lâm sàng: NC có 220 chu k KTBT và có 220 chu k
hút noãn. Do v y, t l có thai /chu k c ng chính là t l có thai/s ch c hút noãn.
T l thai lâm sàng c a nhóm hMG và nhóm rFSH t ng ng là 16,4% và 13,6% v i
p>0,05. NC có 6 tr ng h p nhóm hMG và 5 tr ng h p nhóm rFSH không có
phôi chuy n. Nh v y, t l thai lâm sàng/chuy n phôi c a nhóm hMG có xu h ng
cao h n so v i nhóm rFSH (22,1% và 17,1%) v i p>0,05. So sánh v i các NC tr c
thì k t qu thai lâm sàng c a NC th p h n, co th do đ i t ng NC khác nhau.
4.3.9. Bàn lu n v giá tr ng d ng lâm sàng c a hai phác đ
* Bàn lu n v t l t ng gi m li u FSH
Trong KTBT, t ng li u FSH khi bu ng tr ng có nguy c đáp ng kém, gi m
li u FSH khi b nh nhân có nguy c có h i ch ng quá kích bu ng tr ng đ đ m b o
quy n l i và an toàn cho b nh nhân. Ch đ nh t ng li u FSH khi có d i 5 nang
noãn có kích th c ≤ 13 mm trên siêu âm và hàm l ng E2 < 300 pg/ml vào ngày 7
FSH. Ch đ nh gi m li u FSH khi có > 10 nang noãn m i bên bu ng tr ng có
kích th c ≥ 14 mm và hàm l ng E2 ≥ 2500 pg/ml vào ngày 7 FSH.
Trong c hai nhóm đ u không có tr ng h p nào gi m li u.T l t ng li u
FSH nhóm hMG có xu h ng gi m h n so v i nhóm rFSH (2,7% và 6,4%),
khác bi t gi a hai nhóm không có ý ngh a th ng kê v i p>0,05.Tác gi PopovicTodorovic c ng th c hi n t ng ho c gi m li u vào ngày 8 FSH [110], t l t ng li u
rFSH là 31% cao h n so v i NC c a chúng tôi. i u này cho th y vi c quy t đ nh
li u FSH ban đ u cho đ i t ng NC là khá phù h p.
Nhóm hMG có 3 b nh nhân t ng li u thêm 2 ngày, m i ngày 50IU FSH.
V i nhóm rFSH có 3 b nh nhân t ng li u thêm 3 ngày, 4 b nh nhân t ng li u thêm
2 ngày, m i ngày 50IU FSH. T l b nh nhân t ng li u FSH, s ngày t ng li u,
t ng li u t ng gi a hai nhóm khác bi t ch a có ý ngh a th ng kê gi a v i p>0,05.
K t qu NC cho th y không c n t ng quá nhi u FSH/ngày c ng đ t đ c m c đích
KTBT khi đã có li u kh i đ u chính xác.
*Bàn lu n v giá tr kinh t khi so sánh gi a hai phác đ
Chi phí đ làm TTTON có th lên t i vài ch c tri u đ ng bao g m các chi
phí v thu c KTBT, các lo i môi tr ng nuôi c y, v t li u đ th c hi n k thu t
ch c hút noãn, ICSI, chuy n phôi. Vi c gi m chi phí đi u tr có ý ngh a vô cùng
quan tr ng vì giúp gi m gánh n ng kinh t cho b nh nhân và gi m nguy c t b
đi u tr . Trong khi các môi tr ng, v t t tiêu hao không khác bi t gi a các b nh
nhân thì vi c gi m chi phí đi u tr ch có th làm đ c t vi c gi m chi phí dùng
thu c trong quá trình KTBT.
K t qu c a NC cho th y nhóm hMG không khác bi t so v i nhóm rFSH v
các đ c đi m và k t qu c a chu k KTBT. Tuy nhiên nhóm hMG có t ng li u FSH
th p h n có ý ngh a th ng kê so v i nhóm rFSH. Trên th tr ng hMG l i có gi
thành r h n so v i rFSH cùng đ n v . i u này làm gi m chi phí dùng thu c.
Ngoài ra s noãn thu đ c, s phôi đ 3, s phôi đông và s chu k có phôi đông
nhóm hMG t ng có ý ngh a th ng kê so v i nhóm hMG giúp t ng t l thành công
và t ng t l có thai c ng d n trên m t chu k KTBT. Nh v y s ti t ki m đ c
chi phí đi u tr cho m t l n KTBT.
V i k t qu trên thì vi c s d ng hMG trong KTBT trên nhóm đáp ng kém
s d t hi u qu kinh t h n so v i nhóm rFSH.
21
22
4.3. BÀN LU N V CÁC Y U T LIÊN QUAN
N K T QU TTTON
4.3.1. Bàn lu n v các y u t liên quan đ n đáp ng kém v i KTBT
Phân tích h i quy đa bi n c a các y u t v tu i, AFC, BMI, FSH c b n,
E2 ngày 7, E2, LH, P4 ngày hCG v i t l đáp ng kém cho th y:
Khi tu i trên 35, nguy c bu ng tr ng đáp ng kém cao g p 2,23, l n so v i
nhóm có tu i d i 35. Nhóm có s nang th c p AFC <5 có nguy c đáp ng kém
cao g p 2,9 l n so v i nhóm AFC>5. B nh nhân có n ng đ FSH c b n >10IU/l
có nguy c đáp ng kém g p 2,31 l n so v i nhóm có n ng đ FSH c b n ≤
10IU/l v i 95%CI (1,1-4,7).
H u h t các NC đ u công nh n tu i là m t trong nh ng y u t nh h ng
l n nh t đ n s sinh s n c a ph n , tu i càng cao thì d tr c a bu ng tr ng s
càng gi m, đáp ng c a bu ng tr ng c ng gi m, làm cho kh n ng th thai gi m
theo.Trong m t kh o sát v đánh giá k t qu k thu t HTSS đ c báo cáo vào
tháng 12/6/2009 t i M c a Saswati Sunderam thì nh ng ph n ≤ 35 tu i t l
có thai là 45%, trong khi đó tu i>42 t l có thai ch là 7%.
Xét nghi m E2 ngày 7 là xét nghi m n i ti t đ u tiên sau khi tiêm FSH. Do
v y E2 ngày 7 là m t xét nghi m s m có giá tr đ tiên l ng nguy c bu ng tr ng
đáp ng kém và th i đi m này c ng là th i đi m c n thi t đ th y thu c lâm sàng
đi u ch nh t ng li u FSH đ đ t đ c hi u qu t i u trong KTBT. E2 ngày 7 ≤
300pg/ml thì nguy c đáp ng kém cao h n nhóm có n ng đ E2 ngày
7>300pg/ml còn l i là 12,9 l n.
Nh v y tu i, AFC, n ng đ FSH ngày 3, E2 ngày 7 và LH ngày 7 có giá
tr tiên l ng đáp ng kém v i p <0,05.
4.3.2. Bàn lu n v các y u t liên quan đ n s noãn
Phân tích h i quy đa bi n đ đánh giá s tác đ ng c ng đ ng c a tu i, FSH
ngày 3, s nang noãn ≥ 14 mm, E2 ngày hCG đ i v i s noãn ch c hút đ c. M i liên
quan này đ c th hi n b ng ph ng trình:
Y (s noãn) = a + b.(tu i) + c.(FSH ngày 3) + d.(s nang ≥ 14 mm) + e.(E2 ngày hCG)
V i a = 2,511; b = (– 0,062); c = (– 0,047); d = 0,891; e = 0,00008
Ph ng trình Y (s noãn) t ng quan ngh ch bi n v i s tu i, n ng đ FSH
c b n và t ng quan đ ng bi n v i s noãn ≥ 14mm và n ng đ E2 vào ngày tiêm
hCG. Do đó, tu i càng cao, FSH c b n càng cao thì s noãn hút đ c càng ít. S
nang ≥ 14 mm, hàm l ng E2 ngày hCG càng cao thì s noãn thu đ c càng nhi u.
p<0,05 và R 2 = 60% cho th y ph ng trình này có ý ngh a r t cao đ đánh giá s
noãn theo các y u t nêu trên.
S noãn không ch liên quan liên quan ngh ch bi n v i tu i và FSH c b n
mà còn liên quan đ ng bi n v i s nang th c p (AFC). Nhi u NC đã đánh giá s
nang th c p b ng siêu âm đ u dò âm đ o xác đ nh vào đ u chu k kinh nguy t đ
tiên l ng s đáp ng c a bu ng tr ng và s noãn.
4.3.3. Bàn lu n v liên quan c a n ng đ E2 v i s noãn
B ng 3.23 và bi u đ 3.9 cho th y E2 càng t ng thì s noãn càng nhi u, s
khác bi t có ý ngh a th ng kê v i p<0,05. M i t ng quan s noãn và E2 đ c th
hi n b ng ph ng trình Y (s noãn) = 0,000867 x E2 ngày hCG + 2,988, v i a =
0,000867; b = 2,988; H s t ng quan R= 0,619.N ng đ E2 càng cao thì s noãn
thu đ c càng nhi u.
4.3.4. Bàn lu n v các y u t liên quan đ n t l làm t
K t qu c a NC cho th y đ dày NMTC không nh h ng đ n t l làm t .
Tuy nhiên trên th c t còn có nhi u y u t nh h ng đ n t l làm t . NC c a
chúng tôi s d ng các bi n đ c l p xét liên quan đ n t l làm t là NMTC, hàm l ng
P4 ngày hCG, s phôi đ 3, h tr phôi thoát màng, đi m chuy n phôi. Theo k t qu
NC thì ch có bi n s phôi đ 3 là có liên quan đ n t l làm t . Nhóm có ít nh t 1 phôi
đ 3 thì có t l làm t cao g p 7,66 l n so v i nhóm không có phôi đ 3, s khác bi t
có ý ngh a th ng kê v i p<0,05 (95%CI 1,1-15,6).
Các NC g n đây còn ch ra m i liên quan gi a n ng đ P4 ngày tiêm hCG
v i t l làm t . NC m i đây c a Kilicdag n m 2010 NC trên 1045 chu k
IVF/ICSI v i GnRH agonist, so sánh nh ng b nh nhân có t ng P4>1,1 ng/ml v i
nh ng b nh nhân có P4≤ 1,1 ng/ml, cho th y nh ng b nh nhân có t ng P4 t l làm
t th p h n (18,1% so v i 24.4% p = 0,008) và t l sinh s ng th p h n (27,6% so
v i 40%, p = 0.004). NC c ng cho th y P4 ngày hCG ≤ 1,5 nmol/l cho t l làm
t cao h n 1,47 l n so v i các tr ng h p có t ng P4>1,5 nmol/l, tuy nhiên s
khác bi t ch a có ý ngh a th ng kê (OR = 1,47; 95% CI = 0,6-3,5). i u này
ch ng t LH có trong hMG không nh h ng đ n t l làm t .
4.3.5. Bàn lu n v các y u t liên quan đ n t l thai lâm sàng
Phân tích h i quy đa bi n c a các y u t v tu i, BMI, FSH c b n, đ dày
NMTC, s noãn, E2, LH, P4 ngày hCG, s phôi chuy n và ch t l ng phôi đ i v i
t l thai lâm sàng. Ch có 3 y u t là NMTC, P4 ngày hCG và ch t l ng phôi có
liên quan v i t l thai lâm sàng.
Hai y u t nh t nh h ng cu i cùng đ n k t qu c a m t chu k TTTON
đó là ch t l ng phôi chuy n và s ti p nh n c a NMTC. Giá tr tiên l ng c a đ
dày nôi m c t cung có th đ c đo trên siêu âm và b t k ngày nào trong chu k
đi u tr nh ng ngày tiêm hCG có ý ngh a h n c vì lúc này noãn đã đ c xác đ nh
tr ng thành. Có nhi u công trình NC c ng đo NMTC vào th i đi m này nh c a
V ng Th Ng c Lan, Bruffi RLR, Oliveira JBA.
T i trung tâm HTSS c a BVPST c ng đo NMTC ngày tiêm hCG. NC
c ng ch ra r ng t l có thai nh ng b nh nhân có đ dày NMTC > 8 mm cao g p
3 l n so v i ng i có NMTC ≤ 8 mm (OR = 3,0; 95% CI = 1.1 - 8.7). Xác đ nh liên
quan gi a t l có thai v i các ng ng giá tr c a đ dày NMTC, NC c a Kovacs
th y r ng t l có thai nhóm có đ dày ≥ 10 mm cao h n có ý ngh a th ng kê
nhóm có đ dày < 10 mm (OR = 1,3; 95% CI = 1,0-1,7, p < 0,05). NC c a V ng
Th Ng c Lan (2012) c ng cho th y đ dày t cung>10mm cho t l có thai lâm
sàng cao h n.
23
24
Cho t i nay, giá tr tiên l ng c a P4 đ i v i kh n ng có thai là ch đ còn
nhi u tranh lu n. M t s tác gi cho r ng không có liên quan gi a hàm l ng P4
ngày hCG v i t l có thai (Abuzeid 1996, Urman 1999, Martinez 2004). NC c a
Bosch k t lu n r ng hàm l ng progesteron ≤ 1,5 ng/ml thì t l có thai ti n tri n
cao h n có ý ngh a th ng kê so v i n ng đ P4> 1,5 ng/ml. NC c a chúng tôi cho
th y t l có thai nh ng b nh nhân có P4 ngày hCG ≤ 1,5 nmol/ml cao g p 1,8
l n so v i ng i có P4 ngày hCG>1,5nmol/ml, (OR = 1,8; 95% CI = 1,1-3,2).
T l có thai nh ng b nh nhân có t i thi u 1 phôi ch t l ng t t (phôi đ 3)
cao g p 3,2 l n so v i ng i không có phôi đ 3 nào (OR = 3,2; 95% CI = 1,5-7,2).
NC phân tích h i quy logistic n m 2003 c a Shen t i M cho th y các y u
t có giá tr tiên l ng đ i v i kh n ng có thai c a các b nh nhân đ c th c hi n
ICSI bao g m tu i c a b nh nhân, E2 ngày hCG, s phôi chuy n và ch t l ng
phôi. Tuy nhiên NC c a Shen là NC h i c u và không đ a ra đ c ng ng giá tr
tiên l ng
Nh v y, NC đã cho th y đ dày NMTC, n ng đ P4 ngày hCG và ch t l ng
phôi là các y u t liên quan đ n c t l làm t và t l thai lâm sàng.
3. Các y u t liên quan đ n k t qu TTTON:
Tu i, FSH ngày 3, AFC, E2 ngày 7, LH ngày 7 là nh ng y u t liên quan
đ n bu ng tr ng đáp ng kém.
S noãn thu đ c có liên quan ngh ch bi n v i tu i, FSH c b n và liên
quan đ ng biên v i s nang >14mm và n ng đ E2 ngày tiêm hCG.
Ch t l ng phôi đ 3 liên quan đ n t l làm t (cao h n g p 7,66 l n
nhóm có ít nh t 1 phôi đ 3 so v i nhóm không có phôi đ 3).
NMTC > 8 mm, ho c P4 ngày tiêm hCG ≤ 1,5 nmol/l ho c có ít nh t 1
phôi đ 3 cho t l có thai t ng h n so v i nhóm NMTC <8mm, P4 ngày hCG
>1,5nmol/ml, không có phôi đ 3 l n l t là 3 l n, 1,8 l n và 3,2 l n.
NMTC, n ng đ P4 ngày hCG và ch t l ng phôi là y u t nh h ng đ n
c t l làm t và t l thai lâm sàng.
K T LU N
Sau khi NC hi u qu c a phác đ ng n/hMG và phác đ ng n/rFSH đ x
trí bu ng tr ng đáp ng kém trong TTTON t i BVPST , chúng tôi xin đ a ra các
k t lu n sau:
1. Phác đ ng n/hMG cho k t qu t ng đ ng so v i phác đ ng n/rFSH v :
S đáp ng c a bu ng tr ng, đ dày c a NMTC, s nang noãn ≥ 14mm
ngày tiêm hCG.
S phôi trung bình: 4,2 ± 2,5 so v i 3,6 ± 2,0.
T l th tinh: 79,4% so v i 67,6%.
T l làm t : 23,2% so v i 16,07%.
T l thai lâm sàng/chu k : 20,1% so v i 16,4%.
T l thai lâm sàng/chuy n phôi: 22,1% so v i 17,1%.
2. Phác đ ng n/hMG cho k t qu t t h n có ý ngh a th ng kê so v i phác đ
ng n/rFSH v :
S noãn trung bình: 6,0 ± 2,5 so v i 4,9 ± 2,5.
Ch t l ng phôi (s phôi đ 3): 3,1 ± 1,9 và 2,2 ± 1,6.
S phôi đông: 2,5 ± 1,2 so v i 1,6 ± 1,3.
S chu k có phôi đông: 39,4% so v i 26,7% .
T ng li u FSH: 3082,3 ± 40,7 so v i 3563,6 ± 48,0.
Gi m t l đáp ng kém trên nh m có ti n s đáp ng kém
Gi m chi phí đi u tr
KI N NGH
T k t qu NC c a lu n án này, chúng tôi xin đ a ra m t s ki n ngh nh sau:
1.Nên áp d ng phác đ ng n/hMG đ KTBT cho nhóm b nh nhân có ti n s
đáp ng kém ho c có nguy c bu ng tr ng đáp ng kém trong TTTON.
2.C n có nh ng NC thêm v hMG v i các nhóm b nh nhân và v i các phác
đ KTBT khác.
3.S d ng hàm l ng E2 ngày 7 là m t y u t tiên l ng s m nguy c
bu ng tr ng đáp ng kém n u E2 ≤ 300 pg/ml đ các th y thu c có th t ng li u FSH
phù h p v i s đáp ng c a bu ng tr ng.
BACKGROUND
One of the most important phase of the procedure of IVF is the stimulation of the
ovary. Under the activity of the stimulation on the ovary, about 80% of cycles
display the suitable responses activities, but 10-20% is deficit or less responses, 924% is the rate of less responses of ovarian stimulation. Therefore, the number of
collected, transferred fetuses, the rate of success are decreased and the cost of
treatment increased.
Experimental and clinical evidences demonstrate the role of the LH in the optimum
development and the perfect growth of the ova and the induce of ovulation. Studies
demonstrate that the complement of LH for the groups of less responsiveness to
ovarian stimulation increase the successful rate of the cycles of IVF. However,
diverse studies gave the different results because of the choice of the subjects of
25
study and the designs and the diverse dimensions of studying samples, thus confirm
the effective methods.
The Department of the Reproduction Assistance at the Central Hospital of
Obstetrics and Gynecology is the biggest center of IVF in North Vietnam. With the
long procedure the patients of less responsiveness possessed by 21%. The short
procedure of agonist combining with FSH or FSH+LH is the first choice in the
patients with less responsiveness. LH maybe recombinant LH or human
Menopausal Gonadotropin. There is no simple preparation of recombinant LH on
market, there is only high price FSH preparations- in combining with recombinant
LH in the rate of 2:1. Thus, LH in hMG is the preparation of choice for
complementing of LH. However, this is a preparation of controversial needing the
physician’s experience. What is the effect of LH on the patients with less
responsiveness group? What is the relation between the complementing of LH and
the cause of the risk of early luteinizing. What is its influence on the mucous
membrane of the uterus and the rate of fecundation. Responding such those
questions for discovering the effective procedure to stimulate the less
responsiveness cases in IVF, we perform the studies on the effective procedures of
treating the cases focusing these objectives:
1. To evaluate the effect of the short protocol/hMG and the short
protocol/rFSH for treating ovary responds poorly in in vitro
infertilization at in the National Hospital of Obstetrics and Gynecology.
2. To analyse some factors involving in the results of ovarian stimulation in IVF.
26
1.
2.
3.
Practical meaning and new contributions of the thesis
The effect of short protocol/HMG and the short protocol/rFSH on the poor
responder in IVF was evaluated.The short protpcol/HMG gave the higher
result in comparing with the short protocol/rFSH concerning the average
of ova, the quality of fetus of 3rd grade, the amount of freeze fetuses, the
cycles processing freeze fetuses. The results increase the chances of with
the own ovule for the group of patients with the less responsiveness
ovarian stimulation.The short protocol/HMG is the procedure manifest the
noble humanist, safe, effective and economical.
Dose 75 IU LH in HMG does not manifest the negative effect on the
quality of the ovule, the thickness and the form of the uterus does not
induce the early luteinizing.
Study demonstrated the use of a short regimen LH supplementation in a
dose hMG 75IU per day not affect oocyte quality, thickness and shape of
the uterine lining, causing no royal phenomenon som 4 materialize.
Structure of the thesis
A part from the foreword and conclusion, structure of this thesis consist of 4 part:
Part 1: Review, 36 pages; Part 2: Subject and method, 17 pages; Part 3: Requests,
16 pages; Part 4: Discussion, 34 pages; 12 images, 26 tables, 8 graphs, 3 schemes,
133 preference (28 English and 105 Vietnamese).
Part 1: Review
1.1. Scientific notion of Ovarian stimulation
Ovarian stimulation is an approach making the premature follicles develop to
mature follicles growing a large number of strong follicles, then collect them for
IVF. The mechanism of this development of the follicles and the growth of
estradiol level in this process is explained through the notion of FSH threshold, LH
ceiling and the system of 2 cells, 2 gonadotropins.
1.1.1. FSH threshold
FSH manifests an important role in process of choice selecting and make the
follicle surpassed. Certain quantity of excreted FSH is needed to make the
developed follicle defined as FSH threshold. For diverse follicle, FSH is not
identical, thus for numerous follicles, FSH must be surpassed over the less sensitive
follicles. Therefore, the growing of FSH in the beginning phase of the cycle is a
key factor for selecting the necessary follicles. Maintaining FSH surpassed level to
the mature period of follicle is the important factor of controlled ovarian
stimulation.
1.1.2. LH Ceiling
27
28
LH receptor exists on the cells of the peel and appears on the cells of the seed once
a stimulation has a complete effect on the seed cells, marking the seed cell ripened
in the follicle before the ovulation appeared immediately to LH. Experimental and
clinical trials express that the development of the follicle does not need LH but LH
possess the role of completing the growth of the follicle, inducing the ovulation.
LH is needed in the synthesis of estradiol and maintaining the surpassed of the
follicles. The clinical trial demonstrate that the ovarian stimulation in surplus doses
of LH give the negative influences on the normal development of the follicles. In
diverse stages of development, surpassing the ceiling level will inhibit the seed cell,
inducing the degeneration of the premature follicle and make early luteinizing
before ovulation of follicles.
1.1.3. Two cells, two gonadotropins system
The system composes of seed cells and peel cells. The system of 2 gonadotropins
composes of FSH and LH. FSH combining with their receptor on seed cell,
stimulating their development of the follicles and inducing the activity of aromatase
enzyme. LH link with its receptor in the peel, stimulation its production of
androgene. Under the effect of aromactasa enzyme androgene transformer to
estradiol. Estrogen induce the link with LH, making the maturation of follicles
inducing the ovulation and the development of lutein.
1.2. “LH window” in the ovarian stimulation
1.2.1. The role of LH in a cycle of natural development of the follicle
LH was synthesized by the genitotrophic cells in the anterior lobe of the
hydrothalamus gland. Normal secretion of LH depends on the biological secretion
of GmRH, balanced by the positive and negative feedback. High level of estogene
in the ovum phase make the positive feedback and high level of progesterone in the
lutein phase making negative phase. Thus, the LH low level under the minimum
nedd level, the synthetized estrogen level will be not enough for the development
of the follicles and the mucus of the uterus.
Ovulation: Top induces a series of events forward the ovulation. Top LH
stimulates the consecutive meiosis dividing of the ovum, the luteinizing og the sedd
cells, the synthsin of progesterone ad prostaglandin in the follicles.
Progesteron increases the action of the lysto-enzym and with prostaglandin maker
the follicle broken. Top FSH appeared in the mid-cycle liberates the follicl,
transforming plasminogene to proteolytic enzyme, plasmin.
LH stimulates the synthesis of androgene in the peel cells, transported through the
seed cell. It is the precursor for the synthetizing estrogen in the seed cell, make the
ovary more sensitive to FSH, making the follicle matured, making ovulation in
meeting hCG it increase the luteinizing. LH receptor also exist in the mucous the
membrane of the uterus. Therefore, LH exprimes the role in ovulation.
1.2.2. The notion of LH window in the stimulation of the ovary
All scheme of ovarian stimulation in IVF inhibit the production of LH, therefore,
theoretically, in some cases, its supplement is necessary. Practically in 10-20% of
patients, the responsiveness to current schemes of ovarian stimulation is in
appropriate.
LH is not enough, but the completing is in controversy
Studies show that
LH < 1.2 mIU/ml: follicles is under developed steroid
hormone is less symthetized the growth of follicle is in perfect, with a
low rate of fecundation.
LH > 5 mIU/ml: LH receptor decreased inhibit the
growth of seed cell, less fecundation in IVF.
1,2 mIU ≤ LH < 5 mIU/ml optimum development of follicle,
perfect growth.
1.2.3. The case needed a completing of LH
Degeneration of the control ovary (group I following WHO classification)
Previously, less responsiveness to ovarian stimulation (4 follicles
with ovarian stimulation following the standard scheme, minimum dose of
FSH of 300 IU/day)
Non optima ovarian responsiveness in the treatment cycle: 6 FSH
a day (no follicle > 10 mm, E2 < 200 pg/ml, uterus mucous membrane < 6
mm)
Age ≥ 35.
1.3. The scheme of ovarian stimulation in IVF
Ovarian stimulation agent used to reach the maximum mature follicles in each
cycle of ovarian stimulation. Then stimulation the last phase of follicle
development, in this moment, planing the moment od removing the follicles.
1.3.1. The scheme of simple gonadotropin
hMG or simple FSH to ovarian stimulation in IVF began to early 8th decade of this
century. The scheme is using scarcely because of the scarce of the early controlled
appearance of top LH, making bad consequense of ovarian stimulation and the rate
of success. Therefore, currently the schemes of ovarian stimulation in IVF must be
combining with FSH and GnRH or GnRH antagonist.
1.3.2. The scheme of GnRH against and gonadotropins
FSH stimulates the development of the follicle, while GnRH agonist hinders the
appearance of early LH top, entirely limit the ovulation and early LH top, entirely
limit the ovulation and early luteinization, increase the sum of collected ovum in
each cycle and mature follicles. There are 2 schemes of ovarian stimulation:
The short and the long protocols.
29
30
Long protocol (down regulation protocol subcutaneous injection of
0.1mg diphereline in continuous 14 days, beginning at the 21th day or the
first day of menstrual cycle and then diphereline doses decreases by 1/2 part
(to 0.05 mg). This combining prolong 10-12 days up to get at 1 follicle of
diameter of ≥ 18mm (in the ultrasound image), then use hCG to stimulate
the growing of the follicle. After 36 hours of gathering of follicles transfer
the fetus at the 2nd or 3rd day. This is the standard protocol for the patients
of prognosis with the normal responsiveness to ovarian stimulation, the
must using protocol in the centers of reproduction aid. In the year of 2003,
at the central Hospital of Gynecology and Obstetrics, this protocol was
applied at 85.7% of the cycles of IVF and rate of clinical fecundation got
34.8%.
Short protocol ( flare up protocol )
Dipherelin is given in the 2nd day of this cycle, from the 3rd day, it decreases to
0.05 mg combining with FSH. Follow the development of follicle, get it and
transfer the fetus as in the long protocol. This protocol used to applied at the () of
the risk of less responsiveness to ovarian stimulation.
1.3.3. The scheme of GnRH antagonist gonadotropin
Recently, GnRH antagonist used for ovarian to limit top LH. The time of stimulation is
shorter with less quantity of the medicine. In comparing with GnRH agonist 2 schemes
do not show the statistic significant difference in limiting the top LH. GnRH antagonist
give a less rate of severe surpass stimulation than GnRH agonist protocol but the rate of
clinical fecundation is less than in the GnRH antagonist.
Currently, the most common scheme of ovarian stimulation is the of GnRH agonist
in combining with gonadotropin and the protocol of GnRH antagonist in combining
with gonadotropin.
1.4. Poor response to ovarian stimulation
1.4.1. Definition
Poor response to ovarian stimulation for in vitro fertilization is the condition where
the number of superior follicles on day of hCG injection and retrieved oocytes is
low. Currently there is no consensus in the medical documents about the criterion
to diagnose poor response (low responder, poor responder). However, many
authors have used a number of thresholds to evaluate a poor response to ovarian
stimulation as the following:
There are < 4 follicles on the day of hCG injection.
Content of E2 <500 pg/ml on the day of hCG injection.
Number of retrieved oocytes < 4.
Poor response to ovarian stimulation usually occurs in older women (over 35
years), high levels of basic FSH and low antral follicle count (AFC), those with
surgery to remove ovarian tumor tissues causing reduction of volume of healthy
tissues of ovary, those have severe pelvic or endometriosis.
1.4.2. Causes
All causes of reduction of ovarian reserve such as: age, history of ovarian or pelvic
surgery, endometriosis, uterine fibroids ... is those leading to poor response to
ovarian stimulation. However, there is a group of patients with normal ovarian
reserve but still poor ovarian response.
1.4.3. Standard for diagnosis
Diagnosis of poor response to ovarian stimulation is based on the presence of 1 of 2
signs:
• The number of follicles on ultrasound scan on the day of hCG injection or number
of retrieved oocytes less than 4.
• E2 concentration on the 6th day of ovarian stimulation <200pg/ml or E2
concentration on the day of hCG injection <500pg/ml.
1.4.4. Classification of poor response: Poor responders are commonly in one of
three groups:
• Patients with a history of poor ovarian response but the basic FSH concentration
is in the normal range
• Younger patients but have basic FSH concentration last long
• Older patients with abnormal endocrine
In three groups above, only the first two groups when changing treatment regimens
are capable of improving the success rate. With the 3rd group, the most effective
treatment options for these cases is the technique of in vitro fertilized with donated
ovule.
CHAPTER 2
SUBJECT AND METHODOLOGY
2.1. Subject of study
Including patients of in vitro fertilization in the Assisted Reproduction Center, National
Hospital of Obstetrics and Gynecology from January 2012 to June 2013.
* Standards of selection:
- Patients with a history of poor ovarian response in in vitro fertilization
(Number of follicles on ultrasound scan on the day of hCG injection ≤ 4, retrieved
oocyte ≤ 4)
- Groups at risk of poor response when there is one of the following signs:
• Age ≥ 35
• AFC (Antral Follicle Count) <5 follicles
• Basic FSH> 10mIU/ml
- Husband's semen analysis is normal
- The number of times to do IVF ≤ 3
* Exclusion criteria:
31
32
- Age> 40
- With a history of ovarian surgery
- Endometriosis in the uterus and ovary
- There are abnormalities in the uterus: uterus fibroids, fibred uterus, uterine stick
- Husband's semen analysis is abnormal
- The number of times to do IVF ≥ 3
2.2. Methodology
2.2.1. Design of study: Random clinic test with control group
2.2.2. Sample size: according to formula to calculate sample size for interference
study of WHO [92]
• HMG group: with short course with hMG supplementation
• rFSH group (control group): with short-course combining use of rFSH
2. Monitoring the development of follicles in ultrasound scan and hormone testing.
3. Mature ovule with hCG.
4. Oocyte aspiration and flush out sperm.
5. Oocyte quality assessment
6. Perform fertilization techniques by Intra-cytoplasmic Sperm (ICSI).
7. Assessing the quality of embryos
8. Transfer embryos into the uterus: 3rd day embryo transfer.
9. Luteal phase support.
10. hCG test to determine pregnancy and ultrasound to monitor the fetal development.
11. Assessing the results of ovarian stimulation of two courses:
• The response of the ovaries, number of follicles ≥ 14 mm on the day of hCG
injection
• The number of retrieved ovules, embryos
• The number of good embryos (embryo grade 3).
• The number of embryos to be frozen.
• The rate of biochemical pregnancy, rate of clinical pregnancy.
• Factors related to the outcome of in vitro fertilization.
2.3. Data analysis
• Compare the difference of mean values between the two groups by T-test and
Mann-Whitney test for normally distributed variables and abnormally distributed
variables.
• Compare the difference of the mean values of the 3 groups by Anova test.
• The mean values are expressed as Mean ± SD.
Compare the difference between the ratios by Chi-square test.
Multivariate regression analysis to evaluate factors related to the
response of the ovaries, number of retrieved ovules, implantation rate and
clinical pregnancy rate.
p <0.05 indicates significant difference statistically.
2.4. Ethics of study
Use of short course with LP supplementation is one of the measures to tackle poor
response to ovarian stimulation for in vitro fertilization. The study is to find
effective measures with poor responser group aiming to bring opportunities of
pregnancy with her own ovule for infertilation patients before having to take oocyte
IVF with donored ovule. This is greatly humanitarian.
The study outline has been adopted and approved by the scientific council of the
Hanoi Medical University to be conducted at the Assisted Reproduction Center, the
National Hospital of Obstetrics and Gynecology. The patient was fully consulted
N
Z1 / 2
2P 1 P z1 P11 P1 P2 1 P2
2
P1P2 2
N = number of subjects for each group
Significance weight: = 5%, Z1- /2 = 1,96
- Strength: 1-=80%, Z1- = 0,84
- P1= 42,3%: clinic rate in short-cource/ hMG under the study
of Kolibianakis (2007 in Bilbao- Spain) [93].
- P2= 30% clinic pregnancy rate in short-course/rFSH under study
of Marr R, Scholcaraft (2004 in Colorado – USA) [94].
- P= (P1 + p2)2/2 = (0,42+ 0,3)2/2 ~ 0,26
Replace with number, we have N= 93
Expected treatment canceling rate is 15%.
Therefore, the study will take sample size of 110 patients for each course.
2.2.3. Steps of study
2.2.3.1. Clinic examination and testing
Before starting the implementation of in-vitro fertilization, each couple has clinical
examination and basic laboratory tests
• For the wife:
general gynecological examination.
Tests: HBsAg, TPHA, HIV, Chlamydia, blood counts,
blood chemistry, basic endocrine tests FSH, LH, E2 on the 2nd day or the 3rd
day of the menstrual cycle.
Ultrasound scan of the uterus and two ovaries.
• For the husband:
Male general medical examination.
Tests: HBsAg, TPHA, HIV and semen.
2.2.3.2. Steps of study
After completing records of infertility treatment, the study subjects are eligible for
selection criteria and exclusion criteria will be treated according to the following
steps:
1. Grouping study group by layered sample random selection:
33
34
Assess the E2 concentration changes
E2 (pg/ml)
on the use of ovarian stimulation drugs, procedures of in vitro fertilization, the risk
of ovarian hyperstimulation, poor ovarian response, fertilization ability, clinical
pregnancy possibility the pregnancy outcome of in vitro fertilization. The patient
agreed to participate in the study and signed a commitment agreement to take in
vitro fertilization.
The patient information is kept confidential, used only for study purposes but not
used for any other purpose.
Chapter 3. STUDY OUTCOME
3.1. The homogeneousness of two protocols
Table 3.1. The homogeneousness of two protocols on research object feature
Average age (year)
Basic FSH (IU/L)
BMI
AFC (follicle)
hMG group
X ± SD
34,2 ± 4,3
8,3 ± 4,9
20,6 ± 2,1
6,4 ± 2,0
rFSH group
X ± SD
35,1 ± 5,7
8,0 ± 2,7
20,1 ± 1,9
5,8 ± 1,9
p
0,9
0,4
0,9
0,7
3.2. Assess the effectiveness of the two protocols
3.2.1. Assess the result of ovarian stimulation of the two protocols
Diagram 3.1. Concentration changes E2
Assessment LH concentration changes
LH (IU/ L)
General features
Table 3.2. Assess the result of ovarian stimulation
Diagram 3.2. Concentration changes LH
rFSH group
p
n
(%)
n
(%)
Rate of clinical pregnance
23
22,1
18
17,1
0,5
Rate of cycle delimination
6
5,4
5
4,5
0,9
Poor response rate
40
36,4
46
41,8
0,5
Average
Number of FSH (IU/L) injection days
Total dose FSH (IU/L)
9,4 ± 0,7
9,1 ± 0,9
3082,3 ± 387,0 3586,6 ± 462,0
0,9
0,05
Average NMTC (mm)
10,8 ± 2,2
11,5 ± 3,3
0,2
Average number of ovuls
6,0 ± 2,5
4,9 ± 3,3
0,002
3,9 ± 2,1
0,08
Average number of IVF ovuls
4,5 ± 2,5
3.2.2. Assess the hormonal changes during ovarian stimulation
Assess the P4 concentration changes
ng/ ml
hMG group
Cycle feature KTBT-TTON
Diagram 3.3. Assessment of concentration changes P4
3.2.3 Assessment of ovul quality of the two protocols
35
36
3
2,5
2.5
1,9
2
S noãn
1,5
1,7
1,3 1,2
1.5
hMG
rFSH
1
0.5
0
T t
Trung bình
X u
Diagram 3.4. Assessment of ovuls quality of the two protocols
S phôi
3.2.4. Assessing the quality of embryos of the two protocols
Diagram 3.5. Quality of embryos of the two groups
3.2.5. Assess the clinical pregnancy rate of the two protocols
Diagram 3.6. Clinical pregnancy rate /Embryo transfer
3.3. Factors related to the outcome of in vitro fertilization of the two protocols
3.3.1. Factors related to poor response to ovarian stimulation
Table 3.4. Multivariante regression model related to poor response to ovarian stimulation
PaAoor response
Related factors
(dependent difference)
(independent difference)
OR
Reliable range 95% (CI)
≥ 35
Age
2,23
1.1 – 4.8 (*)
< 35
≥ 23
BMI
1,39
0,5 – 4,1
<23
≥ 10
BasicFSH
2,31
1,1 – 4,7 (*)
(IU/l)
< 10
≤5
AFC
2,9
1.2 – 8,3 (*)
<5
(follicle)
≤ 300
E2 day 7
12,9
5.6 – 67,8 (*)
(pg/ml)
> 300
≤ 1000
E2 day hCG
1,2
0,7 – 2,2
(pg/ml)
> 1000
≤ 1,2
LH day 7
2,55
1,1 – 5,68 (*)
(IU/l)
> 1,2
≤ 1,2
LH day hCG
0,77
0.3 - 1.8
(IU/l)
> 1,2
>1
P4 day 7
0,34
0.3 - 1.5
(nmol/l)
≤1
> 1,5
P4 day hCG
1,75
0.9 – 3,9
(nmol/l)
≤ 1,5
(*): Statistical difference with p < 0,05
37
38
When the age is above 35, the risk of a poor response to ovarian stimulation is
2.23 times higher than the age group under 35. Group with number of
antral follicle count (AFC) under 5 has risk of poor respond 2.9 times higher than
the group has the number of antral follicle count (AFC) above 5. Patients with E2
concentration on the 7th day ≤ 300 pg 7 day/ml at risk of poor response 12.9
times higher than those with E2 concentration on the 7th day > 300 pg / ml.
3.3.2. Factors related to number of ovules
Table 3.5. Multivariante regression model of age, FSH day 3, Number of
follicls ≥ 14 mm and concentration E2 day hCG to number of ovules
S noãn (Y)
Coefficient
Std Err
p
95% CI
Tu i
-0,062
0,021
0,004
-0,104 ; -0,020
FSH ngày 3
-0,047
0,038
0,002
-0.121 ; 0,027
S nang ≥ 14
0,891
0,049
< 0,001
0,795 ; 0,987
E2 ngày hCG
0,00008
Constant
2.511
0,00007
0,0001
(pg/ml)
n
≤ 1000
3
6,00 ± 3,61
9
1,56 ± 0,88
0,01
1001 - ≤ 2500
29
4,69 ± 1,95
35
3,66 ± 1,98
0,72
2501 - ≤ 3500
41
5,61 ± 2,51
26
5,15 ± 1,41
0,56
3501 - ≤ 4500
21
6,71 ± 2,47
18
6,17 ± 2,26
0,23
> 4500
16
8,13 ± 1,89
22
6,64 ± 2,65
0,18
T ng s
110
P=0,001
110
P=0,001
-0,00006 ; 0,0002
nd
The equation Y (number of ovules) correlated negatively with age, 2 day FSH
concentration and correlated positively with the number of ovules ≥ 14mm and E2
concentrations on the day of hCG injection. Therefore, the older you are, the higher
the 3rd day FSH, then less the number of aspirated ovules. The number of follicles ≥
14 mm, the higher E2 concentrations on hCG is, the more number of retrieved
ovules.
p < 0,05 and R2 = 60% shows this equation is of very high significance to evaluate
the number of ovules according to the above mentioned factors.
3.3.3. Relation between E2 concentration ovules
Table 3.6. Relation between E2 concentration ovules
S noãn c a nhóm hMG
S noãn c a nhóm rFSH
Niêm m c t cung (mm)
P4 ngày hCG
(nmol/l)
± SD
>8
≤8
≤ 1,5
> 1,5
OR
95% CI
1,39
0,4 – 5,1
1,47
0,6 -3,5
7,66
1,1-15,6 (*)
≥1
S phôi đ 3
<1
<5
(*): Statistical difference with p < 0,05
The considered factors related to nesting ratio are uterine lining, P4 concentration,
the number of grade 3 embryos. Nesting ratio in group of at least grade 3 embryos
is 7.66 higher than the group without grade 3 embryos, the difference is
statistically significant with p <0.05.
3.3.5. Factors related to clinic pregnancy rate
Table 3.8. Multivariante regression model related to clinic pregnancy rate
Clinic pregnancy rate
OR
Reliable rage 95% CI
Related factors
Independence difference
Age
p
X
For both hMG
3.3.4. Factors related to the nesting ratio
Table 3.7. Factors related to the nesting ratio
Y (number of ovules) =a +b. (age)+c. (3rd dayFSH )+d.(number offollicle)≥14 mm)+ e.(E2 onhCGday)
With a = 2,511; b = – 0,062; c = – 0,047; d = 0,891; e = 0,00008
n
± SD
Các y u t
Constant, Coefficient, Std Err, R2 = 60%
Multivariate regression equation of the community impact of the independent
variables such as age, 3rd day FSH, number of follicles ≥ 14 mm, and E2 on day of
hCG over dependent variable (number of ovules):
E2 day hCG
X
BMI
(kg/m2)
< 35
≥ 35
< 23
≥ 23
2,48
1,2 – 5,3
4,8
0.6 – 99,3
39
40
< 10
2,6
1,1 – 5,8
≥ 10
>8
Thickness of uterus mucus
3,0
1.1 - 8.7 (*)
(mm)
≤8
>4
Number of ovuls
1,1
0.3 - 4
≤4
> 1000
E2 day hCG (pg/ml)
0,4
0.1 - 1.2
≤ 1000
> 1,2
LH day hCG
1,3
0.5 – 3,3
(IU/l)
≤ 1,2
< 1,5
P4 day hCG
1,8
1.1 - 3.2 (*)
(nmol/l)
≥ 1,5
>3
Number of transferred embryos
3,1
0.9 - 10.1
≤3
≥1
Number of embryos grade 3
3,2
1.5 - 7.2 (*)
<1
(*): Statistical difference with p < 0,05
Possibility of pregnancy among patients with uterine lining thickness> 8 mm is 3
times higher than those with uterine lining ≤ 8 mm.
Possibility of pregnancy among patients with P4 on hCG day ≤ 1.5 ng/ml is 1.8
times higher than those with P4 on the hCG day> 1.5 ng / ml
Possibility of pregnancy among patients with at least 1 grade 3 embryo is 3.2 times
higher than those without any grade 3 embryos.
the rFSH group. After using these two courses, the poor response rate drops to 36.4% in
the HMG group and 41.8% in the rFSH group. This is the most valuable results of two
studies using this course in general and using hMG in ovarian stimulation in particular.
In addition, this result is also greatly humanitarian, which helps increase the chances of
pregnancy with their own ovules for infertilization women before going to the final
solution is in vitro fertilization with donated ovule.
4.1.2 . Discuss the number of ova obtained of the two courses
One of the purposes of ovarian stimulation is to increase the number of ova obtained.
Only the hCG injections cause mature ovum when at least one follicle size ≥ 2
follicles ≥ 18mm or 17mm. The study results show that although the number of
follicles ≥ 14mm stimulating day of hCG injection did not differ between the two
groups but the average number of ova obtained by HMG group higher than rFSH
group ( 6.0 ± 2.5 versus 4.7 ± 2.4 ) , differences were statistically significant with p =
0:02 . Results of the study were lower than the study of Vu Ngoc Minh City (2006)
with ovule number obtained is 8.3 ± 4.7. The reason for this result may be due to the
choice of different research subjects. But this is also a positive result of the use of
HMG research in ovarian stimulation with poor response group.
4.1.3 . Discuss the cycle cancellation rate of two courses
In hMG group, there were 4 cases of no embryo transfer for the reason of not
fertilized ovum , 2 cases of no oocyte upon aspiration. In rFSH group, 5 cases with
oocyte upon aspiration but ovum was not fertilized so there’s no embryo for
transfer. Thus the hMG group has only 104 patients and rFSH group has 105
patients receive embryo transfer embryos . The rate of cycle cancellation of two
groups is respectively 5.4 % and 4.5 % , with no statistical significance (p > 0.5 ).
Cycle cancellation rate in our study is 1.4% higher than the study of Nguyen Xuan
Hoi (2011 ), 2.6% higher than study of Vu Ngoc Minh. Tsai’s study compares
leuprolide acetate rFSH 0.5mg/day and hMG 1.88mg, cycle cancellation rate was
3.8 % in the hMG group, 5.0% in the rFSH group, the cause of cycle cancellation is
due to no development of follicle. This difference is due to the choice of research
subjects vary between studies.
4.1.4. Discuss the hormonal changes in the course of ovarian stimulation of two courses
* Discuss the changes in E2 concentration
Tests to evaluate E2 concentration in blood are the routine laboratory tests and are
essential in the process of monitoring the development of follicles to stimulate the
ovaries, valuable in assessing the rate of follicle development and the maturation of
the oocyte.
Basic E2 concentration of the cycle was equivalent between the two groups then
increased during ovarian stimulation. E2 concentration on the 7th day of FSH
increased rapidly, the difference was statistically significant between the two
groups with p < 0.05. But on the day of hCG injection of the two studies, E2
concentrations will correspond to the number of ovules and oocyte quality. These
results will be discussed in section of relevant factors.
* Discuss the changes in concentrations of LH
Basic FSH (IU/l)
Chapter 4: DISCUSS
4.1. Discuss the results of ovarian stimulation of two courses
Results of ovarian stimulation of two courses are evaluated and discussed include:
ovarian response, number of retrieved ovules after aspiration, cycle cancellation
rate.
4.1.1. Discuss the ovarian response
Standard poor response to ovarian stimulation in research when there are less than 4
retrieved follicles after oocyte aspiration. The response rate is low in hMG group which
is 36.4%, at rFSH group its is 41.8%. This rate is higher than other studies in Vietnam.
Author Vuong Thi Ngoc Lan (2002), poor response rate is 22.7%. Author Vu Minh
Ngoc (2006) poor response rate of long course is 22.6%. This difference is because that
the research subject of the group has history or risk of poor response, not group
anticipated normal ovarian response. Also due to this characteristic that both research
groups do not have cases of ovarian hyperstimulation.
However, when selecting objects in the study, number of patients with a history of poor
response from previous IVF cycles accounts for 69.1% in the HMG group and 70% in
41
42
Use of LH present in hMG always raises questions related to the phenomenon of
peak LH and early luteal phase to clinicians. However, chart 3.2 shows, LH
concentrations of both groups significantly reduced after use of GnRH agoinist and
continued to decline to 7 th day of FSH and maintained to day of hCG injections.
Basic LH concentrations on the 3rd day of the cycle was higher in the hMG group
(6.3 ± 0.6) compared with rFSH group (4.9 ± 2.2), the differences were statistically
significant with p> 0.05. On the day of hCG injection, LH concentrations were
similar for the two groups.
High LH on the first day of ovarian stimulation will increase ovarian sensitivity to
FSH, increase ability to recruit follicles, increase the number of ovules. This
explains the study's results, the increase of the number of ova obtained in hMG
group versus rFSH group. Low LH and FSH on the 7th day of hCG has
demonstrated the role of GnRH agonists in inhibiting LH. The results of this study
reinforce the belief of clinicians to use hMG in ovarian stimulation.
* Discuss the changes in P4 concentrations
Assessing changes in P4 concentrations showed that: P4 increases gradually from 2nd
day of the cycle to 7th day of FSH on day of hCG injection. However, P4
concentrations on the day of hCG injection between hMG group and rFSH group
were respectively 1.4 ± 0.7 and 1.3 ± 0.4. The difference was not statistically
significant with p> 0.05 level. This proves the use of LH present in hMG and GnRH
agonists does not increase serum P4 concentrations on the day of hCG injection.
Study result of Daya S (2002) comparing hMG and rFSH in ovarian stimulation
shows P4 concentrations on the day of hCG injection were similar between two
groups.
In summary, analysis of changes in concentrations of E2, LH and P4 proved agonist shortcourse combined with hMG and rFSH does not increase peak LH during ovarian
stimulation. These results contribute further evidence and experience on the use of hMG
in ovarian stimulation courses for in vitro fertilization.
4.1.5. Discuss oocyte quality between the two courses
Insemination is used in ICSI study, this method was only performed on mature
oocyte (MII oocyte). Thus, the mature oocyte obtain is the ultimate goal of ovarian
stimulation. The study results mean number of mature ova for all 3 types: good,
average and bad in the hMG group are respectively (2.5, 1.9, 1.3) tend to be higher
compared with the rFSH group (1.5, 1.7, 1.2), however the difference is not
statistically significant with p> 0.05. The collection of more mature ovum in hMG
group helps to increase number of frozen embryos and increase the chances of
success of a cycle of in vitro fertilization.
4.1.6. Discuss the number of fertilized ovules and average fertilization rate
The number of fertilized ovules and fertilization rates are aggregate results of
oocyte quality, sperm quality and fertilization methods. The number of fertilized
ovules and average fertility of the study tend to be higher in hMG group versus
rFSH group, a difference not statistically significant with p > 0.05. Research done
by Safdarian 100 % ICSI gave the fertilization rate of 97.7 % in the hMG group,
equivalent to rFSH group, which was 98.9 %, higher than our study (79.4 % and
67.6 %). Because sperm quality and fertilization techniques are the same,
fertilization rates will depend on oocyte quality. Group has a history of poor
response and risk of poor response often have poorer quality and quantity of oocyte
than group of normal response, which explains fertility rate of the research group
was lower than other studies. However, the number of ovules obtained after
aspiration of of hMG group was higher, which is statistically significant compared
with the rFSH group, so it should be able to explain fertilization rates tend to be
higher in group HMG versus rFSH group .
4.1.7. Discuss the number of embryos and embryo quality of two courses
With low average number of embryos, less than 5 embryos, it is often enough for
fresh embryo transfer, no stored embryo. However, differences between the two
groups is the quality of embryos, number of grade 3 embryos in hMG group was
higher, which is statistically significant compared with the rFSH group with p
<0.05 (3.1 ± 1.9 versus 2, 6 ± 1.6) and also higher compared to grade 2 and grade 1
embryos. Number of grade 3 embryos, which are the best quality embryos,
including uniform embryos and without debris. This is significant to reduce the
number of embryos transferred, increase number of frozen embryo, increase chance
of frozen embryos, ensure the success rate of the cycle in vitro fertilization and
reduce the incidence of multiple pregnancies.
4.1.8. Discuss the number of transferred embryos of two courses
How many embryos to be transferred in one cycle for being reasonable, indeed it is a
problem without a consensus among in vitro fertilization centers, because it depends on
many factors such as patient age, uterine lining quality, quantity and quality of embryos,
technical proficiency, religion, the law of each country.
The optimal number of embryos to be transferred is the one increasing pregnancy
rate and reducing the rate of multiple pregnancies because multiple pregnancies in
IVF will cause complications such as increase of ovarian hyperstimulation in those
at risk, increase the likelihood of miscarriage, premature birth, preeclampsia ...
According to the recommendations of the American Society of Reproductive, if
under the age of 35, the number of embryos to transfer is ≤ 3. If aged 35-40, the
number of embryos to transfer embryos ≤ 4. If you are aged over 40, the number of
embryos to transfer ≤ 5. If good quality embryos, should reduce the number of
embryos to transfer to avoid multiple pregnancies.
The percentage of 3 embryos transferred into the uterus takes the highest
proportion in both groups, 46.2% in the hMG group and 37.1% in the rFSH group,
the average number of embryos transferred in 2 groups are respectively 2.5 ± 1.2
and 2.7 ± 1.2, but the difference is not statistically significant with p> 0.05. The
number of embryos transferred in this study was lower than the study of Vuong Thi
Ngoc Lan (3.4 ± 1.4) and equivalent of Dal Prato study with number of embryos
transferred in the hMG group was 2.2 ± 0,6 and in the rFSH group was 2.2 ± 0.5.
The reason for this difference is due to the number of grade 3 embryos in hMG
group was higher, which is statistically significant compared with the rFSH group
(p <0.05), and also explains for the average number of embryos transferred of the
43
44
hMG group was lower than rFSH. In group of poor response, number of ova
obtained is often low, having more number of grade 3 embryos to reduce the
number embryo to be transferred will increase the chances of frozen embryos,
increasing cumulative pregnancy rate for IVF cycles.
4.1.9. Discuss the rate of frozen embryos and rate of cycle with frozen embryos
of two courses
In hMG group, there were 41 cases of frozen embryos, in rFSH group there were
28 cases of frozen embryos. The rate of frozen embryo in hMG group was 39.4%
and of the rFSH group was 26.7%. The difference in the rate of frozen embryos
between two groups is statistically significant with p = 0.05 (p <0.05).
The increase in the number of frozen embryos and increase the rate of cycles with
frozen embryos can help increase the cumulative pregnancy rate of one cycle of
ovarian stimulation, in-vitro fertilization. This economic benefit of hMG group
compared with rFSH group recorded in the study will reduce treatment costs for
poor response group in in vitro fertilization.
4.1.10. Discuss the rate of nesting of two courses
Embryo implantation is a process in which the embryo attaches to the uterine wall
and the first to penetrate the lining of the uterus then the circulatory system of the
mother to form the placenta. Nesting ratio is calculated as the ratio between the
gestational sac and embryo transfer into the uterus. Nesting ratio reflects both the
quality of embryos and fetuses have the ability to grow well into the gestational
sac, and a reflection of the quality of the lining of the uterus to receive the embryo
development.
Nesting ratio of hMG group was 23.2, higher than rFSH group, which was 16%
with p> 0.05 (Table 3.9). This rate is lower than the study of Nguyen Xuan Hoi
(2008)which was 41.3% and 39.9% when comparing the two courses [109]. This is
explained by different study subjects.
Thus, the study of hormonal levels change during ovarian stimulation, oocyte
quality, thickness and pictures of the lining the uterus, implantation rate showed
effectiveness when used LH present in hMG in ovarian stimulation with group at
risk of poor response.
4.1.11. Discuss the clinical application values of two courses
* Discuss the rate of FSH dose increase and decrease
During ovarian stimulation, increase the FSH dose when the ovarian at risk of poor
response. Indicate to increase FSH dose increase when there is less than 5 follicles ≤
12 mm in size on ultrasound scan and E2 concentration <300 pg /ml on 7th day of
FSH. Indicate to reduce FSH dose once there are 10 follicles each side of ovary with
the dimension of ≥ 14mm and E2 level ≥ 2500 pg/ml at the 7th day of FSH.
In all 2 group there is not any case of decreasing of the dose. FSH dose rate in the hMG
of FSH has the decrease trend (2.7% and 6.4%) the difference in 2 group has not
statistic difference. Pepovic to dorovic also give the increased or decreased doses at the
8th FSH day [110], the rate of rFSH in 31% higher than that of the group of our study.
Thus, the decision of beginning FSH dose at the subject is appropriate.
In the hCG group, 3 subjects receive 2 days of increasing doses, with 50 IU of FSH
each day.
In the rFSH group, 4 subjects receive 2 days of increasing doses with 50 IU of FSH
each day.
The rate of patients receive increasing dose of FSH, the prolonged day of increasing, the
total increased doses of 2 group have not statistic significant with p=0.05.
Studies show that, we can need of increase too much the daily dose FSH, we can
reach the purpose of ovarian stimulation once we have the precis beginning dose. The
results were appropriate with the studies of Miton Leong (Hong Kong) and Pasquale
Patrizic (USA) on 124,700 cycles of ovarian stimulation at 196 center of IVF from 45
nations, much of these center performed an average of 400 cycles/year, 2 centers
4000 cycles/year. Results show that the beginning doses at the group with less
responsiveness ovarian stimulation are > 300 IU/day but < 450 IU/day.
*About the economical value of 2 protocols
The cost of IVF can reach some million VND composing of the price of the
stimulator substance, the media of culture and the equipments for ovary
punctuation and collection of ova, ICSI and transferring the fetuses. The reduce of
the treatment cost has important significant () decrease the cost and hinder the
interruption of treatment, specially the decrease of the cost for the medicaments in
ovarian stimulation.
The group of hMG has no great difference with the group of rFSH in the technique
and result and in the result of the cycle of ovarian stimulation; however total doses
of FSH hMG are difference with rFSH group with statistic significant. On the
market, the price of hMG is lower than that of rFSH. In addition, the collected
follicles, the 3rd grade fetuses and freeze fetuses and the cycles with freeze fetuses
of hMG group are increased statistically make the higher cases of success and the
higher accumulated number of fetuses in each cycle of ovarian stimulation.
Therefore, total cost of each time of ovarian stimulation reduces.
4.2. About the factors involving in the result of IVF
4.2.1. About the factors involving in less responsiveness
The prognosis factors of less responsibility before the beginning of ovarian
stimulation were reported such as at the age > 35, 3rd day FSH the increasing > 10
IU at antral follicles < 4, inhibin B <45 pg/m, AMH < 25 pg. However, clinically,
less responsiveness state occurred even while those factors are at the normal limit,
this shows that there are any factors show its affect to the ovarian stimulation.
The multi variant regress analyses of the factors of age, AFC, BMI, basal FSH, 7th day
E2 level LH, P4 at hCG day, with the rate of less responsiveness show that:
At the age > 35, the group of risk of less responsibility is 2.23 folds higher than that
of the age < 35. The patients with the sum of antral follicles < 5 have the risk of
less responsiveness 2.9 folds higher than that of AFC > 5. The patients of basal
FSH level ≥ 10 IU/l have the risk of less responsiveness 2,3,1 folds than that of the
group of basal FSH ≤ 10 IU/l with 95% CI (1.1-4.7).
45
46
Almost studies approve that age is 1 of most influencing factors of the reproduction
of woman, the more older age, the less ovary reserve, the less responsibility of the
ovary and thus the less possibility of pregnancy. Bostros Risk studies show the
successful rate of 24.4% at women of 30-34 years old age and decreasing to 14,7%
at women higher 41 years old ago. Vivien Maclaclan in Australia and New Zealand
also report that the rate of pregnancy at the age 35-39 is 27.2% but that of the group
of more 40 is only 5.1%. I 12th June, 2009 in USA Saswali Sunderam reported that
in ≤ 35 years onld age woman, the rate of getting pregnancy 45%, while at the age
> 42, the rate of getting pregnancy only 7%.
E2 examination at 7th day is the first normal examination after FSH injection. Thus,
that is an early examination of value to prognose the risk of less responsiveness of
the ovary, and this moment is physician regulate to increase FSH doses to get
optima effect of ovarian simulation.
In the group of E2 at 7th day ≤ 300 pg/ml, the risk of less responsiveness, the risk of less
responsiveness is higher than that of the group at 7th day E2 > 300pg/ml 12,9 folds
Thus, the age, AFC, FSH at 3rd day. E2 level at 7th day the prognosis of less
responsiveness, p < 0.75.
4.2.2. About the factors involving in the sum number of follicles
In table 3.2.2 multi variant regress analysis give an evaluation of total effects of the
age, FSH at 3rd day, the sum of ≥ 14nm follicles, E2 at hCG day to the collected
sum of follicles.
This relation is exported by the equation:
Y(sum of follicles) = a + b(age) + c (FSH at 3rd day) + d (sum of follicles) + e (E2
level at hCG day)
a = 2.511; b = -0.062; c = -0.047; d = 0.891; e = 0.00008
The equation Y has a reverse relation with the age, basal FSH level, and a positive
relation with the sum of ≥ 14mm follicles and E2 at the injected day hCG. Thus, the
elder age, the basal FSH level the less number of collected follicles.
The sum of ≥ 14 mm, E2 level at hCG day higher, the collected follicle sum larger,
p < 0.05 and R=60%. Thus equation has great signification to evaluate the sum
member of follicle.
The sum member of follicles is not related only to the age and basal FSH but
related positively to AFC. Much studies also evaluate the antral follicle count by
ultrasound at the beginning menstrual cycle to prognoses the responsibility of ovary
and follicles count.
4.3.3. About the relation of E2 and the sum of follicles
Higher level of E2 higher follicle count, the difference has statistic significant with
p<0.05. The relation was exposed by the Equation:
Y(follicle count) = 0.000867 x E2 at hCG + 2.988
For all 2 group hCG and rFSH, average sum of follicles increases following E2
level at hCG day. The higher E2 at hCG day, the larger number of follicles count.
The difference has statistic significant, p = 0.001
The equation on follicle count:
Y = 0.000867 x E2 (at hCG day) + 2.988
a = 0.000867; b = 2.988 relation coefficient R = 0.619
The higher E2 level, the higher sum of collected follicles.
4.3.4. About the factors involving in the rate of implantation
Studies show that the thickness of uterus mucous membrane do not influence on the
rate of implantation.
However practically, many other factors influence on the rate of implantation.
Following us, these factors compose of uterus mucous membrane, P4 level at hCG
day, the sum number of 3rd grade fetuses. The freer of liberated fetuses from the
membrane the mark of transferring fetuses. Table 3.2.4 shows that only the number
of 3rd grade fetuses has relation with the rate of implantation. The group of at least
1 fetus of 3rd grade has the group of 3rd grade fetuses has the rate of 7.66 folds
higher than the none 3rd grade fetuses with statistic difference with p < 0.05 (95%
CI, 1.1-15.6)
Recently studies show also the relation of P4 level at the hCG injection day and the
rate of implantation. In the year 2010, studies performing on 1045 cycles of
IVF/ICSI with GnRH agonist, comparing the patients with an increase of P4 >1.1
pg/ml with the patients with P4 ≤ 1.1 pg/ml) show that the patients group with the
increased P4, has a lower rate of implantation (18.1% comparing with 24.4%
p=0.008) and the rate of the lower of survival (27.6% in comparing with 24.4%,
p=0.004) [114]. Our study also a higher in comparing with the cases with higher
P4≥1.5 but there is not statistic difference (OR = 1.47; 95% CI = 0.6-3.5). Thus LH
in hMG does not influence on the rate of implantation.
The reproduction help center of control Hospital of Gynecology and Obstetrics, has
evaluated the mark of fetuses transferring to prog the possibility of implantation
and getting pregnancy in IVF. The mark of fetuses transferring composes of 3
factors the mark fetuses (quality and quantity of transferred fetuses), the mark of
uterus mucous membrane (thickness and form) the technique of transferring (easy
or difficult) the highest mark reaches 2 for each factor. The results of studies show
that the rate of the group of > 5 of the transferring fetuses is higher than that of the
group of mark < 5. The difference has not statistic significant with p >0.005. In the
year of 2003, at the Central G&O, there is not any case of difficult transferring
fetuses get pregnancy.
Following us, excluding objective causes, the evaluation as easy or difficult is
subjectively, depending on the skill of the physician and on the technique and equipments.
However, the cleaness of catheter has influence significantly the for getting
pregnancy. In the group of transferring the fetuses with the cleanest catheter the
rate of getting pregnancy is 50.5% higher than 10% in the case of dirty catheter
(p=0.013 OR 0.09, 0
transferring also has great influence. The fetuses placed in the very center of the
uterus with a distance of 1.5-2 cm from the uterus bottom give best result.
47
48
Catheters with polluted substance such as blood, mucous substance increase the
possibility of infection, induce and the constraction of uterus, reducing the
possibility of getting pregnancy.
4.3.5. About the factors involving in the rate of clinical pregnancy
Multi variant regress analysis on the factors as age, BMI, basal FSH, the thickness
of uterus mucous membrane, the sum of follicles, E2, LH, P4 level at hCG day, the
sum of transferred fetuses and pregnancy. But only 3 factors – uterus mucous
membrane, P4 level at hCG day and quality of the fetuses, expose the relation with
the rate of clinical pregnancy.
Two factors play the most influence on the result of cycle of IVF are the quality of
the transferred fetuses and the possibility of receiving of the uterus membrane.
Prognosis value of the thickness of the uterus mucous membrane can be evalprated
in ultrasound and at any day of the treatment period but the hCG injection day is
the most influenced factor, beacause at that moment, the follicles was matured
confirm many studies are performed at that moment such as by Vuong Thi Ngoc
Lan, Bruffi RLR, Oliveria JBA.
At the Reproduction Help Center of the Central Hospital of G & O, the thickness of
the uterus mucous membrane at hCG Day. Determining the relation of the rate of
getting pregnancy and the value threshold of uterus mucous membrane thickness,
Kovacs study has showed that the rate of getting pregnancy in the group of ≥ 10mm
higher thickness significant statistically than that of the group of < 10mm of thickness
(OR=1.3; CI=1.0-1.7; p<0.05) Vuong Thi Ngoc Lan (1012) also reported the >
10mm thickness of uterus gave the higher rate of clinical pregnancy.
Up to now, the prognosis value P4 to the possibility of getting pregnancy is a topic
of controversial. Some authors reported that there is no relation between the rate of
getting pregnancy with P4 level at hCG day (Abuzeid 1956, Urman, 1999,
Martinesza 2004) Bosch study has conclused that progesterol level ≤ 1.5 ng/ml give
a statistic significant higher rate of progressive getting pregnancy with the P4 level
> 1.5 ng/ml. Our study shows that at the patients of P4 at hCG day ≤ 1.5 mmol/ml a
1.8 folds higher than that of the subjects of P 4 at hCG day > 1.5 mmol/ml, (OR =
1.8; 95 CI = 1.1 – 3.2 )
In the patient of at least 1 fetuses of 3rd grade the rate of getting pregnancy is 3.2 folds higher
than the subjects of none of 3rd grade fetuses (OR = 3.2; 95% CL = 1.5 – 7.2)
Logistic agress analysis in 2003 of Shen (USA) shows that the factors of prognosis
value to the possibility of getting pregnancy in the patients whose submitted ICSI
compose of the age of patient, E2 level at hCG day, the count of transferred fetuses
and the quality of fetuses. But Shen ‘s study is a retrospective which do not show
the threshold of prognosis value.
In sum, studies show that the thickness of the uterus mucous membrane, P4 level at
hCG day and the quality of the fetuses are the related factors involving in the rate
of implantation and the rate of clinical pregnancy.
Short protocol/HMG and short protocol/rFSH for treating ovary responds poorly
in in vitro infertilization at the National Hospital of Obstetrics and Gynecology
demonstrates that:
1- The short protocol/HMG gives an analogue result is with the short
protocol/rFSH concerning.
The responsiveness of the ovary, the thickness of mucous
membrane the uterus, the sum number of ≥ 14mm follicles at the hCG
inject day.
The average sum of follicles: 4.2 ± 2.5 in comparing with 3.6 ±
2.0
The rate of fecundation 79.4% in comparing with 67.6%.
The rate of implantation 23.3% in comparing with 16.07%.
The rate of clinical fetus/cycle 20.1% in comparing with 16.4%.
The rate of clinical fetus/the transfer of fetus 22.1% in comparing with
17.1%.
2- The protocol/HMG gives the better result in comparing with the
protocol/rFSH concerning.
Average sum of follicle 6.0±2.5 in comparing with 4.9±2.5
Quality of fetuses (the sum number of fetuses 3rd grade): 3.1±1.9 and
2.2±1.6.
The sum number of freeze fetuses 2.5±1.2 in comparing with
1.6±1.3
The number of cycles with freeze fetuses 39.4% in comparing
with 26.7%
Total doses Of FSH: 3082.3%+40.7 in comparing with
3563.6±48.0
Decrease the cost of treatment.
3- Factors involving in results of IVF.
Age FSH at 3rd day, AFC, E2 at 7th day, LH at 7th day.
The sum number of obtained follicles has an increase ratio with
the age, base FSH and a direct ratio with the sum number of ≥ 14mm
follicle and E2 level at the hCG day.
The quality of 3rd gradefetuses involving in the rate of
implantation (7.66 fetuses higher in the group of at least 1 fetuses of 3rd
grade fetuses in comparing with the none)
The thickness of lining of the uterus > 8mm or P4 at the hCG inject ≤
1.5mmol/l or in the case of at less 1 fetuses of 3rd grade, the ratio fecundation
is higher than of the group of < 8mm thickness of mucous membrane, P4 at the
day of hCG > 1.5 mmol/ml none 3rd grade fetuses reach 3 folds 1.8 and 3.2
folds consecutively.
Conclusion
49
The lining ò uterus, P4 on hCG day, the quality of embryo get the
influence to the ratio of implantation and the ratio of clinical fetuses.
Recommendation
1. Short protocol/hMG is the choice ovarian stimulation at the group of previous
poor responder or at the risk of less responsivenessin IVF.
2. hMG studies must be promoted.
3. E2 level at the 7th day is a prognosis factor to detect the risk of less
responsiveness of ovarian stimulation if E2 ≤ 300 pg/ml. In this case, physician
must increase the dose of FSH properly.