Evaluation of mungbean (Vigna radiata L.) cultivars for resistance to yellow mosaic virus
Bạn đang xem bản rút gọn của tài liệu. Xem và tải ngay bản đầy đủ của tài liệu tại đây (421.31 KB, 11 trang )
Int.J.Curr.Microbiol.App.Sci (2017) 6(4): 88-98
International Journal of Current Microbiology and Applied Sciences
ISSN: 2319-7706 Volume 6 Number 4 (2017) pp. 88-98
Journal homepage:
Original Research Article
/>
Evaluation of Mungbean (Vigna radiata L.) Cultivars for Resistance
to Yellow Mosaic Virus
Dharnendra Reang1, Prasad Singha1*, Abishak Thapa1, Barun Rai1,
Nirmal Sarkar1 and P.S. Nath2
1
Uttar Banga Krishi Vishwavidyalaya Pundibari, Coochbehar-736165, India
2
Bidhan Chandra Krishi Vishwavidyalaya, West Bengal-741252, India
*Corresponding author
ABSTRACT
Keywords
Mungbean, YMV,
Incidence, Severity.
Article Info
Accepted:
02 March 2017
Available Online:
10 April 2017
Two year field screening was undertaken during Kharif season of 2011 and 2012 with
eight varieties of Mungbean to ascertain its resistance against Yellow mosaic virus disease.
It is evident from the pooled data that no varieties/ lines showed complete resistance to
YMV disease during both the consecutive years 2011 and 2012 but it was found that the
incidence of the disease varied from 36.70% to 9.12%. The significant lowest incidence
was recorded in Sukumar (9.12%), followed by Meha (9.39%). Highest yield was recorded
in Sukumar (1.80 kg/plot) and it was at par with Meha (1.71 kg/plot). Significant lowest
disease severity was also recorded in Sukumar (3.60 %) and it was statistically at par with
Meha (3.91 %). Although PM 05 gave significant higher yield but disease severity and
incidence were not statistically at par. Results indicate that both Sukumar and Meha could
be cultivated in the plains of West Bengal as a tolerant variety and can also be used as
parental lines. The other variety PM 05 may also be used as parental line from the genetic
point of view.
Introduction
which is all times high and is the only
exception year (IIPR, 2011 on Vision 2030).
Pulses are one of the important segments of
Indian Agriculture after cereals and oilseeds.
Owing to their fairly large seeds, good
storability, and high nutritional value and also
due to its usefulness in improving the soil
health by enriching nitrogen status and
providing
long-term
fertility
and
sustainability to the cropping systems it is
grown throughout the world. India is the
largest producer and consumer of pulses in
the world contributing around 25-28 per cent
of the total global production. The estimates
for 2010-11 indicate that the total pulse
production is 17.29 mt from 25.51 mha area
Mungbean or green gram, scientifically
known as Vigna radiata L. Wilczek, is one of
the important short duration pulse crops of
Indian origin. Mungbean is cultivated across
the country throughout the year with an area
and production of 3.77 mha and 1.52 mt,
respectively (AICRP on Mullarp, 2009). The
major biotic constraints diseases that delimit
the productivity of Mungbean consist of
viruses, fungi, bacteria and nematodes. Of
which whitefly (Bemisia tabaci) transmitted
88
Int.J.Curr.Microbiol.App.Sci (2017) 6(4): 88-98
Mungbean yellow mosaic virus (MYMV) is
widely distributed and most destructive. In
India, Nariani (1960) reported first the yellow
mosaic virus (YMV) diseases of mungbean
(Vigna radiata), considering the importance
and wide distribution of YMV, in India Nene
(1972) made a comprehensive study of this
disease in Uttar Pradesh and reported that
YMV is present where ever the crops are
grown. Mungbean plants infected with YMD
generally show yellowing or chlorosis of
leaves followed by necrosis, shortening of
internodes, and severe stunting of plants with
no yield or few flowers and deformed pods
produced with small, immature and shrivelled
seeds (Akhtar et al., 2009).
replications. The date of sowing was 7. 3.
2011 and 7. 3. 2012, spacing used was 30cm
x 15cm and plot size 5m x 4m. Fertilized
were applied @ 15:45:20 kg/ha of N.P.K. The
nitrogen was applied in two split doses, half at
the time of sowing and rest half at 21 DAS,
whereas total phosphorus and potash were
applied at the time of sowing.
Observations on the incidence and severity of
the disease were recorded starting from 20
DAS at an interval of 10 days up to 50 DAS.
The population of whitefly was also
determined by counting on the mungbean
plant and the mean of 3 replications was taken
for population study of whitefly incidence and
yield of the crop recorded at harvest and the
data were statistically analyzed.
Considering
the
immense
economic
significance of ‘Mungbean Yellow Virus
disease’ investigations are being carried out
both at the national and international levels on
different aspects of this disease particularly
on the management by means of, suitable
tolerant varieties, control of its insect vector
(Bemisia tabaci Genn.) and by using chemical
insecticides. But spraying of chemical
insecticides possesses a threat to environment
and health hazard. So, taking into account
this fact, experiment was conducted to seek
out tolerant varieties.
Disease incidence and severity
calculated by the following formulas
were
Scale
A field experiment was conducted at the
Instructional Farm, BCKV, Jaguli, for
consecutive two years 2011 and 2012 with
eight different varieties of Mungbean which
was collected from the Department of
Agronomy, BCKV to study the effect of
relative susceptibility to Mungbean Yellow
Mosaic Virus. The site of the experiment
located at south of tropic of cancer with
22⁰ 93´ N latitude, 88⁰ 53´ E longitude with
an elevation of 9.75 m from mean sea level.
Soil is of sandy loam type and having good
irrigation facility.
0:- No. of plants not showing any symptom.
1:- Less than 1 per cent plants showing
symptoms.
3:- 1-10 per cent plants showing mottling of
leaves.
5:- 11-20 per cent plants showing mottling
and yellow discolouration of leaves.
7:- 21-50 per cent plants showing mottling
and yellow discoloration of leaves and
stunting of plants.
9:- 51 per cent or more plants affected,
stunting of plants pronounced, flowers and
fruits reduced and appearance of severe
yellow mottling on the leaves.
The experimental design used was R.B.D
(Randomized Block Design) with three
89
Int.J.Curr.Microbiol.App.Sci (2017) 6(4): 88-98
The scoring system was based on 1 to 9 rating
scale as suggested by (Mayee and Datar,
1986).
the increase of the age of the plant, but the
most susceptible period for infection was in
between 30 and 40 DAS.
Results and Discussions
Significant lowest severity was found in the
variety Sukumar followed by Meha and PM
05 and the severity of disease was 3.72%,
3.90% and 5.31% respectively. Disease
severity of Meha and Sukumar were
statistically at par. The percentage of disease
severity was highest in the variety Samrat and
it was 86.94, followed by RMG-62,
Bireshwar, IPM 02/03, Sonali, and the disease
severity was 76.51%, 66.67%, 53.33% and
12.12% respectively. The percentages of
control of the disease over check variety were
12.00, 23.31, 38.66, and 86.06 respectively
(Table 1).
Effect of varietal screening on the
incidence, severity and yield of Mungbean
Yellow Mosaic Virus
An experiment was conducted under field
condition to determine the disease incidence
and severity percentage of mungbean yellow
mosaic virus among different varieties of
mungbean in different days starting from 20
Days after Sowing (DAS). The data on field
screening of mungbean yellow mosaic virus
has been presented in tables: 1–3 and figures:
1–3.
In the second season (2012), it was also found
that none of the varieties/lines were free from
the disease, but the percentage of incidence
and severity varies among the eight
varieties/lines. Significant lowest incidence
and highest disease control was recorded in T8
(Sukumar) and the disease incidence was 9.14
% and disease control over check was 74.72
%. This was followed by, T5 (Meha), T3
(Sonali) and T6 (PM 05), and the percentage
of disease incidence of these varieties/lines
were 9.39, 11.80 and 12.68 respectively and
disease control over the check were 74.02,
67.36 and 64.43 respectively. The percentage
of the incidence of disease was statistically at
par in T8 and T5. Highest incidence of the
disease was found in T4 (Samrat) and the
percentage of incidence was 36.15 followed
by, T7 (RMG 62), T1 (Bireshwar) of 22.30 and
21.38 respectively. The percentage control of
the disease over check variety were 38.31,
40.86 respectively. The percentage of
incidence was increased with the increase of
the age of the plant, but the most susceptible
period for infection was in between 30 and 40
DAS (Table 2). Significant lowest severity
was found in the variety Sukumar followed by
In the first season (2011), it was found that
none of the varieties/lines were free from the
disease, but the percentage of incidence and
severity varies among the eight varieties/lines.
Out of these eight varieties/lines, Samrat was
taken as check. Significant lowest incidence
and highest disease control was recorded in T8
(Sukumar) and the disease incidence was 9.09
% and disease control over check was 75.60
%. This was followed by, T5 (Meha), T3
(Sonali) and T6 (PM 05), and the percentage
of disease incidence of these varieties/lines
were 9.40, 11.30 and 13.73 respectively and
the percentage disease control were 74.77,
69.66 and 63.14 respectively.
The percentage of the incidence of disease
was statistically at par in T8 and T5. Highest
incidence of the disease was found in T4
(Samrat) and the percentage of incidence was
37.25 followed by, T7 (RMG 62), T1
(Bireshwar) of 22.65 and 21.60 respectively.
The percentage control of the disease over
check variety were 39.19, 42.01 respectively.
It was further noted that, first symptom
appeared 20 days after sowing. The
percentage of incidence was increased with
90
Int.J.Curr.Microbiol.App.Sci (2017) 6(4): 88-98
Meha and PM 05 and the percentage of
disease severity was, 3.47, 3.92 and 5.05
respectively. Variety Sukumar and Meha
were statistically at par. The percentages of
control of the disease over check variety were
95.89, 95.36, 94.03 respectively. The
percentage of severity of disease was highest
in the variety Samrat and it was 84.52,
followed by RMG-62, Bireshwar, IPM 02/03,
Sonali, and the percentage of disease severity
was 75.96, 66.67, 53.33 and 13.26
respectively. The percentages of control of the
disease over check variety were 10.13, 21.12,
36.90, and 84.31 respectively.
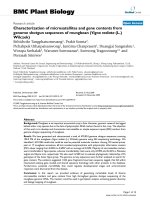
95.80, 95.44, 93.96 respectively. Variety
Sukumar and Meha were statistically at par.
The percentage of severity of disease was
highest in the variety Samrat and it was 85.73,
followed by RMG-62, Bireshwar, IPM 02/03,
Sonali, and the percentage of disease severity
was 76.24, 66.67, 53.33 and 12.69
respectively. The percentage of control of the
disease over check variety was 11.07, 22.23,
37.79, and 85.20 respectively.
Population of whitefly and yield on
different varieties/lines in mungbean crop
During the first season 2011, the average
number of Whitefly (Bemisia tabaci) (Table
1) was found highest in variety IPM02/03
(9.34 per plant), followed by RMG 62,
Samrat, Bireshwar, the average number of
whitefly population were, 8.58, 8.50 and 7.42
per plant respectively. The average number of
Whitefly population was lowest in Sukumar
(1.83), followed by Meha, PM 05 and the
number of whitefly was 2.09, 3.00
respectively. There was a positive correlation
between average number of whitefly per plant
and incidence of the disease.
From pooled data, it was also found that none
of the varieties/lines were free from the
disease, but the percentage of incidence and
severity varies among the eight varieties/lines.
Significant lowest incidence and highest
disease control was recorded in T8 (Sukumar)
and the disease incidence was 9.12 % and
disease control over check was 75.15 %. This
was followed by, T5 (Meha), T3 (Sonali) and
T6 (PM 05), and the percentage of disease
incidence of these varieties/ lines were 9.39,
11.55 and 13.30 respectively and disease
control over the check i.e. Samrat were
analysed and those were 74.41, 68.53 and
63.76 respectively (Table 3 and Figure 1).
The percentage of the incidence of disease
was statistically at par in T8 and T5. Highest
incidence of the disease was found 36.70 % in
T4 (Samrat) and followed by, T7 (RMG 62),
T1 (Bireshwar) of 22.48% and 21.49%
respectively. The percentage control of the
disease over check variety were 38.75, 44.14
respectively. The percentage of incidence was
increased with the increase of the age of the
plant, but the most susceptible period for
infection was in between 30 and 40 DAS.
Significant highest yield was obtained from
Sukumar variety and it was 1.79 kg/plot
followed by Meha and PM 05 variety and the
yield of Mungbean plant recorded (Table 1)
were 1.72 and 1.63 kg/plot respectively. Yield
of T5 and T8 were statistically at par. Lowest
yield was found in RMG 62 (0.60 kg/plot),
Samrat (0.60 kg/plots) and Bireshwar (1.07
kg/plot).
The average number of Whitefly population
(Bemisia tabaci) in the second season (2012),
(Table 2) was found highest in variety IPM
02/03 (9.17 per plant), followed by RMG 62,
Samrat, Bireshwar, the average number of
whitefly population were 8.34, 8.00 and 6.58
per plant respectively.
Significant lowest disease severity was found
in the variety Sukumar followed by Meha and
PM 05 and the percentage of disease severity
was, 3.60, 3.91 and 5.18 respectively. The
percentages of control of the disease were
91
Int.J.Curr.Microbiol.App.Sci (2017) 6(4): 88-98
Table.1 Field screening of mungbean varieties/lines against yellow mosaic virus disease of mungbean (2011)
SL.
Treatment
No.
20
Incidence of Disease (per cent)
Severity
Per cent of Disease
Yield
Days after sowing
(per cent)
control over check
(kg/plot)
30
40
50
(50 DAS)
Incidence
Severity
1
T1
1.38 (6.75)
15.97(23.55) 16.16(23.70) 21.60(27.69) 66.67(54.74)
42.01
23.31
1.07
2
T2
1.45 (6.92)
9.63(18.08)
15.62(23.28) 15.95(23.54) 53.33(46.91)
57.18
38.66
1.10
3
T3
1.18 (6.24)
7.28(15.65)
9.29(17.75)
69.66
86.06
1.43
4
T4 (Check)
1.47 (6.96)
12.90(21.05) 30.97(33.81) 37.25(37.61) 86.94(68.81)
-
-
0.60
5
T5
1.19 (6.26)
6.32(14.56)
9.40(17.85)
3.90(11.39)
74.77
95.51
1.72
6
T6
1.25 (6.42)
12.90(21.05) 13.37(21.45) 13.73(21.75)
5.31(13.32)
63.14
93.89
1.63
7
T7
4.00 (11.54) 11.90(20.18) 20.47(26.90) 22.65(28.42) 76.51(61.01)
39.19
12.00
0.60
8
T8
0.50 (4.05)
2.30(8.72)
5.62(13.71)
9.09(17.55)
3.72(11.12)
75.60
95.72
1.79
S.Em±
0.20
1.30
0.29
0.31
0.54
-
-
0.06
CD at 0.05
0.61
3.95
0.89
0.95
1.63
-
-
0.18
11.30(19.64) 12.12(20.37)
7.78(16.20)
Figures in parenthesis indicate angular transformed value, DAS=Days after Sowing.
T1=Bireshwar, T2=IPM 02/03, T3=Sonali, T4=Samrat, T5=Meha, T6=PM 05, T7=RMG 62, T8=Sukumar.
92
Int.J.Curr.Microbiol.App.Sci (2017) 6(4): 88-98
Table.2 Field screening of mungbean varieties/lines against yellow mosaic virus disease of mungbean (2012)
SL.
No.
Incidence of Disease (per cent)
Treatment
20
Days after sowing
30
40
50
Per cent of Disease
control over check
Severity
(per cent)
(50 DAS)
Incidence
Severity
Yield
(kg/plot)
1
T1
1.26(6.45)
15.52(23.20) 16.77(24.17) 21.38(27.54)
66.67(54.74)
40.86
21.12
1.17
2
T2
1.37(6.72)
9.83(18.27)
14.33(22.24) 15.94(23.53)
53.33(46.91)
55.91
36.90
1.17
3
T3
1.65(7.38)
7.35(15.73)
9.24(17.70)
11.80(20.09)
13.26(21.35)
67.36
84.31
1.41
4
T4 (Check)
2.61(9.30)
12.87(21.02) 31.46(34.12) 36.15(36.96)
84.52(66.83)
-
-
0.50
5
T5
1.34(6.65)
6.67(14.97)
9.39(17.84)
3.92(11.42)
74.02
95.36
1.69
6
T6
1.31(6.57)
12.07(20.33) 13.13(21.24) 12.86(21.01)
5.05(12.99)
64.43
94.03
1.67
7
T7
4.00(11.54)
12.66(20.84) 20.29(26.77) 22.30(28.18)
75.96(60.64)
38.31
10.13
0.57
8
T8
1.16(6.18)
2.35(8.82)
5.52(13.59)
9.14(17.60)
3.47(10.74)
74.72
95.89
1.82
S.Em±
0.57
1.02
0.25
0.22
0.92
-
-
0.08
CD at 0.05
1.74
3.11
0.75
0.66
2.78
-
-
0.25
7.71(16.12)
Figures in parenthesis indicate angular transformed value, DAS=Days after Sowing.
T1=Bireshwar, T2=IPM 02/03, T3=Sonali, T4=Samrat, T5=Meha, T6=PM 05, T7=RMG 62, T8=Sukumar
93
Int.J.Curr.Microbiol.App.Sci (2017) 6(4): 88-98
Table.3 Field screening of mungbean varieties/lines against yellow mosaic virus disease of mungbean (Pooled)
SL.
No.
Incidence of Disease (per cent)
Treatment
Severity
(per cent)
(50 DAS)
Days after sowing
30
40
50
15.74(23.37) 16.47(23.94) 21.49(27.62) 66.67(54.74)
Per cent of Disease
control over check
Yield
(kg/plot)
1
T1
20
1.32(6.60)
2
T2
1.41(6.82)
9.73(18.18)
14.98(22.77) 15.95(23.54) 53.33(46.91)
56.54
37.79
1.13
3
T3
1.42(6.84)
7.32(15.70)
9.26(17.72)
68.53
85.20
1.42
4
T4 (Check)
2.04(8.21)
12.89(21.04) 31.21(33.96) 36.70(37.29) 85.73(67.81)
-
-
0.55
5
T5
1.27(6.47)
6.50(14.77)
9.39(17.84)
3.91(11.40)
74.41
95.44
1.71
6
T6
1.28(6.50)
12.49(20.70) 13.25(21.35) 13.30(21.39)
5.18(13.16)
63.76
93.96
1.64
7
T7
4.00(11.54)
12.28(20.51) 20.38(26.84) 22.48(28.30) 76.24(60.83)
38.75
11.07
0.58
8
T8
0.83(5.23)
2.33(8.78)
5.57(13.65)
9.12(17.58)
3.60(10.94)
75.15
95.80
1.80
S.Em±
0.43
1.17
0.28
0.27
0.75
-
-
0.07
CD at 0.05
0.88
2.39
0.56
0.55
1.53
-
-
0.16
11.55(19.87) 12.69(20.87)
7.75(16.16)
Figures in parenthesis indicate angular transformed value, DAS=Days after Sowing.
T1=Bireshwar, T2=IPM 02/03, T3=Sonali, T4=Samrat, T5=Meha, T6=PM 05, T7=RMG 62, T8=Sukumar
94
Incidence
41.44
Severity
22.23
1.12
Int.J.Curr.Microbiol.App.Sci (2017) 6(4): 88-98
Table.3 Population of whitefly on mungbean plants at different days after sowing on different
varieties (2011)
SL.
No.
1
2
3
4
5
6
7
8
Treatment
T1
T2
T3
T4
T5
T6
T7
T8
Population of white fly/plant (DAS)
20
30
40
50
5.00
7.33
8.33
9.00
9.00
8.00
9.67
10.67
2.33
4.67
8.33
3.00
8.33
7.00
10.33
8.33
1.33
2.67
1.67
2.67
1.67
4.00
3.00
3.33
10.67
8.00
10.33
5.33
1.00
2.00
3.00
1.33
Average
7.42
9.34
4.58
8.50
2.09
3.00
8.58
1.83
DAS = Days after sowing. T1=Bireshwar, T2=IPM 02/03, T3=Sonali, T4=Samrat, T5=Meha, T6=PM 05, T7=RMG
62, T8=Sukumar
Table.4 Population of whitefly on mungbean plants at different days after sowing on different
varieties (2012)
SL. No.
Treatment
1
2
3
4
5
6
7
8
T1
T2
T3
T4
T5
T6
T7
T8
Population of white fly/plant (DAS)
20
30
40
50
4.00
6.00
8.00
8.33
8.33
8.33
9.33
10.67
2.00
4.33
8.33
4.00
6.33
9.00
9.67
7.00
1.67
2.67
2.33
2.67
2.00
4.33
2.33
3.00
9.67
7.67
9.00
7.00
1.33
1.67
2.33
2.33
Average
6.58
9.17
4.67
8.00
2.34
2.92
8.34
1.92
DAS = Days after sowing. T1=Bireshwar, T2=IPM 02/03, T3=Sonali, T4=Samrat, T5=Meha, T6=PM 05,T7=RMG 62,
T8=Sukumar.
Table.5 Population of whitefly on mungbean plant at different days after sowing on different
varieties (pooled)
SL. No.
Treatment
1
2
3
4
5
6
7
8
T1
T2
T3
T4
T5
T6
T7
T8
Population of white fly/plant (DAS)
20
30
40
50
4.50
6.67
8.17
8.67
8.67
8.17
9.50
10.67
2.17
4.50
8.33
3.50
7.33
8.00
10.00
7.67
1.50
2.67
2.00
2.67
1.83
4.17
2.67
3.17
10.17
7.83
9.67
6.17
1.17
1.83
2.67
1.83
Average
7.00
9.25
4.63
8.25
2.21
2.96
8.46
1.88
DAS = Days after sowing.
T1=Bireshwar, T2=IPM 02/03, T3=Sonali, T4=Samrat, T5=Meha, T6=PM 05, T7=RMG 62, T8=Sukumar
95
Int.J.Curr.Microbiol.App.Sci (2017) 6(4): 88-98
Figure.1 Effect of disease incidence and severity on different varieties of mungbean against
mosaic yellow virus disease of pooled
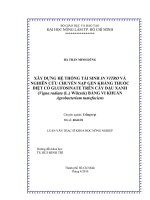
Figure.2 Effect of yield on different varieties of mungbean against mungbean yellow
mosaic virus (Pooled)
Figure.3 Population of whitefly on different varieties of mungbean plant (Pooled)
96
Int.J.Curr.Microbiol.App.Sci (2017) 6(4): 88-98
The average number of Whitefly was lowest
in Sukumar followed by Meha, PM 05 and the
number of whitefly was 1.92, 2.34 and 2.92
respectively. There was a positive correlation
between average number of whitefly per plant
and incidence of the disease.
yellow mosaic symptom was 4.44 and 6.25 in
ML-5 and MUM-2, respectively. The average
MYMV infection percentage was 2.22, 3.12
in ML-5 and MUM-2 respectively, compared
to 100.0 in ‘K-851’ (control cultivar). Most of
the cultivars were highly susceptible
(72.22%) to the pathogen.
Significant highest yield was obtained from
Sukumar variety and it was 1.82 kg/plot
followed by Meha and PM 05 variety and the
yield of Mungbean plant recorded (Table 2)
were 1.69 and 1.67 kg/plot respectively. Yield
of T5 and T8 were statistically at par. Lowest
yield was found in Samrat (0.50 kg/plot),
RMG 62 (0.57 kg/plot), Bireshwar (1.17
kg/plot) and IPM 02/03 (1.17 kg/plot).
Hamid et al., (2004) reported, BUmug-1,
released in Bangladesh in the year 2000, is a
new mungbean cultivar released for stable
and high yield with combined resistance to
mungbean yellow mosaic virus. It is an early
maturing bold seeded material with
synchronous pod maturity.
In conclusion screening of eight Mungbean
varieties/lines under field condition was
studied to ascertain its resistance against
yellow mosaic virus disease. It was found that
none of the varieties/ lines showed complete
resistance but the incidence of the disease
varied from 36.70% to 9.12%. The significant
lowest incidence was recorded in Sukumar
(9.12%), followed by Meha (9.39%).
Moderate incidence was found in Sonali
(11.55%), PM 05(13.30%) and IPM
02/03(15.95%). Highest yield was recorded in
Sukumar (1.80 kg/plot) and it was at par with
Meha (1.71 kg/plot). Significant lowest
disease severity was also recorded in
Sukumar (3.60 %) and it was statistically at
par with Meha (3.91 %), while the first
symptom appeared 20 days after sowing. The
percentage of incidence was increased with
the increase of the age of the plant, but the
most susceptible period for infection was in
between 30 and 40 DAS.
From two years pooled mean it was found
that, the average number of Whitefly
population (Bemisia tabaci) (Table 3 and
Figure 3) was found highest in variety IPM
02/03 (9.25 per plant), followed by RMG 62,
Samrat, Bireshwar, the average number of
whitefly population was 8.46, 8.25 and 7.00
per plant respectively. The average number of
Whitefly was found lowest in Sukumar
followed by Meha, PM 05 and the number of
whitefly was 1.88, 2.21 and 2.96 respectively.
There was a positive correlation between
average number of whitefly per plant and
incidence of the disease.
Significant highest yield was obtained from
Sukumar variety and it was 1.80 kg/plot
followed by Meha and PM 05 varieties and
the yields of Mungbean plant, recorded (Table
3 and Figure 2) were 1.71 and 1.64 kg/plot
respectively. Yield of Meha and Sukumar
were statistically at par. Lowest yield was
found in Samrat (0.55 kg/plot), RMG 62 (0.58
kg/plots) and Bireshwar (1.12 kg/plots).
Although PM 05 gave significant higher yield
but disease severity and incidence were not
statistically at par. So from the above
discussion it may be concluded that Sukumar
and Meha could be cultivated in the plains of
West Bengal as a tolerant variety and also
used as parental lines. The other variety PM
Pathak et al., (2004) taken a total of 14
cultivars of mungbean and evaluated against
MYMV in Alwar, Rajasthan, India during
2000-01. The percent disease incidence for
97
Int.J.Curr.Microbiol.App.Sci (2017) 6(4): 88-98
Registration of ‘BUmug -1’ mungbean.
Crop Sci., 44(4): 1489.
IIPR, 2011 on Vision 2030.
Mayee, C.D. and Datar, V.V. 1986.
"Phytopathometry". Technical bulletin1, Marathawad Agricultural University,
Prabani, India, P. 146.
Nariani, T.K. 1960. Yellow mosaic of
mungbean. Indian Phytopath., 13: 24 29.
Nene, Y.L. 1972. A survey of viral diseases
of pulse crop in Uttar Pradesh, G.B.
Pant University of Agriculture and
Technology, Pantnagar. U.P., India.
Pathak, A.K. and Jhamaria, S.L. 2004.
Evaluation of mungbean (Vigna radiata
L.) varieties to yellow mosaic virus, J.
Mycol. Pl. Path., 34(1): 64 - 65.
05 may also be used as parental line from the
genetic point of view.
References
Akhtar, K.P., Kitsanachandee, R., Srinives,
P., Abbas, G., Asghar, M.J., Shah,
T.M.,
Atta,
B.M.,
Chatchawankanphanich, O., Sarwar, G.,
Ahmad, M. and Sarwar, N. 2009. Field
evaluation of mungbean recombinant
inbred lines against mungbean yellow
mosaic disease using new disease scale
in Thailand. Plant Pathol. J., 25: 422428.
Annual Report. 2009. AICRP on MULLaRP,
IIPR, Kanpur 208 024.
Hamid, A., Afzal, M.A., Haque. M.M. and
Shanmugasundaram,
S.
2004.
How to cite this article:
Dharnendra Reang, Prasad Singha, Abishak Thapa, Barun Rai, Nirmal Sarkar and Nath, P.S.
2017. Evaluation of Mungbean (Vigna radiata L.) Cultivars for Resistance to Yellow Mosaic
Virus. Int.J.Curr.Microbiol.App.Sci. 6(4): 88-98.
doi: />
98


![Effect of fertility levels and stress mitigating chemicals on nutrient uptake, yield and quality of mungbean [Vigna radiata (L.) Wilczek] under loamy sand soil of Rajasthan](https://media.store123doc.com/images/document/2020_01/09/medium_ftp1578562755.jpg)