Mutation allele frequency threshold does not affect prognostic analysis using nextgeneration sequencing in oral squamous cell carcinoma
Bạn đang xem bản rút gọn của tài liệu. Xem và tải ngay bản đầy đủ của tài liệu tại đây (1.27 MB, 10 trang )
Ma et al. BMC Cancer (2018) 18:758
/>
RESEARCH ARTICLE
Open Access
Mutation allele frequency threshold does
not affect prognostic analysis using nextgeneration sequencing in oral squamous
cell carcinoma
Jie Ma1†, Yong Fu1†, Yao-yao Tu1, Ying Liu1, Yi-ran Tan1, Wu-tong Ju1, Curtis R. Pickering2, Jeffrey N. Myers2,
Zhi-yuan Zhang1* and Lai-ping Zhong1*
Abstract
Background: With the development of sequencing technologies, there may be some disputes on sequencing
analysis. The aim of this study was to investigate different allele frequency thresholds of mutations in targeted
genes on prognostic analyses using a panel of cancer associated gene exons (CAGE) in oral squamous cell
carcinoma (OSCC).
Methods: Forty-six patients were included in this study. Twelve genes were sequenced and analyzed using nextgeneration sequencing from formalin-fixed paraffin-embedded tissues. Allele frequency thresholds of 10, 5, and 3%
were used for prognostic analyses.
Results: With a mean sequence depth of 3199-fold, 99% of CAGE were represented by at least 10 reads. Ninety-four
non-synonymous (missense [70.2%], nonsense [11.7%], splice site [10.6%], and insertion/deletion [7.5%]) mutations were
detected in 40 OSCC patients with an allele frequency threshold of 10%. TP53 (78.3%), NOTCH1 (30.4%), CASP8 (13.0%),
CDKN2A (10.9%), and CDH1 (6.5%) were the most frequently mutated genes. Using allele frequency thresholds of 10, 5,
and 3%, there were no significant differences in clinical outcomes between patients with non-synonymous mutations
and wild type genotypes.
Conclusions: TP53, NOTCH1, CASP8, CDKN2A, and CDH1 are the most frequently mutated genes in OSCC patients.
The allele frequency threshold used in this study does not affect the results of clinical outcome analysis.
Keywords: Oral squamous cell carcinoma, Next-generation sequencing, Mutation allele frequency
Background
Oral squamous cell carcinoma (OSCC) comprises a
major subset of head and neck cancer and has a 5-year
survival rate of approximately 50 to 60%, with lower survival rates for patients who present at late clinical stages
[1]. For decades, the standard treatment for patients
with locally advanced OSCC has been surgery followed
by post-operative radiotherapy or concurrent chemoradiotherapy [2]. Although efforts have been made to
* Correspondence: ;
†
Jie Ma and Yong Fu contributed equally to this work.
1
Department of Oral & Maxillofacial-Head & Neck Oncology, Ninth People’s
Hospital, Shanghai Jiao Tong University School of Medicine, No 639, Zhizaoju
Rd, Shanghai 200011, China
Full list of author information is available at the end of the article
improve treatment modalities and decrease treatmentrelated morbidity, patient outcomes have not improved.
Therefore, it is essential to understand different aspects
of the molecular characteristics underlying this disease
to better understand its behavior and identify more effective ways to treat it.
Next-generation sequencing (NGS) includes sequencing of the whole exome or targeted genes, enabling the
identification of causative mutations, which are targets
for therapy [3–7]. Previously, genomic analyses using
NGS have detected mutations in several genes critical
for tumor growth and survival as well as identified targeted hotspots of other genes. Unfortunately, some of
these studies did not report matched normal control
© The Author(s). 2018 Open Access This article is distributed under the terms of the Creative Commons Attribution 4.0
International License ( which permits unrestricted use, distribution, and
reproduction in any medium, provided you give appropriate credit to the original author(s) and the source, provide a link to
the Creative Commons license, and indicate if changes were made. The Creative Commons Public Domain Dedication waiver
( applies to the data made available in this article, unless otherwise stated.
Ma et al. BMC Cancer (2018) 18:758
sample sequences in addition to those of the tumor
specimens, which can make it challenging to identify
germline mutations that could contribute to the development of these cancers [5, 6, 8, 9].
Using state-of-the-art sequencing techniques, sequence coverage can reach as high as 3000-fold or more
for most regions of the genome. However, several potential bottlenecks remain for accurate sequencing, such as
sequence coverage and the allele frequency of targeted
gene mutations. For NGS studies of cancer samples, the
allele frequency represents the percentage of sequence
reads carrying a mutant allele of an individual patient’s
cancer, which can be influenced by many factors. These
include the infiltration or contamination of tumors with
lymphocytes, stromal tissues, and/or necrotic/infected
tissue, and tumor heterogeneity. Therefore, investigators
have arbitrarily set thresholds for defining the variant allele frequency as mutation. For allele frequency, no universal standard has been established for the allele
frequency threshold for sequencing analysis, and thresholds of 10, 5, and 3% have been reported in the literature
[5, 10, 11]. Furthermore, whether different allele frequencies have an impact on the prognosis of cancer patients has yet to be reported.
In this study, a panel of cancer associated gene exons
(CAGE) including 12 genes (TP53, NOTCH1, CASP8,
CDKN2A, CDH1, ANXA1, EGFR, IGFBP3, TGFB1,
CTNNB1, PTEN, and TP63) were analyzed using NGS
in 46 OSCC patients with both cancerous tissues and
matched non-cancerous tissues. Prognostic analysis was
performed after calling non-synonymous mutations
using allele frequency thresholds of 10, 5, and 3%.
Methods
Patients and samples
Forty-six patients with locally advanced OSCC from
2008 to 2010 were included in this study, which was approved by the Human Research Ethics Committee of the
Ninth People’s Hospital Shanghai Jiao Tong University
School of Medicine [approval number: 2008(12)].
Cancerous tissue samples were derived from biopsy
specimens, while matched non-cancerous tissue samples
were derived from neck dissection specimens; all specimens were formalin-fixed and paraffin-embedded
(FFPE). All patients received radical surgery and postoperative radiotherapy. Four of the patients received docetaxel, cisplatin, and 5-fluorouracil (TPF) induction
chemotherapy prior to definitive treatment with surgery
and radiotherapy.
DNA extraction and quantification
All tissue specimens were reviewed by two pathologists,
and tumor cell areas on hematoxylin-eosin (HE) stained
slides were determined for manual microdissection and
Page 2 of 10
subsequent DNA sequencing. Only tumor cells (appearing as HE-stained) were microdissected as cancerous
samples, with an average tumor purity of 85% (ranging
from 80 to 95%). Five 10-μm FFPE sections from each
block were deparaffinized, and DNA was extracted using
the QIAamp DNA FFPE Tissue Kit (Qiagen, Hilden,
Germany). Quality and quantity of the purified DNA
were measured using the Qubit and Nano-Drop platforms (Thermo Fisher Scientific, Waltham, MA, USA).
Deep sequencing of PCR amplicons
Ten nanograms of DNA was used for multiplex PCR
amplification. Libraries were constructed using the Ion
AmpliSeq Library Kit v2.0 (Thermo Fisher Scientific) according to the manufacturer’s instructions. The quality
of the obtained libraries was evaluated using Agilent
2100 Bioanalyzer on-chip electrophoresis (Agilent Technologies, Palo Alto, CA, USA). Emulsion PCR was performed with the OneTouch DL or OneTouch 2 system
(Thermo Fisher Scientific). Sequencing was run on the
Ion Torrent Personal Genome Machine (Thermo Fisher
Scientific), loaded with a 316 or 318v2 chip as per the
manufacturer’s protocol. Data analysis, including alignment to the hg19 human reference genome as well as
variant calling and filtering, was completed using
Torrent Suite Software v3.6 (Thermo Fisher Scientific).
Filtered variants were annotated using Ion Reporter software v4.4 (Thermo Fisher Scientific).
Mutations confirmation
Selected mutations were confirmed using Sanger sequencing. Sequence variants were compared with the
head and neck squamous cell carcinoma dataset from
the Cancer Genome Atlas (TCGA), dbSNP1000
Genomes, ClinVar database, COSMIC, 5000 Exomes,
OMIM, and Pfam databases. SIFT, Polyphen, Phylop,
and Grantham scores were used to estimate evolutionary
conservation and the effects of amino acid substitutions
on the structure and function of the protein.
In the context of this analysis, a somatic mutation was
considered to be “validated” if: (1) the altered reads
were ≥ 10, (2) non-synonymous mutations had an allele
frequency ≥ 3%, and (3) non-synonymous mutations
were not found in any of the SNP databases. All mutations were visually confirmed using the Integrative
Genomics Viewer (IGV v2.3).
Statistical analysis
Overall survival (OS) was calculated from the date of the
pathological diagnosis to the date of death; disease-free
survival (DFS), locoregional recurrence-free survival
(LRFS), and distant metastasis-free survival (DMFS)
were calculated from the date of the pathological diagnosis to recurrence, locoregional recurrence, or distant
Ma et al. BMC Cancer (2018) 18:758
metastasis or death from any cause, respectively. For descriptive analyses, categorical data were expressed as number and percentage. Survival analysis was conducted using
the Kaplan-Meier method with a Log-rank test. Hazard ratios (HRs) were calculated using the Cox proportional hazards model. All hypothesis-generating tests were two-sided
at a significance level of 0.05. Data were analyzed with
SPSS v. 18.0 for Windows (SPSS Inc., Chicago, IL, USA).
Results
Sequencing results
Among the targeted CAGE (for TP53, NOTCH1, CASP8,
CDKN2A, CDH1, ANXA1, EGFR, IGFBP3, TGFB1,
CTNNB1, PTEN, and TP63), a mean of 3099-fold sequence coverage was achieved, and 99% of the targeted
CAGE was represented by at least 10 reads. Compared to
matched non-cancerous tissues and reference sequences, a
total of 94 non-synonymous (missense, nonsense, splicing
site, insertion, and deletion) mutations were detected in
the cancerous tissue samples from 40 OSCC patients with
an allele frequency threshold of ≥10%. None of the nonsynonymous mutations were found in the SNP databases.
The average number of non-synonymous mutations per
sample was 2.04. Missense mutations made up the majority (70.2%) of the identified variants, followed by nonsense
mutations (11.7%), insertions/deletions (10.6%), and splice
site mutations (7.5%) (Additional file 1: Table S1).
With an allele frequency threshold of ≥5%, 132 nonsynonymous mutations were detected in the cancerous tissue samples from 41 patients. The average number of nonsynonymous mutations per sample was 2.87. Missense mutations made up the majority (77.3%) of the identified variants, followed by nonsense mutations (9.9%), insertions/
deletions (7.6%), and splice site mutations (5.3%) (Additional
file 2: Table S2). With an allele frequency threshold of ≥3%,
239 non-synonymous mutations were detected in the cancerous tissue samples from 42 patients. The average number
of non-synonymous mutations per sample was 5.20. Similar
to the 10 and 5% thresholds, missense mutations made up
the majority (86.2%) of the identified variants followed by
nonsense mutations (6.7%), insertions/deletions (4.2%), and
splice site mutations (2.9%) (Additional file 3: Table S3).
To verify the reliability of the deep sequencing in our
panel, the remaining genomic DNA was used for validation. TP53 mutation was selected as a representative
example because it was the most frequently mutated
gene with 46 genetic variates in our panel. The TP53
Sanger sequencing was performed to confirm the TP53
variants. Because of the low DNA content, 9 nonsynonymous mutations cannot be validated by Sanger
sequencing; among the other 37 non-synonymous mutations, 70.3% (26/37) of them were successfully validated by Sanger sequencing in the same DNA samples
(Additional file 4: Table S4).
Page 3 of 10
Mutation landscape in the targeted genes
Non-synonymous mutations were identified in all 12
genes when the allele frequency threshold was not defined. However, when the allele frequency threshold was
defined as ≥10%, the most frequently mutated genes
were TP53(78.3%), NOTCH1(30.4%), CASP8(13.0%),
CDKN2A(10.9%), and CDH1(6.5%). Genetic mutations
in the most frequently mutated genes were identified in
40 (87.0%) of the patients. The mutation frequency was
very low in ANXA1 (2.2%), EGFR (2.2%), IGFBP3 (2.2%),
and TGFB1 (2.2%). No non-synonymous mutations were
observed at an allele frequency of ≥10% in CTNNB1,
PTEN, and TP63. The mutation frequency of each gene
when the allele frequency threshold was defined as ≥5%
and ≥ 3% is shown in Table 1.
We then compared our data to the mutational patterns
reported in The Cancer Genome Atlas (TCGA) head and
neck squamous cell carcinoma (HNSCC) database
(containing whole-exome sequencing data from 279 samples) (Table 1). With an allele frequency threshold of
≥10%, the frequency of mutations detected in our study
was similar to that reported in the TCGA database, with
the exception of NOTCH1 and CDH1. The mutation
frequencies of NOTCH1 and CDH1 were much higher
in our cohort than those reported in the TCGA
database (30.4% vs. 18.3%, P = 0.056 and 6.5% vs. 1.4%,
P = 0.062 for NOTCH1 and CDH1, respectively). Further analysis on the molecular characteristics of the detected mutations was based on an allele frequency
threshold of ≥10%.
Molecular characteristics of the detected mutations
TP53 was the most frequently mutated gene, with a total
of 46 genetic variants (33 missense mutations, 4 nonsense mutations, 5 insertions/deletions, and 4 splice-site
mutations) in 36 patients (78.3%). Thirty-three out of 46
(71.7%) p53 mutations were found to be located in the
DNA-binding domain, while 4 (8.7%) mutations were in
the tetramerization motif, and 2 mutations (4.4%) were
in the transactivation motif (Table 2). When compared
to the TCGA database, p.Val216Met, p.Pro151Thr, p.
Arg175His, p.Arg337Cys, p.Arg282Trp, p.Ala159Val, p.
Arg273His, p.Arg248Gln, p.Arg282Trp, p.His193Leu, p.
His178fs, p.Gly245Ser, p.Pro152Leu, p.Tyr220Cys, p.
Gln331Ter, p.Pro151His, p.Arg342Ter, p.Glu286Lys, and
p.Arg213Ter appeared in the TCGA HNSCC database;
p.Cys135Phe, p.Phe113Cys, p.Cys176Phe, p.Trp53Ter, p.
His179Leu, p.Val272Leu, p.Cys135Tyr, p.Arg213Gln, p.
Pro191del, p.Val274Phe, p.Thr253Ile, p.Asp184His, p.
Cys135Phe, p.Val218Glu, p.Ile255Phe, p.Asp148Asn, p.
Asp57Asn, p.Pro128Ser, p.Leu93fs, and p.Pro85Ser appeared in the TCGA database of breast, bladder, renal,
lung, stomach cancers and melanomas. The other mutations listed in the Additional file 1: Table S1, Additional
Ma et al. BMC Cancer (2018) 18:758
Page 4 of 10
Table 1 Mutant frequency of targeted genes in the 46 patients with oral squamous cell carcinoma
Gene
AFa ≥ 3%
AF ≥5%
AF ≥10%
TCGA HNSCC database
p-valueb (AF ≥ 10%)
ANXA1
1/46 (2.2%)
1/46 (2.2%)
1/46 (2.2%)
1/279 (0.4%)
0.263
CASP8
9/46 (19.6%)
7/46 (15.2%)
6/46 (13.0%)
23/279 (8.2%)
0.272
CDH1
6/46 (13.0%)
4/46 (8.7%)
3/46 (6.5%)
4/279 (1.4%)
0.062
CDKN2A
7/46 (15.2%)
5/46 (10.9%)
5/46 (10.9%)
60/279 (21.5%)
0.095
CTNNB1
3/46 (6.5%)
3/46 (6.5%)
0/46 (0)
2/279 (0.7%)
1.000
EGFR
2/46 (4.3%)
2/46 (4.3%)
1/46 (2.2%)
9/279 (3.2%)
1.000
IGFBP3
3/46 (6.5%)
2/46 (4.3%)
1/46 (2.2%)
1/279 (0.4%)
0.263
PTEN
1/46 (2.2%)
0/46 (0)
0/46 (0)
5/279 (1.8%)
1.000
TGFB1
4/46 (8.7%)
2/46 (4.3%)
1/46 (2.2%)
1/279 (0.4%)
0.263
TP63
4/46 (8.7%)
1/46 (2.2%)
0/46 (0)
5/279 (1.8%)
1.000
TP53
36/46 (78.3%)
36/46(78.3%)
36/46 (78.3%)
202/279 (72.4%)
0.406
NOTCH1
23/46 (50.0%)
16/46(34.8%)
14/46 (30.4%)
51/279 (18.3%)
0.056
a
AF: allele frequency
The difference between the mutation rates observed in our cohort and those in the TCGA HNSCC database
Note: Mutation frequency provided how often a mutation may be expressed in a particular genetic population. Allele frequency is the relative frequency of an
allele of a gene at a particular locus in a population. Non-synonymous mutations were identified in all the 12 genes if the threshold of allele frequency was
defined as ≥3%, ≥5% and ≥ 10%. When compared to the mutational patterns reported in The Cancer Genome Atlas (TCGA) head and neck squamous cell
carcinoma (HNSCC) database (containing the whole-exome sequencing data from 279 samples), with the threshold of allele frequency of ≥10%, the frequency
of mutations detected in our study was similar to TCGA database, with the exception of NOTCH1and CDH1
b
file 2: Table S2, Additional file 3: Table S3 did not appear
in the TCGA database.
NOTCH1 was also frequently mutated, with a total of
25 genetic variants (22 missense mutations, 2 insertions
and deletions, and 1 splice site mutation) in 14 patients
(30.4%). Nineteen out of 25 (76.0%) mutations were found
to be located in the EGF-like repeat domains, and 5 (20.
0%) mutations were in the intracellular domain, including
1 mutation in the ankyrin repeat domain (Table 2). When
compared to the TCGA database, p.Ala465Thr and p.
Asp338Asn appeared in the TCGA HNSCC database; p.
Asn718Ser, p.Glu488Lys, p.Pro2332Leu, p.Arg2272Cys, p.
Arg365Cys, p.Val1229Ile, p.Gly1195Arg, p.Pro1097Ser, p.
Ala1338Thr, p.Ser2336Asn, p.Ser836Asn, p.Pro668Ser, p.
Phe436Leu, p.Thr767Ile, p.Met2362Ile, p.Ser1541Asn, p.
Pro148Leu, p.Arg1758Cys, p.Arg1211Gln, and p.
Thr588Ile appeared in the TCGA breast, esophageal,
colon, bladder, prostate, lung cancers and melanomas.
Eight CASP8 mutations were identified in six patients
(13.0%). Among them, 6 mutations were inactivating mutations (4 nonsense mutations and 2 deletions); the other
2 mutations were missense mutations. Seven (87.5%) mutations were located in the caspase homology domain, and
the other was in the death effector domain (Table 2).
Table 2 Location of non-synonymous mutations in the conserved domains in the 46 patients with oral squamous cell carcinoma
Note: Molecular characteristics of the detected mutations for the targeted genes. The p53 DNA-binding domain was the major conserved domain in 28 patients
(60.9%), and the notch1 EGF-like repeats domain was the second major conserved domain in 13 patients (28.3%), followed by the caspase homology domain of
caspase 8 in five patients (10.9%), tetramerization motif of p53 in four patients (8.7%), and ankyrin repeats of p16 in four patients (8.7%)
Ma et al. BMC Cancer (2018) 18:758
When compared to the TCGA database, p.Arg494Ter and
p.Arg472Ter appeared in the TCGA HNSCC database; p.
Lys532fs and p.Gln417Ter appeared in the TCGA colorectal and bladder cancer database, respectively.
Five CDKN2A mutations were identified in five patients (10.4%). Most of them were inactivating mutations, including 2 nonsense mutations, 1 insertion, and 1
splice site mutation; the other was missense mutation.
Four CDKN2A mutations were located in ankyrin repeats, and the other was a splice site mutation. When
compared to the TCGA database, p.Glu120Ter appeared
in the TCGA HNSCC database.
Three CDH1 mutations were identified in three patients (6.5%). Two mutations were missense mutations
and the other was a nonsense mutation. Two CDH1 mutations were located in the cadherin repeat domain, and
the other was in the cadherin cytoplasmic region. p.
Trp532Ter and p.Arg90Trp appeared in the TCGA cervical and mixed cancer database, respectively.
Three EGFR mutations were identified in one patient
(2.2%), including 2 missense mutations and 1 splice site
mutation. The 2 missense mutations were located in the
furin-like repeats of EGFR. Two missense IGFBP3 mutations were identified in one patient (2.2%), and these
mutations were located in the thyroglobulin type-1 repeat domain and the IGFBP homology domain, respectively. One missense ANXA1 mutation was identified in
one patient (2.2%), but it was not located in the conservative region of annexin a1. One missense TGFB1 mutation was identified in one patient (2.2%), which was in
the latency-associated peptide of TGFβ-1. Some of the
mutations also appeared in the TCGA database.
Mutations in conserved domains
The p53 DNA-binding domain was the major conserved
domain that contained a mutation in 28 patients (60.9%),
and the NOTCH1 EGF-like repeats domain was the second
major conserved domain, with a mutation in 13 patients
(28.3%), followed by the caspase homology domain of caspase 8 that was mutated in five patients (10.9%), the tetramerization motif of p53 with a mutation in four patients
(8.7%), and the ankyrin repeat domains of p16, which contained mutations in four patients (8.7%) (Table 2).
There was one patient (2.2%) who had 8 mutations in
conserved domains of various genes, and one patient
(2.2%) had 4 mutations in these conserved domains,
followed by three patients (6.5%) with 3 mutations, 13
patients (28.3%) with 2 mutations, and 19 patients
(41.3%) with just 1 mutation in a conserved domain.
Relationships between mutations and patient
characteristics as well as survival
Correlation analysis between non-synonymous mutant
status (including all targeted genes of CAGE) and baseline
Page 5 of 10
characteristics was performed; no significant correlations
were found (Table 3). Survival analysis found no significant differences in outcomes with regard to OS, DFS,
LRFS, and DMFS between patients with non-synonymous
mutations and wild type carriers (Fig. 1).
When the allele frequency thresholds of 5 and 3% were
used, the difference in outcomes between patients with
non-synonymous mutations and wild type carriers
was non-significant (Additional file 5: Figure S1 and
Additional file 6: Figure S2).
Five genes (TP53, NOTCH1, CASP8, CDKN2A, and
CDH1) with an allele frequency of non-synonymous mutations above 10% were selected for further relationship
analysis, and no significant correlations were found between patients with non-synonymous mutations in each
gene and baseline characteristics, with the exception of
NOTCH1 (Additional file 7: Table S5, Additional file 8:
Table S6, Additional file 9: Table S7, Additional file 10:
Table S8, Additional file 11: Table S9). The NOTCH1
non-synonymous mutation rate was higher in T1/T2 patients than that in T3/T4 patients. To investigate the impact of allele frequency threshold on survival analysis, a
univariate Cox model was used with allele frequency
thresholds of 10, 5, and 3%; the difference in OS (Fig. 2)
and DFS (Fig. 3) between patients with non-synonymous
mutations and wild type carriers was not significant.
Discussion
In the present study, we found that when using the different allele frequency thresholds of 10, 5, and 3%, the total
non-synonymous mutation rate in the cancerous tissue
samples was 87.0% (40/46), 89.1% (41/46), and 91.3% (42/
46), respectively. The most frequently mutated genes were
TP53, NOTCH1, CASP8, CDKN2A, and CDH1. Our analysis of the distribution of mutations in these genes will be
helpful for future functional studies. We also found that
using different allele frequency thresholds did not affect
the prognosis of patients with and without nonsynonymous mutations detected by deep NGS.
Deep NGS has been shown to detect low-frequency mutations located in known causative genes [3, 12, 13]. Several studies have found pathogenic mutations in OSCC
using NGS; however, some have only targeted a few genes
or hotspots, while others lacked matched normal control
tissues, making it impossible to rule out germline mutations in the tumor specimens [5, 6, 8, 9]. In the present
study, the mean sequence coverage of targeted CAGE
reached 3099-fold, and the frequency of mutations was
quite similar to that reported in the TCGA HNSCC database, with the only exception being the NOTCH1 gene,
which had a significantly higher mutation frequency in
our cohort than that in the TCGA HNSCC database. The
higher mutation frequency of NOTCH1 gene has also
been reported in studies in the Chinese population [8, 9].
Ma et al. BMC Cancer (2018) 18:758
Page 6 of 10
Table 3 Correlation analysis between non-synonymous mutations of all targeted genes of CAGE and baseline characteristics in the
46 patients with oral squamous cell carcinoma
Characteristics
P value*
Total patients
N = 46
+
Non-synonymous mutations
–
n (%)
n (%)
n (%)
Male
12 (26.1)
10 (25.0)
2 (33.3)
Female
34 (73.9)
30 (75.0)
4 (66.7)
< 60
27 (58.7)
23 (57.5)
4 (66.7)
≥ 60
19 (41.3)
17 (42.5)
2 (33.3)
Tongue
19(41.3)
18(45.0)
1(16.7)
Buccal
6(13.0)
6(15.0)
0(0.0)
Gingiva
6(13.0)
5(12.5)
1(16.7)
Floor of mouth
3(6.5)
2(5.0)
1(16.7)
Palate
9(19.6)
6 (15.0)
3 (50.0)
Retromolar trigone
3(6.5)
3(7.5)
0(0.0)
T1/T2
13(28.3)
11(27.5)
2(33.3)
T3/T4
33 (71.7)
29(72.5)
4(66.7)
N0
14(30.4)
11(27.5)
3 (50.0)
N1
12(26.1)
11(27.5)
1(16.7)
N2
20(43.5)
18(45.0)
2(33.3)
III
22(47.8)
19(47.5)
3 (50.0)
IVA
24(52.2)
21(52.5)
3 (50.0)
Well
13(28.3)
11(27.5)
2(33.3)
Moderately/Poorly
33(71.7)
29(72.5)
4(66.7)
Current/former
19(41.3)
17(42.5)
2(33.3)
Never
27(58.7)
23 (57.5)
4(66.7)
Positive
24(52.2)
22(55.0)
2(33.3)
Negative
22(47.8)
18(45.0)
4(66.7)
Gender
0.644
Age (years)
1.000
Site
0.182
Clinical T stage
1.000
Clinical N stage
0.633
Clinical stage
1.000
Pathological differentiation grade
1.000
Smoking statusa
1.000
Alcohol useb
0.405
*P value from the chi-square test was reported to compare the difference between the patients with and without non-synonymous mutation of
targeted genes based on different baseline characteristics
Former/current smokers defined as at least a one pack-year history of smoking
b
Positive alcohol use was defined as current alcohol use of more than one drink per day for 1 year (12 oz of beer with 5% alcohol, or 5 oz of wine with
12–15% alcohol, or one ounce of liquor with 45–60% alcohol). All other patients were classified as negative alcohol use
Note: No significant correlation was found between the non-synonymous mutant status of all targeted genes of CAGE and baseline characteristics in
the 46 patients with oral squamous cell carcinoma
a
Nevertheless, the overall frequency of targeted CAGE in
this study was consistent with the TCGA HNSCC database. Some subtle differences in specific alleles may reflect
a difference in ethnicity, etiology, or disease stage.
Although many efforts have been made to improve the
depth of NGS coverage, there are some disputes on clinical
applications, such as the sequence coverage and allele
frequencies of targeted gene mutations for prognostic analysis. For allele frequency, no universal threshold has been
established for sequencing analysis, and thresholds of 10, 5,
and 3% have been reported in the literature [5, 10, 11]. In
our study, 10, 5, and 3% allele frequencies were used as
threshold for prognostic analysis, but we found that survival rates between patients with and without non-
Ma et al. BMC Cancer (2018) 18:758
Page 7 of 10
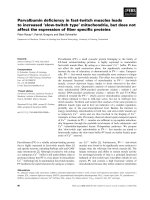
Fig. 1 Survival comparison between patients with non-synonymous mutations (including all targeted genes of CAGE) and wild type carriers using
an allele frequency threshold of 10%. The difference was not significant for overall survival (a), disease-free survival (b), locoregional recurrencefree survival (c), or distant metastasis-free survival (d)
synonymous mutations were similar, not only using the
panel of CAGE, but also using single CAGE genes. Therefore, there is no evidence that an allele frequency threshold
affects prognosis. However, our study included a limited
sample size, and therefore further investigation with larger
sample sizes is recommended for determining a reasonable
allele frequency threshold for clinical outcome analysis in
cancer patients.
According to previous studies [3, 12], TP53 was the
most frequently mutated gene in OSCC, and 71.7% of
mutations were located in the DNA-binding domain,
8.7% in the tetramerization motif, and 4.4% in the transactivation motif. The wild type p53 protein can activate
gene transcription by binding to specific DNA sequences, subsequently controlling the cell cycle checkpoint, which is responsible for maintaining genomic
Ma et al. BMC Cancer (2018) 18:758
Page 8 of 10
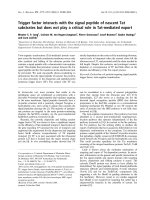
Fig. 2 Using the allele frequencies of 3% (a), 5% (b), and 10% (c), there were no significant differences in overall survival between patients with
non-synonymous mutations in five single genes (TP53, NOTCH1, CASP8, CDKN2A, and CDH1) and wild type carriers
integrity. When TP53 mutations occur in the DNAbinding domain, the p53 protein cannot bind to these
specific DNA sequences, and the rate of gene transcription changes to some extent [14–16]. Meanwhile, mutations in the tetramerization motif might deregulate the
oligomerization process of p53 [15].
For NOTCH1, in this study, more than two-thirds of
the mutations were located within EGF-like repeats,
which could significantly impact NOTCH1 protein activity. EGF-like repeats contain the “ligand-binding” domain, which is the key domain for direct interactions
between NOTCH1 and its ligands (Jagged1 and 2 and
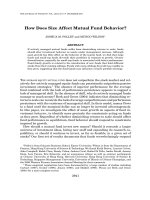
Fig. 3 Using the allele frequencies of 3% (a), 5% (b), and 10% (c), there were no significant differences in disease-free survival between patients
with non-synonymous mutations in five single genes (TP53, NOTCH1, CASP8, CDKN2A, and CDH1) and wild type carriers
Ma et al. BMC Cancer (2018) 18:758
Delta-like 1, 3, and 4) [17, 18]. Mutations in this region
can disturb signal transduction pathways since NOTCH1
signaling depends on these direct interactions. At the
same time, mutations in EGF-like repeat regions can intensify NOTCH1 signaling because the integrity of EGFlike repeats is necessary to suppress this activity [19, 20].
Furthermore, the mutant NOTCH1 protein may not
only lose its function, but could potentially gain new
abilities like mutant p53 [21]. Further investigation is necessary with larger sample sizes to identify potential
novel mechanisms of NOTCH1 mutations in OSCC.
The majority of CASP8 mutations were found in the
caspase homology domain in the present study. Activated caspase-8 will turn this caspase homology domain
into subunit p18 and p10, which could interact with
other caspase family members [22]. This domain has
been reported to be the key part of caspase-8, and most
CASP8 mutations are inactivating mutations [23]. Thus,
suppression of apoptosis caused by CASP8 mutations
may contribute to OSCC pathogenesis.
CDKN2A encodes two proteins, p16 and p14, both of
which act as tumor suppressors through regulation of
the cell cycle. These have been investigated in HNSCC,
and most CDKN2A mutations are inactivating mutations
[3, 24–26]. Based on the transcription of CDKN2A, we
deduced that most of the CDKN2A mutations were in
the ankyrin repeats of p16. The dysregulation of the cell
cycle caused by CDKN2A mutations may also lead to
OSCC development.
There are some limitations in our study. The sample
size was relatively small, and therefore the mutation frequencies reported here might not be fully representative
of a larger population. Thus, a larger sample size is recommended in the future studies. In addition, we only
used one high-throughput next-generation sequencing
platform for mutation analysis, so other sequencing platforms, validation methods (such as digital PCR assays
and Custom TaqMan SNP Genotyping assays) and independent cohorts are needed to validate our findings.
Conclusions
Our results indicate that TP53, NOTCH1, CASP8,
CDKN2A, and CDH1 were the most commonly mutated
genes in a cohort of OSCC patients treated at our center.
The threshold of allele frequency does not affect the results
of prognostic analysis using deep NGS. Further investigation
with larger sample sizes are suggested to fully determine the
most appropriate allele threshold for NGS studies of OSCC.
Page 9 of 10
Additional file 2: Table S2. Non-synonymous mutations (threshold of
allele frequency of ≥5%) in the cancerous tissues from oral squamous cell
carcinoma patients. (DOCX 23 kb)
Additional file 3: Table S3. Non-synonymous mutations (threshold of
allele frequency of ≥3%) in the cancerous tissues from oral squamous cell
carcinoma patients. (DOCX 24 kb)
Additional file 4: Table S4. Validation of TP53 mutations by Sanger
sequencing in patients with oral squamous cell carcinoma. *NA: the DNA
is not available. (DOCX 16 kb)
Additional file 5: Figure S1. Survival comparison between patients
with non-synonymous mutations (including all targeted genes of CAGE)
and wild type using the threshold of allele frequency of 5%, and the
difference was not significant with regard to overall survival (A), diseasefree survival (B), locoregional recurrence-free survival (C), and distant
metastasis-free survival (D). (JPG 285 kb)
Additional file 6: Figure S2. Survival comparison between patients
with non-synonymous mutations (including all targeted genes of CAGE)
and wild type using the threshold of allele frequency of 3%, and the
difference was not significant with regard to overall survival (A),
disease-free survival (B), locoregional recurrence-free survival (C),
and distant metastasis-free survival (D). (JPG 280 kb)
Additional file 7: Table S5. Correlation between TP53 non-synonymous
mutation and baseline characteristics in patients with oral squamous cell
carcinoma. (DOCX 19 kb)
Additional file 8: Table S6. Correlation between NOTCH1 nonsynonymous mutation and baseline characteristics in patients with oral
squamous cell carcinoma. (DOCX 19 kb)
Additional file 9: Table S7. Correlation between CAPS8 nonsynonymous mutation and baseline characteristics in patients with oral
squamous cell carcinoma. (DOCX 19 kb)
Additional file 10: Table S8. Correlation between CDKN2A nonsynonymous mutation and baseline characteristics in patients with oral
squamous cell carcinoma. (DOCX 19 kb)
Additional file 11: Table S9. Correlation between CDH1 nonsynonymous mutation and baseline characteristics in patients with oral
squamous cell carcinoma. (DOCX 19 kb)
Abbreviations
CAGE: Cancer associated gene exons; DFS: Disease-free survival;
DMFS: Distant metastasis-free survival; FFPE: Formalin-fixed and paraffinembedded; HNSCC: Head and neck squamous cell carcinoma;
LRFS: Locoregional recurrence-free survival; NGS: Next-generation
sequencing; OS: Overall survival; OSCC: Oral squamous cell carcinoma;
TCGA: The Cancer Genome Atlas
Acknowledgements
We acknowledge Dr. Tong-Chao Zhao for his help during revising the article.
Funding
This study was supported by research grants 81672660 and 81472519 from
the National Natural Science Foundation of China, by research grant 17SG18
from Shuguang Program of Shanghai Municipal Education Commission, by
research grants JYLJ002 and 17XJ12004 from Shanghai Jiao Tong University
School of Medicine.
Availability of data and materials
The datasets used and/or analyzed during this study are available from the
corresponding author on reasonable request, and most of the original data
are included in this article.
Additional files
Additional file 1: Table S1. Non-synonymous mutations (threshold of
allele frequency of ≥10%) in the cancerous tissues from oral squamous
cell carcinoma patients. (DOCX 22 kb)
Authors’ contributions
LPZ and ZYZ were responsible for the study design, interpretation of the
data and revision of the manuscript. JM and YF were responsible for data
acquisition, analysis of the work presented and the preparation of the
manuscript. YYT, YL, YRT, WTJ, CRP and JNM participated in the experimental
Ma et al. BMC Cancer (2018) 18:758
study, patient management, and data analysis. All authors read and
approved the final manuscript.
Ethics approval and consent to participate
This study was approved by the Human Research Ethics Committee of the
Ninth People’s Hospital Shanghai Jiao Tong University School of Medicine
[approval number: 2008(12)]. Written informed consent was obtained from
all the patients involved in this study.
Consent for publication
Not applicable
Competing interests
The authors declare that they have no competing interests.
Publisher’s Note
Springer Nature remains neutral with regard to jurisdictional claims in
published maps and institutional affiliations.
Author details
1
Department of Oral & Maxillofacial-Head & Neck Oncology, Ninth People’s
Hospital, Shanghai Jiao Tong University School of Medicine, No 639, Zhizaoju
Rd, Shanghai 200011, China. 2Department of Head & Neck Surgery, University
of Texas MD Anderson Cancer Center, Houston, USA.
Received: 20 December 2016 Accepted: 7 May 2018
References
1. Torre LA, Bray F, Siegel RL, et al. Global cancer statistics, 2012. CA Cancer J
Clin. 2015;65:87–108.
2. Pfister DG, Spencer S, Brizel DM, et al. Head and neck cancers, version 2.
2014. Clinical practice guidelines in oncology. J Nat Comprehensive Cancer
Net JNCCN. 2014;12:1454–87.
3. Agrawal N, Frederick MJ, Pickering CR, et al. Exome sequencing of head and
neck squamous cell carcinoma reveals inactivating mutations in NOTCH1.
Science. 2011;333:1154–7.
4. Neskey DM, Osman AA, Ow TJ, et al. Evolutionary action score of TP53
identifies high-risk mutations associated with decreased survival and
increased distant metastases in head and neck cancer. Cancer Res. 2015;75:
1527–36.
5. Chen SJ, Liu H, Liao CT, et al. Ultra-deep targeted sequencing of advanced
oral squamous cell carcinoma identifies a mutation-based prognostic gene
signature. Oncotarget. 2015;6:18066–80.
6. Liao CT, Chen SJ, Lee LY, et al. An ultra-deep targeted sequencing gene
panel improves the prognostic stratification of patients with advanced oral
cavity squamous cell carcinoma. Medicine. 2016;95:e2751.
7. Osman AA, Neskey DM, Katsonis P, et al. Evolutionary action score of TP53
coding variants is predictive of platinum response in head and neck cancer
patients. Cancer Res. 2015;75:1205–15.
8. Song X, Xia R, Li J, et al. Common and complex Notch1 mutations in
Chinese oral squamous cell carcinoma. Clin Cancer Res. 2014;20:701–10.
9. Izumchenko E, Sun K, Jones S, et al. Notch1 mutations are drivers of oral
tumorigenesis. Cancer Prev Res. 2015;8:277–86.
10. Ock CY, Son B, Keam B, et al. Identification of genomic mutations associated
with clinical outcomes of induction chemotherapy in patients with head and
neck squamous cell carcinoma. J Cancer Res Clin Oncol. 2016;142:873–83.
11. Tone AA, McConechy MK, Yang W, et al. Intratumoral heterogeneity in a
minority of ovarian low-grade serous carcinomas. BMC Cancer. 2014;14:982.
12. Stransky N, Egloff AM, Tward AD, et al. The mutational landscape of head
and neck squamous cell carcinoma. Science. 2011;333:1157–60.
13. Pickering CR, Zhang J, Yoo SY, et al. Integrative genomic characterization of
oral squamous cell carcinoma identifies frequent somatic drivers. Cancer
Discov. 2013;3:770–81.
14. Cho Y, Gorina S, Jeffrey PD, Pavletich NP. Crystal structure of a p53 tumor
suppressor-DNA complex: understanding tumorigenic mutations. Science.
1994;265:346–55.
15. Saha T, Kar RK, Sa G. Structural and sequential context of p53: a review of
experimental and theoretical evidence. Prog Biophys Mol Biol. 2015;117:
250–63.
Page 10 of 10
16. Pavletich NP, Chambers KA, Pabo CO. The DNA-binding domain of p53
contains the four conserved regions and the major mutation hot spots.
Genes Dev. 1993;7:2556–64.
17. Kopan R, Ilagan MX. The canonical notch signaling pathway: unfolding the
activation mechanism. Cell. 2009;137:216–33.
18. Chillakuri CR, Sheppard D, Lea SM, Handford PA. Notch receptor-ligand
binding and activation: insights from molecular studies. Semin Cell Dev Biol.
2012;23:421–8.
19. Pei Z, Baker NE. Competition between delta and the Abruptex domain of
notch. BMC Dev Biol. 2008;8:4.
20. de Celis JF, Bray SJ. The Abruptex domain of notch regulates negative
interactions between notch, its ligands and fringe. Development. 2000;127:
1291–302.
21. Brosh R, Rotter V. When mutants gain new powers: news from the mutant
p53 field. Nat Rev Cancer. 2009;9:701–13.
22. Kruidering M, Evan GI. Caspase-8 in apoptosis: the beginning of "the end"?
IUBMB Life. 2000;50:85–90.
23. Blanchard H, Kodandapani L, Mittl PR, et al. The three-dimensional structure
of caspase-8: an initiator enzyme in apoptosis. Structure. 1999;7:1125–33.
24. Al-Kaabi A, van Bockel LW, Pothen AJ, Willems SM. p16INK4A and p14ARF
gene promoter hypermethylation as prognostic biomarker in oral and
oropharyngeal squamous cell carcinoma: a review. Dis Markers. 2014;2014:
260549.
25. Schlecht NF, Ben-Dayan M, Anayannis N, et al. Epigenetic changes in the
CDKN2A locus are associated with differential expression of P16INK4A and
P14ARF in HPV-positive oropharyngeal squamous cell carcinoma. Cancer
Med. 2015;4:342–53.
26. Ishida E, Nakamura M, Ikuta M, et al. Promotor hypermethylation of p14ARF
is a key alteration for progression of oral squamous cell carcinoma. Oral
Oncol. 2005;41:614–22.