Hornerin promotes tumor progression and is associated with poor prognosis in hepatocellular carcinoma
Bạn đang xem bản rút gọn của tài liệu. Xem và tải ngay bản đầy đủ của tài liệu tại đây (2.12 MB, 11 trang )
Fu et al. BMC Cancer (2018) 18:815
/>
RESEARCH ARTICLE
Open Access
Hornerin promotes tumor progression and
is associated with poor prognosis in
hepatocellular carcinoma
Shun-Jun Fu1,2†, Shun-Li Shen1†, Shao-Qiang Li1, Yun-Peng Hua1, Wen-Jie Hu1, BeiChu Guo3*
and Bao-Gang Peng1*
Abstract
Background: The function of hornerin (HRNR), a member of the S100 protein family, is poorly clarified in the
development of human tumors. The role of HRNR in hepatocellular carcinoma (HCC) progression is investigated in
the study.
Methods: The expression levels of HRNR were assessed in tumor samples from a cohort of 271 HCC patients. The
effect of HRNR on proliferation, colony formation and invasion of tumor cells was examined. We further determined
the role of HRNR in tumor growth in vivo by using xenograft HCC tumor models. The possible mechanism of the
HRNR promotion of HCC progression was explored.
Results: We found that HRNR was overexpressed in HCC tissues. The high expression of HRNR in HCCs was
significantly associated with vascular invasion, poor tumor differentiation, and advanced TNM stage. The disease-free
survival (DFS) and overall survival (OS) of HCC patients with high HRNR expression were poorer than those in the low
HRNR expression group. HRNR expression was an independent risk factor linked to both poor DFS (HR = 2.209,
95% CI = 1.627–2.998,P < 0.001) and OS (HR = 2.459,95% CI = 1.736–3.484, P < 0.001). In addition, the knockdown
of HRNR by shRNAs significantly inhibited the proliferation, colony formation, migration and invasion of HCC
tumor cells. HRNR silencing led to the decreased phosphorylation of AKT signaling. Notably, tumor growth was
markedly inhibited by HRNR silencing in a xenograft model of HCC.
Conclusions: HRNR promotes tumor progression and is correlated with a poor HCC prognosis. HRNR may
contribute to HCC progression via the regulation of the AKT pathway.
Keywords: Hornerin, Hepatocellular carcinoma, Tumor progression, Prognosis, AKT
Background
Hepatocellular carcinoma (HCC) is one of the common
malignant diseases and the second most common cause
of cancer-related death worldwide [1]. Furthermore, the
incidence of HCC has also been on the rise. Liver resection or transplantation is considered effective treatments
for HCC. Despite improvements in diagnosis and therapeutic methods for HCC, the prognosis remains poor.
* Correspondence: ;
†
Shun-Jun Fu and Shun-Li Shen contributed equally to this work.
3
Department of Microbiology and Immunology, Hollings Cancer Center,
Medical University of South Carolina, Charleston 29425, USA
1
Department of Liver Surgery, First Affiliated Hospital, Sun Yat-sen University,
Guangzhou 510080, China
Full list of author information is available at the end of the article
Therefore, the identification of novel targets to improve
the clinical management of HCC is essential.
The gene of hornerin gene (HRNR) is clustered on the
chromosome region 1q21 [2]. This gene was first discovered in the mouse embryo epidermis, and was detected
in the skin, tongue, oesophagus and proximal stomach
of adult mice. HRNR is the member of S-100 fused protein family, which has a Ca2+ binding EF-hand domain
at the N-terminus followed by a spacer sequence and an
extensive repetitive domain rich in glycine and serine
[3]. S100 proteins are reportedly involved in the physiological and pathological processes such as the regulation
of protein phosphorylation, inflammatory and immune
reactions, calcium homeostasis, transcription factors,
© The Author(s). 2018 Open Access This article is distributed under the terms of the Creative Commons Attribution 4.0
International License ( which permits unrestricted use, distribution, and
reproduction in any medium, provided you give appropriate credit to the original author(s) and the source, provide a link to
the Creative Commons license, and indicate if changes were made. The Creative Commons Public Domain Dedication waiver
( applies to the data made available in this article, unless otherwise stated.
Fu et al. BMC Cancer (2018) 18:815
cytoskeleton components, cell proliferation, differentiation and death [4]. Differential expression of the S100
family proteins has been found in many tumors [5–7].
HRNR was reported to be involved in breast cancer development and malignant transformation [8]. Previously,
we found that the expression of HRNR in HCC tissues
was elevated via proteomic analysis [9]. However, the
roles of HRNR in the development of HCC have not
been characterized. The purpose of the study was to define the expression levels of HRNR in HCC patients and
its involvement in HCC progression.
Methods
Patients and tissue sample specimens
Total of 271 HCC patients was involved in the study. The
snap-frozen tumors and corresponding peri-cancerous tissues were collected during liver resection at the Department
of Hepatobiliary Surgery, the First Affiliated Hospital of Sun
Yat-sen University from January 2006 to December 2008.
There was no gender discrimination in the treatment offered
(surgery) to patients referred for HCC to our institution.
The study was approved by the Ethics Committee of the
First Affiliated Hospital of Sun Yat-sen University. All patients signed informed consent. The tumor stages were
assessed according to the tumor-node-metastasis (TNM)
system of the 2010 International Union Against Cancer by
the American Joint Committee. The histological grade of tumors was determined by the Edmondson Steiner grading
system [10]. Postoperative patient follow-up was implemented as previously described [11, 12]. The durations of
disease-free survival (DFS) and overall survival (OS) were
defined as previously described [11, 12]. The last follow-up
date was December 31, 2013.
Cell lines and cell culture
The human HCC cell lines HepG2 (Catalogue Number:
HB-8065™), Hep3B (Catalogue Number: HB-8064™) and
PLC/PRF/5 (Catalogue Number: CRL-8024™) were purchased from the American Type Culture Collection
(ATCC; Rockville, MD, USA). The human HCC cell line
Huh7 (Catalogue Number: JCRB0403) was purchased
from the Japanese Cancer Research Bank. The human
HCC cell lines SMMC-7721 (Catalogue Number: TCHu
52), BEL-7402 (Catalogue Number: TCHu 10), QGY-7703
(Catalogue Number: TCHu 43) and normal liver cell line
LO2 (Catalogue Number: GNHu 6) were obtained from
Cell Bank (Shanghai, China).
The cells were cultured in low glucose Dulbecco’s modified
Eagle media (DMEM), including 10% fetal bovine serum
(FBS) supplemented with 100 U/ml penicillin and 0.1 mg/ml
streptomycin, and incubated at 37 °C in a humidified atmosphere at 5% CO2.
Page 2 of 11
Cell transfection and stable cell lines construction
The three lentivirus plasmids containing human HRNR
shRNAs, vector plasmid pLKO.1 puro, packaging plasmid
pHR’8.2 deltaR dvpr and pCMV-VSV-G were purchased
from Sigma (St. Louis, MO, USA). These plasmids were
extracted according to the protocol (GeneJET Plasmid
Maxiprep Kit, Thermo SCIENTIFIC). The lentiviral packaging cells, 293 T cells (CRL-3216™), were transfected with
the three lentivirus plasmids containing human HRNR
shRNAs or vector plasmid pLKO.1 puro and packaging
plasmid pHR’8.2deltaR dvpr and pCMV-VSV-G at 70%
confluence with the use of Lipofectamine 2000 (Invitrogen,
Carlsbad, CA) to produce the lentivirus. Media containing
the lentivirus were added to the target cells for 24 h. After
24 h, the original medium was replaced with fresh medium.
The cells containing the shRNA constructs were selected in
the medium containing puromycin and were cultured for
approximately 2 weeks [13]. The stable cell lines were
validated by western blotting.
Tissue microarray and immunohistochemistry
Tissue microarray construction was done as described
[14]. Two 1 mm diameter core biopsies were removed
from the donor blocks; then, the samples were transferred
to the recipient paraffin block. The immunohistochemical
staining (IHC) was used to the avidin-biotin-peroxidase
complex method. In brief, after rehydration and heating
antigen retrieval, antibodies against human HRNR (1:200,
NBP1–80807; Novus) were then used to the slides and
incubated at 4 °C overnight. The secondary antibody incubation (Envision Polymer-HRP,anti-Rabbit/Mouse) was
then performed at 37 °C for 30 min. The reaction products were visualized with diaminobenzidine staining and
Meyer’s haematoxylin counterstaining. Two investigators
who did not have any clinical or pathological information
regarding the origin of the samples scored the IHC staining. The scores of IHC staining were determined as previously described [15, 16]. Based on the scoring system,
HCC tissues were classified as follows: negative, weak,
moderate, and strong. The expression levels of HRNR
were divided into a HRNR-low group (negative/weak) and
a HRNR-high group (moderate/strong). Each sample was
scored in a blinded manner by two investigators who did
not have any clinical or pathological information regarding the origin of the samples.
Western blot analysis
The cells were washed twice with ice-cold phosphatebuffered saline (PBS). Proteins were extracted from the cells
using RIPA lysis buffer as previously described [17]. The
protein concentration was decided with the Bradford reagent (Bio-Rad Laboratories, Hercules, CA, USA) using
a bovine serum albumin standard. Equal amounts of
total protein were separated on 10% SDS-PAGE gels and
Fu et al. BMC Cancer (2018) 18:815
subsequently transferred onto PVDF membranes. The
membranes were detected overnight at 4 °C with primary
antibodies. Western blot bands were detected by electrochemical luminescence (ECL). Protein expression was confirmed by western blot using the following antibodies:
hornerin (NBP1–80807; Novus), AKT and p-AKT (Ser473)
(9272 and 9271, respectively, Cell Signaling Technology,
Danvers, MA,USA), and GAPDH (sc-47,724, Santa Cruz).
Cell proliferation assay, clone formation assays, cell
migration and invasion assays
The cells were placed into a 96-well plate (5000 cells/
well). At different points in time (1, 2, 3, 4, 5 and 6 days),
10 μl of MTT (5 mg/ml, Sigma, USA) was added to each
well, and the plate was hatched for an additional 4 h.
Then, the medium was exchanged by 150 μl of DMSO
and shaken at room temperature for 10 min. The number of viable cells in each well was calculated by the
absorbance value (λ = 490 nm).
For the colony formation assay, the cells were placed
into a 6-well culture plate (1000 cells/well) and cultured
for 2 weeks. The colonies were stained with 1% crystal
violet and counted.
For the cell migration assay, transwells (24-well, 8-μm
pore size; Millipore, Billerica, MA, USA) were used. A
total of 3 × 10⁴ cells in 300 μl DMEM without FBS were
seeded in the upper chamber and 800 μl of DMEM with
10% FBS was added to the lower chamber. The upper
chamber cells were removed after 48 h incubation and
those on the lower surface of the membrane were fixed
with methanol, then, the cells were stained with crystal
violet, counted (200× magnification), and photographed.
The cell invasion assays were performed the same as the
cell migration assays, except the transwells were precoated
Page 3 of 11
with Matrigel (BD Biosciences, Franklin Lakes, NJ, USA).
All above experiments were done in triplicate.
Xenograft model with human HCC cells
For the xenograft tumor model, 1 × 10⁶ cells were injected
subcutaneously into the right upper flank of 5-week-old
male BALB/C nude mice. Each group contained 6 mice.
Tumor formation in nude mice was monitored over a
32-day period, and the length and width of the tumors
were measured every 4 days and their volumes were
calculated by the formula: V = 0.5 × length × width2. The
animal experiment was approved by and performed in
accordance with the Ethic Committee on the Use of Live
Animals in Teaching and Research at the First Affiliated
Hospital of Sun Yat-sen University. The tumor-bearing
mice were sacrificed by cervical dislocation.
Statistical analysis
Statistical analysis was performed with SPSS software (19.0;
SPSS, Inc., Chicago, IL). Categorical data were analyzed by
the chi-square or Fisher’s exact tests. Cumulative recurrence
and survival rates were analyzed using Kaplan-Meier’s
method and the log-rank test. Cox’s proportional hazards regression model was used to analyze independent prognostic
factors. Variables analyzed by univariate analysis with
P < 0.05 were involved in the multivariate Cox proportional hazards model. P < 0.05 was considered statistically significant.
Results
HRNR expression is related with poor prognosis of HCC
To explore the role of HRNR in HCC, we analyzed the
expression of HRNR in tumor samples from a cohort of
271 HCC patients. Our results showed that HRNR was
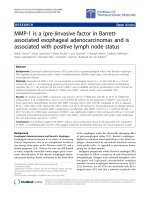
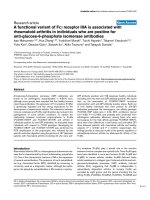
Fig. 1 HRNR overpression in human HCC tumor tissues. Immunohistochemistry of HRNR expression in hepatocellular carcinoma (HCC) tissues.
HRNR expression in the cytoplasm and membrane is scored as negative (a, e), weak (b, f), moderate (c, g), and strong (d, h). Original
magnification, × 100 (a-d); × 400 (e-h)
Fu et al. BMC Cancer (2018) 18:815
Page 4 of 11
Table 1 Relationship between the expression of HRNR and clinicopathological characteristics
P value
Category
Subcategory
Cases
HRNR expression
Gender
male
240
98
142
female
31
16
15
≤ 50
131
56
75
> 50
140
58
82
HCC family history
Yes
18
8
10
No
253
106
147
HBsAg
negative
32
14
18
positive
239
100
139
A
269
113
156
B
2
1
1
45
Low (n = 114)
Age (years)
Child-pugh stage
AFP(ng/ml)
High (n = 157)
< 20
67
22
≥20
204
92
112
Edmonson Grading
I-II
212
96
116
III-IV
59
18
41
Tumor Size (cm)
≤5
96
47
49
> 5
175
67
108
absent
55
27
28
present
216
87
129
capsulated
171
76
95
non-caspulated
100
38
62
Tumor Number
single
185
85
100
multiple
86
29
57
Vascular Invasion
Yes
56
16
40
No
215
98
117
Liver Cirrhosis
Capsulation
TNM Stage
I-II
152
80
72
III-IV
119
34
85
0.826
0.253
0.665
0.837
0.820
0.078
0.042
0.089
0.237
0.300
0.058
0.022
< 0.001
HRNR hornerin, HBsAg hepatitis B surface antigen, AFP alpha fetoprotein
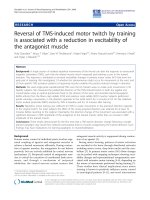
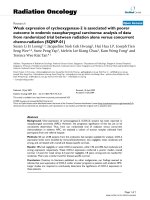
Fig. 2 HRNR expression is associated with poor outcome of human HCC patients. Kaplan–Meier survival curves of DFS and OS for the HRNR low expression
group (n = 114) and the HRNR high expression group (n = 157) based on the results of immunohistochemistry. The results show that HCC patients with low
HRNR expression have better DFS (a) and OS (b) than those with high expression of HRNR
Fu et al. BMC Cancer (2018) 18:815
Page 5 of 11
Table 2 Influence of clinicopathological characteristics on patients’ prognosis by Kaplan-Meier analysis
Variables
n
DFS
P
OS
1-yr
3-yr
5-yr
P
1-yr
3-yr
5-yrs
66.7%
43.8%
37.1%
83.9%
61.3%
54.8%
67.2%
45.0%
37.4%
70.0%
46.4%
40.7%
83.3%
55.6%
55.6%
67.6%
45.1%
37.9%
78.1%
50.0%
43.8%
67.4%
45.2%
38.5%
68.8%
45.7%
39.0%
50.0%
50.0%
50.0%
73.1%
52.2%
47.8%
67.2%
43.6%
36.2%
71.7%
49.5%
43.8%
57.6%
32.2%
22.0%
87.5%
67.7%
60.4%
58.3%
33.7%
27.4%
76.4%
47.3%
41.8%
66.7%
45.4%
38.4%
78.4%
55.0%
49.1%
52.0%
30.0%
22.0%
75.7%
55.1%
49.7%
53.5%
25.6%
16.3%
32.1%
16.1%
8.9%
78.1%
53.5%
47.0%
78.9%
65.8%
63.1%
61.1%
31.2%
21.6%
84.9%
63.2%
57.9%
47.9%
23.5%
15.1%
Gender
Male
240
41.7%
29.2%
25.3%
Female
31
54.8%
38.7%
38.7%
≤ 50
131
41.2%
31.3%
28.2%
> 50
140
48.6%
29.3%
25.4%
0.095
0.034
Age (years)
0.565
0.619
HCC family history
Yes
18
50.0%
27.8%
22.2%
No
253
42.7%
30.4%
27.1%
Negative
32
59.4%
37.5%
37.5%
Positive
239
41.0%
29.3%
25.3%
A
269
43.1%
30.1%
26.6%
B
2
50.0%
50.0%
50.0%
≤ 20
67
55.2%
35.8%
34.3%
> 20
204
39.2%
28.4%
24.3%
I-II
212
47.6%
34.4%
30.5%
III-IV
59
27.1%
15.3%
13.6%
≤5
96
66.7%
50.0%
42.4%
> 5
175
29.7%
19.4%
18.3%
0.864
0.148
HBsAg
0.148
0.366
Child-pugh stage
0.485
0.799
AFP (ng/ml)
0.078
0.063
Edmondson grading
< 0.001
0.002
Tumor size (cm)
< 0.001
< 0.001
Liver Cirrhosis
Absent
55
41.8%
30.9%
27.3%
Present
216
43.5%
30.1%
26.7%
Capsulated
171
53.8%
37.4%
35.6%
Non-caspulated
100
25.0%
18.0%
11.6%
Single
185
51.9%
38.4%
34.0%
Multiple
86
24.4%
12.7%
11.1%
Yes
56
12.5%
7.1%
5.4%
No
215
51.2%
36.3%
32.4%
Low
114
61.4%
49.1%
45.3%
High
157
29.9%
16.6%
13.4%
I-II
152
59.9%
44.7%
40.6%
III-IV
119
21.8%
11.8%
9.2%
0.973
0.399
Capsulation
< 0.001
< 0.001
Tumor number
< 0.001
< 0.001
Vascular invasion
< 0.001
< 0.001
HRNR expression
< 0.001
< 0.001
TNM stage
DFS disease-free survival, OS overall survival. Other abbreviations as in Table 1
< 0.001
< 0.001
Fu et al. BMC Cancer (2018) 18:815
Page 6 of 11
Table 3 Prognostic factors for DFS and OS by multivariate Cox Proportional Hazards Regression Model
Variables
Tumor size (cm) (> 5 vs ≤ 5)
DFS
OS
HR
95%CI
P
HR
95%CI
P
1.849
1.343–2.546
< 0.001
1.829
1.276–2.621
0.001
Capsulation (capsulated vs non-caspulated)
0.621
0.458–0.842
0.002
0.644
0.461–0.899
0.010
Tumor number (single vs mulitiple)
0.614
0.456–0.828
0.001
0.607
0.440–0.838
0.002
Vascular invasion (Yes vs No)
1.817
1.274–2.590
0.001
1.691
1.156–2.474
0.007
HRNR expression (High vs Low)
2.209
1.627–2.998
< 0.001
2.459
1.736–3.484
< 0.001
HR hazard ratio, CI confidence interval. Other abbreviations as in Table 1
expressed in 84.5% (229/271) of HCC tissues. High
HRNR expression was found in 57.9% (157/271) of patient tissues. HRNR expression was localized mainly in
the cytoplasm, with some expression identified on the
cell membranes (Fig. 1).
Next, we evaluated whether there was any association
of HRNR expression with the clinicopathologic factors
of HCC patients. Based on the IHC results, the 271
HCC patients were distributed into two groups: the
HRNR-high expression group (n = 157) and the
HRNR-low expression group (n = 114). The results revealed that high HRNR expression in HCC positively
correlated with vascular invasion (P = 0.002), poor tumor
differentiation (P = 0.042) and advanced TNM stage
(P < 0.001); however, the high expression of HRNR in
HCCs had no significant correlation with age, gender,
HCC family history, hepatitis B, liver function Child-Pugh
stage, cirrhosis, tumor size, tumor number, encapsulation
and alpha-fetoprotein (AFP) (all P > 0.05) (Table 1).
We further explored the prognostic value of HRNR
expression. We found that the 1-, 3-, and 5-year DFS
rates (29.9%, 16.6% and 13.4% VS 61.4%, 49.1% and
45.3%, P < 0.001) and OS rates (61.1%, 31.2% and 21.6%
VS 78.9%, 65.8% and 63.1%, P < 0.001) of HCC patients
in the high HRNR expression group were poorer than
those in the low HRNR expression group (Fig. 2).
Kaplan-Meier analysis indicated that Edmondson grading, tumor size, capsulation, tumor number, vascular
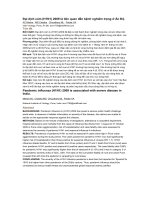
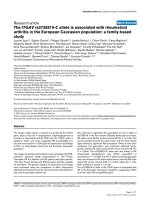
Fig. 3 HRNR expression in HCC cell lines. a Western blot analysis of HRNR expression levels in a panel of HCC cell lines. b HRNR shRNAs inhibited
the expression of HRNR in PLC/PRF/5 and QGY-7703 cells
Fu et al. BMC Cancer (2018) 18:815
Page 7 of 11
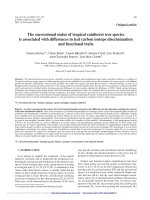
Fig. 4 The effect of HRNR on proliferation. The proliferation was measured by the MTT assay, when HRNR expression was knocked down by
HRNR- shRNAs in (a) PLC/PRF/5 and (b) QGY-7703 cells
invasion, HRNR expression and TNM stage were risk
factors for DFS; gender, Edmondson grading, tumor size,
capsulation, tumor number, vascular invasion, HRNR
expression and TNM stage were risk factors for OS
(Table 2). According to the multivariate Cox regression
analysis, high HRNR expression was found to be an independent prognostic factor linked to both poor DFS
(hazard risk [HR] = 2.209, 95% confidence internal
[CI] = 1.627–2.998,P < 0.001) and OS (HR = 2.459,95%
CI =1 .736–3.484, P < 0.001) (Table 3). These findings
suggest that high HRNR expression was significantly associated with poor prognosis, indicating a potential role for
HRNR in hepatic tumorigenesis.
HRNR enhances proliferation, colony formation, migration
and invasion of HCC cells
To investigate the roles of HRNR in HCC progression,
we first detected the expression levels of HRNR in different HCC cell lines. The result indicated that the expression levels of HRNR were different in HCC cell lines,
Fig. 5 Silencing of HRNR with shRNAs inhibits colony formation of HCC cells. Colony formation assays of (a) PLC/PRF/5 and (b) QGY-7703 cells
when HRNR was knocked down with shRNAs
Fu et al. BMC Cancer (2018) 18:815
with the highest expression detected in PLC/PRF/5 and
QGY-7703 cell lines (Fig. 3a). Thus, we selected these
two cell lines for further analysis. We determined
whether reducing HRNR expression ameliorated tumor
growth. We knocked down HRNR expression in PLC/
PRF/5 and QGY-7703 cell lines using two independent
shRNA constructs (Fig. 3b). The proliferation assay
showed that when HRNR expression was knocked down
by HRNR-shRNAs in PLC/PRF/5 cells, tumor cells proliferation was suppressed compared with the PLC/PRF/5
scramble control cells (P < 0.01). Similarly, the proliferation of QGY-7703-shRNA1-HRNR and QGY-7703shRNA2-HRNR cells was also significantly decreased
(P < 0.01) (Fig. 4).
We next determined the functional role of HRNR in aggressive growth properties of tumor cells by performing colony formation and migration assays. Our results showed
that the silencing of HRNR with shRNA1 and shRNA2
inhibited colony formation in PLC/PRF/5 cells compared to
control cells (P < 0.01). The same phenomena were also observed in QGY-7703 cells (P < 0.01) (Fig. 5). The transwell
migration assay revealed an important suppression of cell
migration in PLC/PRF/5-shRNA1-HRNR and PLC/PRF/
5-shRNA2-HRNR cells compared with the PLC/PRF/
Page 8 of 11
5-scramble control cells. Similarly, when compared to the
QGY-7703-scramble control cells, the migration was less in
both QGY-7703-shRNA1-HRNR and QGY-7703-shRNA2HRNR cells (Fig. 6a). Moreover, the invasion assays demonstrated that knocking down HRNR significantly impaired
the invasiveness of both PLC/PRF/5 and QGY-7703 tumor
cells (Fig. 6b).
HRNR promotes HCC tumor growth in vivo
To further explore the biological importance of HRNR
in HCC, we examined the tumor growth in xenograft
experiments. Human tumor cells were injected subcutaneously in nude mice and tumor growth was monitored.
As represented in Fig. 7a, tumor growth in mice
injected with PLC/PRF/5-shRNA1-HRNR and PLC/
PRF/5-shRNA2-HRNR cells was significantly decreased
compared with the control group. Furthermore, tumor
weight was positively associated with the expression
levels of HRNR. We also found that inhibiting HRNR
reduced tumour growth in the xenograft model with
QGY-7703 tumour cells (Fig. 7b). Collectively, these
data suggest that HRNR plays a critical role in HCC
tumor growth in vivo.
Fig. 6 HRNR enhances tumor cell migration and invasion. Transwell assays of the ability of HRNR in (a) migration and (b) invasion in PLC/PRF/5
and QGY-7703 cells when HRNR was knocked down with shRNAs
Fu et al. BMC Cancer (2018) 18:815
Page 9 of 11
Fig. 7 HRNR promotes HCC growth in vivo. BALB/C nude mice (n = 6) were injected with (a) PLC/PRF/5-scramble, PLC/PRF/5-shRNA1-HRNR and
PLC/PRF/5-shRNA2-HRNR cells; (b) QGY-7703-scramble, QGY-7703-shRNA1-HRNR and QGY-7703-shRNA2-HRNR cells. Tumor growth was
monitored. Mice were sacrificed on day 32 post-injection; tumors were harvested, and weighted
Loss of HRNR inhibits the phosphorylation of AKT in
HCC cells
Finally, we explored the potential mechanism responsible for HRNR-mediated tumor growth. HRNR is a
member of the S100 protein family. Emerging evidence
has indicated that the functional role of S100 protein
family members, such as S100A1, A100A4 and S100A16,
is closely associated with AKT phosphorylation and activation [18–20]. We proposed that the role of HRNR in
Fig. 8 HRNR influences AKT phosphorylation in HCC cells. Western
Blot analysis of AKT phosphorylation and total AKT expression in
PLC/PRF/5-shRNA-HRNR, QGY-7703-shRNA-HRNR and control cells
HCC might also be through regulating AKT phosphorylation. To test this, we analyzed AKT expression and
phosphorylation by western blot. We found that AKT
phosphorylation was suppressed after knockdown of
HRNA in PLC/PRF/5 and QGY-7703 cells, whereas the
expression level of total AKT was not changed (Fig. 8).
Together, our results imply that HRNR may promote
HCC via AKT phosphorylation.
Discussion
In the study, we firstly detected HRNR expression in 271
HCC samples and HCC cell lines, and found that HRNR
was frequently up-regulated in HCC tissues and cells. Second, we explored the prognostic value of HRNR expression in HCC patients after liver resection. We verified the
clinical importance of HRNR as an independent prognostic indicator for HCC patients after hepatectomy. These
results suggested that HRNR might play a vital role in
cancer progression. Therefore, we investigated how HRNR
contributed to the progression of HCC. We found that
HRNR enhanced cell proliferation and colony formation
as well as migration and invasion in vitro and tumor
growth in vivo.
The S100 protein family, with over 20 members, is
the largest subgroup of calcium binding proteins. The
Fu et al. BMC Cancer (2018) 18:815
proteins in this family have amino acid sequence
similarity as well as the functional EF-hand structure
motif, which plays a vital role in calcium binding via
a helix-loop-helix topology [21]. Proteins containing
this motif are taken in various pathological and
physiological cell functions [22–24]. As a member of
the S100 protein family, the role of HRNR still remains to be fully understood, especially in cancer research. The expression of HRNR was found in breast
epithelial cells, macrophages and stromal fibroblasts.
The unique regulation of HRNR expression was found
in different stages of mammary development. The expression levels of HRNR were increased in invasive
lobular carcinomas and less aggressive breast carcinoma compared to invasive ductal carcinomas phenotypes. During the induction of apoptosis, the expression
levels of HRNR were altered [25]. Choi et al. demonstrated that HRNR was included in breast cancer development and malignant conversion from preinvasive
lesions [8]. Our results demonstrated that HRNR promoted tumor progression and was connected with poor
prognosis for HCC.
The activation of AKT kinase is essential for metastatic pathways, containing the escape of tumor cells
from the tumor microenvironment, migration into and
then out of the circulation, stimulation of angiogenesis,
obstruction of apoptosis, and initiation of proliferation
[26, 27]. A series of processes in metastasis are regulated
by the activation of AKT via phosphorylation at Thr-308
by PDK1 and Ser-473 by a complex involving mammalian/mechanistic target rapamycin/Rictor (mTORC2)
[26, 28]. AKT phosphorylates many cellular proteins,
containing GSK3α, GSK3β, BAD, and p27KIP1 to
promote survival and cell cycle [29]. In addition, AKT
phosphorylates and inactivates Tuberin, a GTPase-activating protein (GAP) for the Ras homologue Rheb.
Inactivation of Tuberin permits GTP-bound Rheb to
gather and activate the mammalian/mechanistic target
rapamycin//Raptor (mTORC1) complex, which finally
regulates protein synthesis, RNA translation, cell
growth, and autophagy [30]. We have also provided
evidence suggesting that HRNR signals through the
AKT cascade to regulate cancer cell behavior; however, how HRNR links to AKT activation remains to
be determined. More investigation is needed to delineate the signaling mechanism underlying the AKT activation by HRNR.
Conclusions
Our results demonstrated that HRNR, which is frequently overexpressed in HCC, was linked with aggressive tumor phenotypes and poor prognosis for HCC
patients after liver resection. In addition, the in vitro
and in vivo assays validated the promoting role of
Page 10 of 11
HRNR in HCC progression. Further, we demonstrated
that the loss of HRNR inhibited the phosphorylation of
AKT in HCC cells. Therefore, we propose that strategies designed to downregulate HRNR in HCC patients
with high HRNR expression may provide a promising
approach to alleviate HCC progression.
Abbreviations
CI: Confidence internal; DFS: Disease-free survival; DMEM: Dulbecco’s
modified Eagle media; ECL: Electrochemical luminescence; FBS: Fetal bovine
serum; GAP: GTPase-activating protein; HCC: Hepatocellular carcinoma;
HR: Hazard risk; HRNR: Hornerin; IHC: Immunohistochemical;
mTORC1: mammalian/mechanistic target rapamycin/Raptor;
mTORC2: mammalian/mechanistic target rapamycin/Rictor; OS: Overall
survival; PBS: Phosphatebuffered saline; TNM: Tumor-node-metastasis
Acknowledgements
We thank Professor Jian Zhang from State Key Laboratory of Ophthalmology,
Zhongshan Ophthalmic Center, Sun Yat-sen University for statistical help.
Funding
This study was supported by the National Natural Science Foundation of China
(81702313) and the China Postdoctoral Science Foundation (2015 M582474),
the Natural Science of Guangdong Province (2016A030310177) and the Science
and Technology Project of Guangdong Province (2016A020215184). The
funders had no role in the study design, data collection and analysis, decision
to publish, or preparation of the manuscript.
Availability of data and materials
The datasets used and/or analyzed during the current study are available
from the corresponding author on reasonable request.
Authors’ contributions
SJF, SLS, BCG and BGP were the main authors of the manuscript. They were
involved in the conception, design and coordination of the study as well as in
data analysis, interpretation of results and drafting the manuscript. BCG and BGP
were in charge of all experimental procedures. SQL, YPH, and WJH participated in
the experimental procedures and revised critically the content of the manuscript.
All authors contributed to the interpretation of data and critically revised the
manuscript. All authors read and approved the final manuscript.
Ethics approval and consent to participate
All of cell lines included in this study didn’t require ethics approval for their
use. The study was approved by the Ethics Committee of the First Affiliated
Hospital of Sun Yat-sen University. All patients signed informed consent. The
animal experiment was approved by and performed in accordance with the
Ethics Committee on the Use of Live Animals in Teaching and Research at
the First Affiliated Hospital of Sun Yat-sen University.
Consent for publication
Not applicable.
Competing interests
The authors declare that they have no competing interests.
Publisher’s Note
Springer Nature remains neutral with regard to jurisdictional claims in
published maps and institutional affiliations.
Author details
1
Department of Liver Surgery, First Affiliated Hospital, Sun Yat-sen University,
Guangzhou 510080, China. 2Department of Hepatobiliary Surgery, Zhujiang
Hospital, Southern Medical University, Guangzhou 510280, China.
3
Department of Microbiology and Immunology, Hollings Cancer Center,
Medical University of South Carolina, Charleston 29425, USA.
Fu et al. BMC Cancer (2018) 18:815
Received: 25 October 2017 Accepted: 2 August 2018
References
1. World Health Organization. GLOBOCAN 2012: Estimated Cancer Incidence,
Mortality and Prevalence Worldwide in 2012. />fact_sheets_cancer.aspx. Accessed 3 May 2014.
2. Srikrishna G, Freeze HH. Endogenous damage-associated molecular pattern
molecules at the crossroads of inflammation and cancer. Neoplasia. 2009;11:
615–28.
3. Makino T, Takaishi M, Morohashi M, Huh NH. Hornerin, a novel profilaggrinlike protein and differentiation -specific marker isolated from mouse skin.
J Biol Chem. 2001;276:47445–52.
4. McKiernan E, McDermott EW, Evoy D, Crown J, Duffy MJ. The role of S100
genes in breast cancer progression. Tumour Biol. 2011;32:441–50.
5. Zhang H, Liu J, Yue D, Gao L, Wang D, Zhang H, et al. Clinical significance
of E-cadherin, β-catenin, vimentin and S100A4 expression in completely
resected squamous cell lung carcinoma. J Clin Pathol. 2013;66:937–45.
6. Saleem M, Kweon MH, Johnson JJ, Adhami VM, Elcheva I, Khan N, et al.
S100A4 accelerates tumorigenesis and invasion of human prostate cancer
through the transcriptional regulation of matrix metalloproteinase 9. Proc
Natl Acad Sci U S A. 2006;103:14825–30.
7. Liu H, Wang L, Wang X, Cao Z, Yang Q, Zhang K. S100A7 enhances invasion
of human breast cancer MDA-MB-468 cells through activation of nuclear
factor-κB signaling. World J Surg Oncol. 2013;11:1–8.
8. Choi J, Kim DI, Kim J, Kim BH, Kim A. Hornerin is involved in breast Cancer
progression. J Breast Cancer. 2016;19:142–7.
9. Shen SL, Qiu FH, Dayarathna TK, Wu J, Kuang M, Li SS, et al. Identification of
Dermcidin as a novel binding protein of Nck1 and characterization of its
role in promoting cell migration. Biochim Biophys Acta. 1812;2011:703–10.
10. Edmondson HA, Steiner PE. Primary carcinoma of the liver: a study of 100
cases among 48,900 necropsies. Cancer. 1954;7:462–503.
11. Fu SJ, Qi CY, Xiao WK, Li SQ, Peng BG, Liang LJ. Glypican-3 is a potential
prognostic biomarker for hepatocellular carcinoma after curative resection.
Surgery. 2013;154:536–44.
12. Fu SJ, Shen SL, Li SQ, Hua YP, Liang LJ, Peng BG. Prognostic value of
preoperative peripheral neutrophil-to-lymphocyte ratio in patients with
HBV- associated hepatocellular carcinoma after radical hepatectomy. Med
Oncol. 2013;30:721.
13. Moffat J, Grueneberg DA, Yang X, Kim SY, Kloepfer AM, Hinkle G, et al.
A lentiviral RNA library for human and mouse genes applied to an arrayed
viral high-content screen. Cell. 2006;124:1283–98.
14. Dai Z, Zhou SL, Zhou ZJ, Bai DS, Xu XY, Fu XT, et al. Capn4 contributes to
tumour growth and metastasis of hepatocellular carcinoma by activation of
the FAK-Src signaling pathways. J Pathol. 2014;234:316–28.
15. Sarela AI, Scott N, Ramsdale J, Markham AF, Guillou PJ.
Immunohistochemical detection of the anti-apoptosis protein, survivin,
predicts survival after curative resection of stage II colorectal carcinomas.
Ann Surg Oncol. 2001;8:305–10.
16. Li Y, Liang Q, Wen YQ, Chen LL, Wang LT, Liu YL, et al. Comparative
proteomics analysis of human osteosarcomas and benign tumor of bone.
Cancer Genet Cytogenet. 2010;198:97–106.
17. Huang B, Cao KY, Li XB, Guo SJ, Mao XP, Wang Z, et al. The expression and
role of protein kinase C (PKC) epsilon in clear cell renal cell carcinoma. J Exp
Clin Cancer Res. 2011;30:88.
18. Zhu W, Xue Y, Liang C, Zhang R, Zhang Z, Li H, et al. S100A16 promotes cell
proliferation and metastasis via AKT and ERK cell signaling pathways in
human prostate cancer. Tumour Biol. 2016;37:12241–50.
19. Zhang K, Zhang M, Zhao H, Yan B, Zhang D, Liang J. S100A4 regulates
motility and invasiveness of human esophageal squamous cell carcinoma
through modulating the AKT/slug signal pathway. Dis Esophagus. 2012;25:
731–9.
20. Afanador L, Roltsch EA, Holcomb L, Campbell KS, Keeling DA, Zhang Y, et al.
The Ca2+ sensor S100A1 modulates neuroinflammation, histopathology
and Akt activity in the PSAPP Alzheimer's disease mouse model. Cell
Calcium. 2014;56:68–80.
21. Wang G, Rudland PS, White MR, Barraclough R. Interaction in vivo and in
vitro of the metastasis-inducing S100 protein, S100A4 (p9Ka) with S100A1.
J Biol Chem. 2000;275:11141–6.
Page 11 of 11
22. Leclerc E, Heizmann CW. The importance of Ca2+/Zn2+ signaling S100
proteins and RAGE in translational medicine. Front Biosci (Schol Ed). 2011;3:
1232–62.
23. Berridge MJ, Bootman MD, Roderick HL. Calcium signalling: dynamics,
homeostasis and remodelling. Nat Rev Mol Cell Biol. 2003;4:517–29.
24. Carafoli E. Calcium signaling: a tale for all seasons. Proc Natl Acad Sci U S A.
2002;99:1115–22.
25. Fleming JM, Ginsburg E, Oliver SD, Goldsmith P, Vonderhaar BK. Hornerin,
an S100 family protein, is functional in breast cells and aberrantly expressed
in breast cancer. BMC Cancer. 2012;12:266.
26. Qiao M, Sheng S, Pardee AB. Metastasis and AKT activation. Cell Cycle. 2008;
7:2991–6.
27. Mayer IA, Arteaga CL. The PI3K/AKT pathway as a target for Cancer
treatment. Annu Rev Med. 2016;67:11–28.
28. Dobashi Y, Sato E, Oda Y, Inazawa J, Ooi A. Significance of Akt activation
and AKT gene increases in soft tissue tumors. Hum Pathol. 2014;45:127–36.
29. Manning BD, Cantley LC. AKT/PKB signaling: navigating downstream. Cell.
2007;129:1261–74.
30. Guertin DA, Sabatini DM. Defining the role of mTOR in cancer. Cancer Cell.
2007;12:9–22.