LV Thạc sỹ_Improving customer satisfaction at LIMVINA company
Bạn đang xem bản rút gọn của tài liệu. Xem và tải ngay bản đầy đủ của tài liệu tại đây (316.64 KB, 79 trang )
1
ACKNOWLEDGMENTS
I would like to express my deepest gratitude to my supervisor, Doctor …..
Hanoi, Oct …
…
1
2
TABLE OF CONTENTS
LIST OF TABLES…………………………………………………………...
LIST OF FIGURES………………………………………………………….
EXECUTIVE SUMMARY………………………………………………….
CHAPTER 1: INTRODUCTION……………………………………………
1.1 Rationale…………………………………………………………………..
1.2. Research problem……………………………………………………….
1.3. Research objective………………………………………………………
1.4. Research questions………………………………………………………
1.5. Research methodology…………………………………………………..
1.6. Research scope…………………………………………………………..
1.7. Thesis structure………………………………………………………….
CHAPTER 2: THEORETICAL BACKGROUND………………………….
4
5
6
8
8
10
11
11
11
13
14
1
2.1. Overview on customer satisfaction……………………………………...
5
1
2.1.1. Customer satisfaction concept………………………………………...
5
1
2.1.2. Factors impacting on customer satisfaction…………………………...
2.2. Service quality concept………………………………………………….
5
18
18
2.2.1. Overview on service quality…………………………………………..
2.3. Service quality model…………………………………………………...
2.3.1. SERVQUAL Instrument………………………………………………
2.3.2. The Expectation-Service Gap Grid Model……………………………
2.4. Factor impacting on Service quality…………………………………….
2.4.1. External factors………………………………………………………..
2.4.2. Internal factors………………………………………………………...
CHAPTER 3: CUSTOMER SATISFACTION AT LIMVINA CO., LTD….
3.1. Overview of LIMVINA CO., LTD……………………………………...
3.2. Research Findings……………………………………………………….
3.2.1. Customer survey result………………………………………………..
3.2.2. Result of in-depth interview…………………………………………..
3.2.3. General Analysis of Customer survey and in-depth interview………
3.2.4. Problems and Causes…………………………………………………
22
24
24
28
29
29
31
33
33
38
38
46
47
5
CHAPTER 4: RECOMMENDATION………………………………………
4.1. Orientation of company about Customer Satisfaction…………………..
3
56
5
6
2
3
4.2. Recommendation for improving customer satisfaction at LIMVINA…..
5
4.2.1. Human resource quality improvement………………………………...
7
5
7
60
4.2.2. Diversifying service…………………………………………………...
4.2.3. Applying customer satisfaction measurement (CSM) in quality of
service…………………………………………………………………………
4.2.4. Strengthening communication with customers………………………...
4.2.5. Expanding service supplied network…………………………………...
4.2.6. Strengthening logistic system…………………………………………….
4.2.7. Recommendation about LIMVINA’s organization structure……………..
CONCLUSION………………………………………………………………..
DECLARATION OF ACADAMIC HONESTY………………………………...
REFERENCES………………………………………………………………..
APPENDICES……………………………………………………………………
3
61
62
63
64
64
66
67
68
70
4
LIST OF TABLE
Table 1
Table 2
Table 2
Table 3
In-depth interview structure………………………………………
LIMVINA’s turnover……………………………………………..
The SERVQUAL Score (Gap Score)…………………………….
The Mean SERVQUAL Score (Mean Gap Score)……………….
13
36
39
42
4
5
LIST OF FIGURES
Figure 1
Figure 2
Figure 3
Figure 4
Figure 5
Figure 6
Figure 7
Figure 8
Figure 9
“Five Gap” Model of Service Quality……………………………
Perceived Service Quality………………………………………...
The Expectation – Service Gap Grid Model……………………..
Limvina’s Organization structure………………………………...
Gap Score Chart…………………………………………………..
The Mean Gap Score by Five Dimensions……………………….
Expectation-service Gap chart……………………………………
Quadrant for Expectation – Service Gap…………………………
LIMVINA’s new organization structure………………………….
25
28
31
38
42
44
45
46
65
EXECUTIVE SUMMARY
5
6
It seems self-evident that companies should try to satisfy their customers.
Satisfied customers usually return and buy more, they tell other people about
their experiences, and they may well pay a premium for the privilege of doing
business with a supplier they trust. Statistics are bandied around that suggest
that the cost of keeping a customer is only one tenth of winning a new one.
Therefore, when we win a customer, we should hang on to them.
However LIMVINA is facing with the problem is that decreasing in its
customer’s loyalty. 5% of customers left LIMVINA to other suppliers are
regarded as alarmed percentage of customer loyalty for LIMVINA.
Moreover, Vietnam is becoming WTO member since 2007 and now on the
way of WTO integration route until 2012. Day by day Vietnam opens its
market larger. This creates both chance & threat for LIMVINA. FDI
increasingly invest into Vietnam. Almost of FDI projects are manufacturing
factories. Demand for generators and generator related services increases. This
is a chance for LIMVINA to extend its market share. However, there is
appearance of more competitors in the industry. Recognizing that customer
satisfaction is the key of success for not only LIMVINA but also for all
companies, the author choose topic “improving customer satisfaction at
LIMVINA CO., LTD” to be the research project for master of business
administration thesis.
The research objects of the thesis are to analyze the situation of customer
satisfaction during using LIMVINA co., ltd’s products & services, to find out
and evaluate factors impacting on customer satisfaction, to understand
customer’s expectation about LIMVINA’s service quality and to propose
recommendations and solutions for Limvina co., ltd to improve its customer
satisfaction.
6
7
To collect primary data, the author conducted a survey with questionnaires,
and in-depth interview. To collect secondary data, the author use LIMVINA’s
reports.
This thesis discussed customer satisfaction at LIMVINA basing on customer
expectation and customers’ perception, customers’ assessment. The structure of
this study was constructed based on the SERVQUAL instrument submitted by
Parasuraman, and the research on the employees of customers in Northern
provinces, with the analytical tool of excel. The purpose of this study was to
discuss the difference between customers’ expectation and customers’
perception. The study used Five Gaps Score Model for reference. To measure
LIMVINA’s service quality and customer satisfaction, the original model was
based on sixteen attributes under five dimensions: Tangible, Reliability,
Responsiveness, Assurance, and Empathy. The Expectation-Service Gap Grid
was also used in the data analysis to identify shortfalls under these five
dimensions. In addition, author also conducted interviews with managers of
purchasing departments, directors of customers in order to find gap service
more detail.
Research results indicated that: Overall, service quality at LIMVINA fell
below customer’s expectation, all attributes had negative mean scores. .
• The customers are not satisfied with company’s ability to provide
service as promised. And the cause is Vietnamese engineers lack
experience.
• Responsiveness of LIMVINA is not on time and quick. And the causes
are weak inventory and logistic activities and company’s location are far
from customer’s place.
• Customers are not satisfied with LIMVINA’s staff enthusiasm. And the
cause is that Employees work passively and they think reward &
contribute is not fair.
7
8
• Range of LIMVINA’s service is narrow, lack of service to meet
customer demand.
• Author found shortfalls about LIMVINA service quality from
customer survey, in-interview managers & director of customers.
Concurrently, author got also their comments for improving quality of
service. From then LIMVINA can improve its customer satisfaction.
Base on the collected data, author analyzed, assessed LIMVINA service
quality and gave several recommendations for improving customer
satisfaction: Human resource quality improvement; expanding service supplied
network, strengthening communication with customer, diversifying service
range, strengthening logistic system, applying Customer Satisfaction
Measurement (CRM) in quality of service and recommendation about
LIMVINA’s organization structure.
CHAPTER 1: INTRODUCTION
1.1. Rationale
COMPANY NAME: LIMVINA CO., LTD
8
9
Head-office: #506, CT3-2 Block, Me Tri Ha Urban zone, Me Tri ward, Tu
Liem Dist., Hanoi
Business scope: Trading
Main trading products: Generator. LIMVINA is the sole agent of
EASTPOWER – the Korean brand name of generator in Vietnam.
Services: engineering services (Installing, maintaining, repair)
Customers: Manufacturing companies.
It seems self evident that companies should try to satisfy their customers.
Satisfied customers usually return and buy more, they tell other people about
their experiences, and they may well pay a premium for the privilege of doing
business with a supplier they trust. Statistics are bandied around that suggest
that the cost of keeping a customer is only one tenth of winning a new one.
Therefore, when we win a customer, we should hang on to them.
During 3 years running the business, LIMVINA sees that 5% of customer left
it for other suppliers. The percentage of customer returns to use LIMVINA’s
product and service is 0%. This has caused decrease in turnover and bad
impact on the company’s long-term strategy, reputation. Through a verbal
survey, we recognize some reasons of decrease in customer’s loyalty are
quality of machine, late delivery time.
Moreover, Vietnam is becoming WTO member since 2007 and now on the
way of WTO integration route until 2012. Day by day Vietnam opens its
market larger. This creates both chance & threat for LIMVINA. FDI
increasingly invest into Vietnam. Almost of FDI projects are manufacturing
factories. Demand for generators and generator related services increases. This
is a chance for LIMVINA to extend its market share. However, there is
appearance of more competitors in the industry. To win in the competition
debate, improving customer satisfaction is essential for LIMVINA CO., LTD.
9
10
The verbal survey is not enough for LIMVINA to find out reason why
customer left it for others and what customers expected about product and
services.
With the above reasons, I choose this topic to do the research with the hope
that the research can help to find out weakness, mistake in our customer
satisfaction policies. Since then, we can avoid mistake and have solution to
increase level of customer satisfaction in the future, reduce time, cost for the
company
1.2. Research Problem
Problem statement: How to improve customer satisfaction at LIMVINA CO.,
LTD
At present, LIMVINA’s customers are manufacturing factories in the Northern
of Vietnam. Almost of them is Korean FDI projects located in Industrial parks.
With power cut often in the summer, keeping stable production is the most
importance requirement for them. That why every factories have to buy
generator and generator related services (installing, maintaining and repair).
Each customer buys generator just 1 or 2 times but to keep the generator work
well they have to buy generator related services monthly or quarterly (after
2500 hours of machine-working.)
However, LIMVINA is facing with the problem is that decreasing in its
customer’s loyalty. 5% of customer who left LIMVINA to other suppliers is
regarded as alarmed percentage of customer loyalty for LIMVINA. This means
that the level of customer satisfaction at LIMVINA is decreasing. “How to
improve customer satisfaction at LIMVINA Co., Ltd” is the problem statement
for this research.
10
11
1.3. Research Objective
The research has four main objectives as follows:
- To analyze the situation of customer satisfaction during using LIMVINA co.,
ltd’s products & services.
- To find out and evaluate factors impacting on customer satisfaction.
- To understand customer’s expectation about LIMVINA’s service quality.
- To propose recommendations and solutions for Limvina co., ltd to improve
its customer satisfaction.
1.4. Research Questions
To match and gain the above objectives, we set out some questions that need to
find the answers to solve the problem:
- What is the current status of customer satisfaction of Limvina’s product &
services quality?
- What are factors impacting on customer satisfaction?
- What are points of view and expectation of customers about product, services
and customer care?
- How to improve customer satisfaction?
1.5. Research Methodology
Data collection:
Sources of data collection: Secondary data & Primary data
Data collection methods for secondary data: From company’s reports,
company profile, website…From these data, we can know the frequency of
buying goods and services of LIMVINA customers. The frequency is an index
to show a level of customer satisfaction.
Data collection methods for primary data:
11
12
To collect primary data, the author did survey and in-depth interview.
* Survey with questionnaires:
Population & Sampling:
Population: 50 companies. They are LIMVINA customers now. Most of them
are 100% FDI projects (textile & garment firms, electronic manufacturing
firms). These 50 companies locate in Northern of Vietnam (Hanoi, Bac Giang,
Hung Yen, Bac Ninh, Ha Nam, Nam Dinh, Vinh Phuc, Phu Tho, Thai Binh,
Hai Duong).
Sample: Base on these figures, the author proposes that the targeted sample
size for this study will be 30 in totals. Because of time and cost, the sampling
technique that the author will use is convenience. 6 customers in Bac Giang
province (include Dinh Tram Industrial zone and Dong Dinh industrial zone),
6 customers in Hung Yen province (including Pho Noi A, B Industrial zones
and outside of IZ), 5 customers in Vinh Phuc province, 4 customers in Bac
Ninh province, 3 customers in Nam Dinh province, 3 customers in Phu Tho
provinces, 1 customer in Ha Nam, 1 customer in Thai Binh, 1 customer in Hai
Duong.
(See questionnaires at Appendix 1, page 70)
* In-depth interviews: Conducted with manager of purchasing department of
these companies, directors, manufacturing managers, and technical managers
who influence on purchasing decision. (10 PEOPLE) (See Guideline for in
depth interview at Appendix 3, page 75)
Table 1: In-depth interview & survey structure
12
13
Interviewee
Data collecting
methods
Qualitative
Managers:10
method
Interview
(In-depth
guideline
interview)
Specialists
and
Engineers:30
Instruments
Quantitative
method (survey)
Type of information
Manager’s
LIMVINA’s
viewpoints
product
of
&
services, their expectation.
specialists’ opinions
questionnaire LIMVINA’
product
about
&
services
* Data analysis method:
The author use Excel computer software to analyze survey result, and selfanalyze information collected from in-depth interview.
1.6. Research Scope
Research scope
Focus:
Determining study object is very important to research. This helps the
researcher know what are they studying and what need to focus much. For
this research, we will emphasize on factors impacting on customer
satisfaction with generator & generator related services of LIMVINA and
solution to improve it.
Location:
Location of research related to object of getting data and geographical area
to collect useful information. This project in implementing in four several
Northern provinces of Vietnam: Hanoi, Vinh Phuc, Bac Ninh, Hung Yen,
Hai Duong, Nam Dinh, Phu Tho, Bac Giang, Thai Binh.
Time:
13
14
Defining time for research can help researcher to know when to collect
data.
With secondary data, we will get the data of the company within 3 years
from 2008 to 2010 and with Primary data; we will spend time from June to
Oct 2010 to conduct survey and in-depth interview to create new data.
1.7. Thesis structure
The study was divided into four chapters
• Chapter 1: Introduction
Including necessity of thesis, background about LIMVINA CO., LTD, problem
statement, research questions, research objectives, research methodology,
scope study and limitation of research.
• Chapter 2: Theoretical Background
This chapter included theoretical background, it presented concept of customer
satisfaction, concept of service, characteristic of service and Limvina’s service,
service indicators,… Besides, SERVQUAL instrument and Expectation –
Service Quality was also presented.
• Chapter 3: Customer satisfaction at LIMVINA CO., Ltd
Overview of LIMVINA CO., LTD together with research finding and
analyzing were presented in this chapter.
• Chapter 4: Recommendation
There would be some recommendations which were presented in this chapter.
CHAPTER 2: THEORETICAL BACKGROUND
14
15
2.1.
Overview on Customer Satisfaction
2.1.1. Customer Satisfaction concept
There are quite a few definition of customer satisfaction. Hereafter are
examples of it:
• Customer satisfaction is a transaction-specific affective response
resulting from the customer’s comparison of product performance to
some pre-purchase standard (Halstead, Hartman and Schmidt 1994)
• Business, government, and other nonprofit organizations need measures
how well products and services (performances) are meeting client needs
and wants so that they can enhance their own and /or society’s wellbeing. The extent to which these needs and wants are met has come to
be called customer satisfaction. (Andreasen 1977)
• Customer satisfaction is a post choice evaluative judgment concerning a
specific purchase selection (Westbrook and Oliver 1991)
• Customer satisfaction results from the interaction of levels of
expectation about anticipated performance and evaluations of perceived
performance. (Miller 1977)
• Customer satisfaction is the most common of all marketing surveys and
is part of the "big three" research studies in marketing that include
market segmentation and concept testing. (according Scott M. Smith)
Most of the above definitions is about consumer satisfaction. When doing
business to business, customers are companies (not consumers), managers
concern more about the concept of industrial customer satisfaction. Industrial
customer satisfaction is usually considered to be based upon the product's
performance relative to expectations for those who participated in the
purchase. (Tanner, John. F.,Jr. Industrial Marketing Management, Elsevier
B.V.1996)
15
16
The participants in the purchase are initiators, users, influencers, deciders,
approvers, buyers, gatekeepers. Studying on these people’s satisfaction, a
company may know where they are standing at levels of customer satisfaction.
So that the company may have solution to improve its business.
2.1.2. Factors impacting on customer satisfaction
Factors impacting on customer satisfaction could be widely classified under
two categories i.e. suppliers behavior and performance of product and services.
The supplier’s behavior mostly depends on the behavior of its senior
subordinates, managers and internal employees. All the functional activities
like customer response, direct product and maintenance services, complaint
management etc. are the factors that rely on how skillful and trained the
internal and human resources of the supplier are.
Performance of products and services. This depends on the capability of
supplier to how to nurture the products and service efficiently and how skilled
the employees are. It’s all about how the skills are implemented to demonstrate
engineering, re-engineering and technological aspects of the products and
services. The quality and efficaciousness of the products is also an important
factor that enables compatible and hassle free functions and operations. This
bears to lower maintenance and higher life of the product which is highly
admired by the customers.
If the product is having some problem or compatibility issues and requires
frequent maintenance and support than the customers could get irritated and
possibilities of sudden divert is there which lead to supplier’s financial loss. In
the same way if the product is expecting huge amount of financial and manual
resources then customers could get a feeling of dissatisfaction and worry.
However, if these aspects are handled efficiently by giving class services and
16
17
dealing with complaints effectively then dissatisfied customers could be
converted into long time satisfied customers and retaining them becomes easy.
It is practically impossible for the supplier to provide all the above explained
features. There are always some positive as well as negative features in
products and services which could lead to delight or irritate customers. The
final opinion is the sum of overall experiences which a customer percept. But
it is also true that more the positive aspects, the more the customer is satisfied.
Hence the aim of the supplier should be always to enhance these positive
feelings among all the customers to increase customer satisfaction. The
supplier must identify how to enhance these positive aspects to maximum level
by analyzing the customer’s data and information using CRM system. The
individual liking and disliking of customers differ from customer to customer.
It is hence required to target a customer and identify individual requirement to
make them satisfied.
Having discussed the above factors that affect customer satisfaction we can say
that higher the satisfaction level, higher is the sentimental attachment of
customers with the specific brand of product and also with the supplier. This
helps in making a strong and healthy customer-supplier bonding. This bonding
forces the customer to be tied up with that particular supplier and chances of
defection are very less.
In term of industrial customer, re-buying action manifests level of customer
satisfaction. Factors impacting on buying decision are ones affecting customer
satisfaction. Almost companies have buying center. Buying center includes
several
participants
with
differing
interest,
authorities,
status
and
persuasiveness. Each member of buying center is likely to give priority to very
different decision criteria. For example, engineering personnel may be
concerned primarily with maximizing the actual performance of product;
production personnel may be concerned with ease of use and reliability of
17
18
supply; financial personnel may focus on the economics of purchase;
purchasing may be concerned with operating and replacement cost; union
official may emphasize safety issues, and so on.
Business buyers also respond to many influences when they make their
decisions. Each buyer has personal motivations, perceptions, and preferences,
which are influenced by buyer’s age, income, education, job position,
personality, attitudes toward risk, and culture.
Webster cautions that ultimately, individuals, not organizations, make
purchasing decisions. Individuals are motivated by their own need and
perceptions in attempting to maximize the rewards (pay, advancement,
recognition, and feeling of achievement) offered by the government. Personal
needs “motivate” the behavior of individuals but organizational needs
“legitimate” the buying decision process and its outcomes. People are not
buying “products”. They are buying solutions to two problems: the
organization’s economic and strategic problem and their own personal
“problem” of obtaining individual achievement and reward. In this sense,
industrial buying decisions are both “rational” and “emotional”, as they serve
both the organizational and the individual needs.
2.2.
Service Quality Concept
2.2.1. Concept and characteristic of service
Concept of service
Many definitions of service were available but all contain a common them of
intangibility and simultaneous consumption. The following represented a
sample of service definitions:
18
19
• Services are deeds, processes, and performances. (Valarie A.Zeithaml
and Mary Jo Bitner, Service Marketing, New York: Mc Graw-Hill, 1996,
p.5)
• A service is an activity or series of activities of more or less intangible
nature that normally, but not necessarily, take place in interactions
between customers and service employees and/or physical resources or
goods and/or systems of the service provider, which are provided as
solutions to customer problems.
(Christian Gronroos, Service
Management and Marketing, Lexington, Mass: Lexington Books, 1990,
p.27)
• Most authorities consider the services sector to include all economic
activities whose output is not a physical product or construction, is
generally consumed at the time it is produced, and provides added value
in forms (such as convenience, amusement, timeliness, comport, or
health) that are essentially in tangible concerns of its first purchaser.
(James Brian Quinn, Jordan J.Baruch, and Penny Cushman Paquette,
Scientific Americould, vol.257, no2, December 1987, p.50)
• A service is a time-perishable, intangible experience performed for a
customer acting in the role of co-producer. (James Fitzsimons).
• A precise definition of goods and services should distinguish them on
the basis of their attributes. A good is a tangible physical object or
product that could be created and transferred; it has an existence over
time and thus could be created and used later. A service is intangible and
perishable. It is an occurrence or process that is created and used
simultaneously or nearly simultaneously. While the consumer could not
retain the actual service after it is produced, the effect of the service
could be retained. (Earl Sasser R.Paul Olsen, and D.Daryl Wykoff,
Management of Service Operations, Boston: Allyn and Bacon, 1987,
p.8).
19
20
LIMVINA’s service is a process from checking machine, finding out problem
and cause, supplying spare-part to action of changing parts for the machine,
cleaning, adjusting machine and testing operation. The result of service is
stably operation of the machine.
2.2.2. Overview of Service quality
a. Expected service quality
Expectation was defined by Parasuraman, Zeithaml, and Berry (1988,p.17) as
“desires of wants of customers, what they felt a service provider should offer
rather than would offer. However Parasuraman, Zeithml, and Berry (1990,
p.12) noted that the expected service concept was “intended to measure
customers” normative expectation,” and that these expectations represent and
“ideal standard” of performance.
Expected service quality played a major role in the service consumer decisionmaking process. In the pre-purchase stage, expected service quality plays
influence service consumer decisions on which brand or service to buy, which
service provider was chosen. During consumption, expected service quality
could be affected by the attitudes of service-man, of service woman or very
service. In the post-purchase stage, expected service quality form the basis of
evaluations of satisfaction.
Some studies have treated expected service quality as a static variable that
exerted both direct and indirect influence on customer satisfaction. In these
studies, customer expectations were formed prior to consumption; they served
as comparative referents for quality judgments, for determining customer
satisfaction, and ultimately for behavior intentions. It has been suggested that
marketers who wish to understand and favorably influence customer
satisfaction need to understand and influence customer expectations
20
21
(Anderson, 1973). Success in influencing customer satisfaction may depend, in
part, on understanding how customer expectations are developed and updated.
In this case, expectations were viewed as dynamic since they may change as a
result of the customer’s experience.
b. Perceived service quality
Quality could be defined broadly as superiority or excellence. By extension,
perceived quality could be defined as the consumers’ judgment about a
service’s overall excellence or superiority. According to Zeithaml (1988),
perceived quality was (1) different from objective or actual quality, (2) a
higher level abstraction rather than a specific attribute or a product, (3) a
global assessment that in some cases resembles attitude and (4) a judgment
usually made within a consumer’s evoked set. Whereas fitness for use (Juran,
1984; Lemmink, 1991; Steenkamp, 1989; a.o) was an appropriate definition of
perceived quality of products, it was not when discussing services. The
physical intangibility of services and the often described as the discrepancy
between a customer’s expectations and perceptions of performance (Grönroos,
1983; Lewis and Booms, 1983; Parasuraman, Zeithaml and Berry. 1985, 1988,
1991; Carman, 1990; Colier, 1987; a.o). The rationale behind the development
of this specific definition could be covered by the following espects:
• Because of the inherent physical intangibility of services, mental
processing was extremely important but difficult. A humanistic,
psychological based concept (Jacoby and Olson, 1985) must be treated
consequently;
• Quality seemed to be the most important issue in services marketing.
Whereas the definition of perceived quality of services focuses on the
actual perceived performance of the service and was in this respect
distinctive from e.g. convenience (Holbrook and Corfman, 1985, Van
21
22
Raaij, 1988) and the behavioral costs (Verhallen and Van Raaij, 1986).
Perceived service quality was less precise and territorial;
• Service quality had to be differentiated from the service level, or service
quantity.
• The stated definition made it possible to model service quality
(perception) processes. The SERVQUAL model composed by
Parasuraman et al. (1985) was without doubt the most popular and also
most criticized model in perceived service quality literature.
2.3.
Service Quality Model
2.3.1. SERVQUAL Instrument
This study used a well-known SERVQUAL instrument that was presented by
Parasuraman et al. SERVQUAL was a widely-tested instrument for measuring
service quality (Carman, 1990; Chia, 1997; Coleman, Xiao & Chollett, 1997;
Durvasula, Lysonski & Mehta, 1999; Mad, 1994; Mangold & Babakus, 1991;
Steward, Hope & Muhlemann, 1998). It was developed by Parasuraman,
Zeithaml, and Berry (1988) based on their Gap Model.
22
23
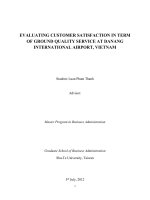
Figure 1: “FIVE GAPS” MODEL OF SERVICE QUALITY
Guest
Recommendations from
friends and relatives
Past experience
Personal needs
Expected Service
Gap 5
Perceived Service
Marketer
Service delivery (actual
experience)
Gap 4
Gap 3
External
communication
to guests
Translation of perceptions into
service performance standards
Gap 1
Gap 2
Management perceptions of
customer expectations
Source: Based on Zeithaml et al. (1988, p.36)
There were five gaps in the Gap Model, namely:
Service Quality Gap (Gap 5)
The Service Gap is the difference between customer expectations and
customer perceptions. Customer expectation is what the customer expects
according to available resources and is influenced by cultural background,
family lifestyle, personality, demographics, advertising, experience with
similar products and information available online. Customer perception is
totally subjective and is based on the customer’s interaction with the product
or service. Perception is derived from the customer’s satisfaction of the
specific product or service and the quality of service delivery. The Service Gap
is the most important gap and in an ideal world the customer’s expectation
would be almost identical to the customer’s perception. In a customer
orientated strategy, delivering a quality service for a specific product should be
23
24
based on a clear understanding of the target market. Understanding customer
needs and knowing customer expectations could be the best way to close the
gap.
External communication Gap (Gap 4)
In some cases, promises made by companies through advertising media and
communication raise customer expectations. When over-promising in
advertising does not match the actual service delivery, it creates a
communication gap. Consumers are disappointed because the promised service
does not match the expected service and consequently may seek alternative
product sources.
Service Performance Gap (Gap 3)
This gap exposes the weakness in employee performance Gap may specify the
service required to support consumers but have subsequently failed to train
their employees, put good processes and guidelines in action. As a result,
employees are ill equipped to manage consumer’s needs. Some of the
problems experienced if there is a delivery gap are:
• Employees lack product knowledge and have difficulty managing
customer questions and issues.
• Organizations have poor human resource policies.
• Lack of cohesive teams and the inability to deliver.
Service Standards Gap (Gap 2)
According to Kasper at al, this gap reflects management’s incorrect translation
of the service policy into rules and guidelines for employees. Some companies
experience difficulties translating consumer expectation into specific service
quality delivery. This can include poor service design, failure to maintain and
24
25
continually update their provision of good customer service or simply a lack of
standardization. This gap may see consumers seek a similar product with better
service elsewhere.
Marketing Information Gap (Gap 1)
The Marketing Information Gap is the difference between the customer’s
expectations of the service provided and company’s provision of the service. In
this case, managers are not aware or have not correctly interpreted the
customer’s expectation in relation to the company’s services or products. If a
knowledge gap exists, it may mean companies are trying to meet wrong or
non-existing consumer needs. In a customer-orientated business, it is important
to have a clear understanding of consumer’s need for service. To close the gap
between the consumer’s expectation for service and management’s perception
of service delivery will require comprehensive market research.
The fifth gap was the difference between consumer expectation and their
perception of service quality – measured by the difference between what
customers expected and what customers perceived about the quality of service.
In addition, gap 5 is a function of gap 1, gap 2, gap 3, and gap 4; that was
Gap 5 = f(gap1, gap2, gap3, gap4)
This means that the service quality was closely related to Internal
Communication,
marketing,
Service
Performance,
Service
Standards,
Marketing Information. Based on the theoretical development of Parasuraman
“Service Quality Model”, the SERVQUAL (SERVice QUALity) instrument was
proposed in 1988. Although, Gap 5 related to other Gaps, but this thesis
focused on Gap 5.
Perceived service quality
25