The role of instrumentation and control systems in power uprating projects for nuclear power plants ( TQL)
Bạn đang xem bản rút gọn của tài liệu. Xem và tải ngay bản đầy đủ của tài liệu tại đây (1.29 MB, 89 trang )
IAEA Nuclear Energy Series
No. NP-T-1.3
Basic
Principles
Objectives
Guides
Technical
Reports
The Role of
Instrumentation and
Control Systems
in Power Uprating
Projects for Nuclear
Power Plants
THE ROLE OF INSTRUMENTATION
AND CONTROL SYSTEMS
IN POWER UPRATING PROJECTS
FOR NUCLEAR POWER PLANTS
The following States are Members of the International Atomic Energy Agency:
AFGHANISTAN
ALBANIA
ALGERIA
ANGOLA
ARGENTINA
ARMENIA
AUSTRALIA
AUSTRIA
AZERBAIJAN
BANGLADESH
BELARUS
BELGIUM
BELIZE
BENIN
BOLIVIA
BOSNIA AND HERZEGOVINA
BOTSWANA
BRAZIL
BULGARIA
BURKINA FASO
CAMEROON
CANADA
CENTRAL AFRICAN
REPUBLIC
CHAD
CHILE
CHINA
COLOMBIA
COSTA RICA
CÔTE D’IVOIRE
CROATIA
CUBA
CYPRUS
CZECH REPUBLIC
DEMOCRATIC REPUBLIC
OF THE CONGO
DENMARK
DOMINICAN REPUBLIC
ECUADOR
EGYPT
EL SALVADOR
ERITREA
ESTONIA
ETHIOPIA
FINLAND
FRANCE
GABON
GEORGIA
GERMANY
GHANA
GREECE
GUATEMALA
HAITI
HOLY SEE
HONDURAS
HUNGARY
ICELAND
INDIA
INDONESIA
IRAN, ISLAMIC REPUBLIC OF
IRAQ
IRELAND
ISRAEL
ITALY
JAMAICA
JAPAN
JORDAN
KAZAKHSTAN
KENYA
KOREA, REPUBLIC OF
KUWAIT
KYRGYZSTAN
LATVIA
LEBANON
LIBERIA
LIBYAN ARAB JAMAHIRIYA
LIECHTENSTEIN
LITHUANIA
LUXEMBOURG
MADAGASCAR
MALAWI
MALAYSIA
MALI
MALTA
MARSHALL ISLANDS
MAURITANIA
MAURITIUS
MEXICO
MONACO
MONGOLIA
MONTENEGRO
MOROCCO
MOZAMBIQUE
MYANMAR
NAMIBIA
NEPAL
NETHERLANDS
NEW ZEALAND
NICARAGUA
NIGER
NIGERIA
NORWAY
PAKISTAN
PALAU
PANAMA
PARAGUAY
PERU
PHILIPPINES
POLAND
PORTUGAL
QATAR
REPUBLIC OF MOLDOVA
ROMANIA
RUSSIAN FEDERATION
SAUDI ARABIA
SENEGAL
SERBIA
SEYCHELLES
SIERRA LEONE
SINGAPORE
SLOVAKIA
SLOVENIA
SOUTH AFRICA
SPAIN
SRI LANKA
SUDAN
SWEDEN
SWITZERLAND
SYRIAN ARAB REPUBLIC
TAJIKISTAN
THAILAND
THE FORMER YUGOSLAV
REPUBLIC OF MACEDONIA
TUNISIA
TURKEY
UGANDA
UKRAINE
UNITED ARAB EMIRATES
UNITED KINGDOM OF
GREAT BRITAIN AND
NORTHERN IRELAND
UNITED REPUBLIC
OF TANZANIA
UNITED STATES OF AMERICA
URUGUAY
UZBEKISTAN
VENEZUELA
VIETNAM
YEMEN
ZAMBIA
ZIMBABWE
The Agency’s Statute was approved on 23 October 1956 by the Conference on the Statute of the IAEA
held at United Nations Headquarters, New York; it entered into force on 29 July 1957. The Headquarters of the
Agency are situated in Vienna. Its principal objective is “to accelerate and enlarge the contribution of atomic
energy to peace, health and prosperity throughout the world’’.
IAEA NUCLEAR ENERGY SERIES No. NP-T-1.3
THE ROLE OF INSTRUMENTATION
AND CONTROL SYSTEMS
IN POWER UPRATING PROJECTS
FOR NUCLEAR POWER PLANTS
REPORT PREPARED WITHIN THE FRAMEWORK
OF THE TECHNICAL WORKING GROUP ON
NUCLEAR POWER PLANT CONTROL AND INSTRUMENTATION
INTERNATIONAL ATOMIC ENERGY AGENCY
VIENNA, 2008
COPYRIGHT NOTICE
All IAEA scientific and technical publications are protected by the terms
of the Universal Copyright Convention as adopted in 1952 (Berne) and as
revised in 1972 (Paris). The copyright has since been extended by the World
Intellectual Property Organization (Geneva) to include electronic and virtual
intellectual property. Permission to use whole or parts of texts contained in
IAEA publications in printed or electronic form must be obtained and is
usually subject to royalty agreements. Proposals for non-commercial
reproductions and translations are welcomed and considered on a case-by-case
basis. Enquiries should be addressed to the IAEA Publishing Section at:
Sales and Promotion, Publishing Section
International Atomic Energy Agency
Wagramer Strasse 5
P.O. Box 100
1400 Vienna, Austria
fax: +43 1 2600 29302
tel.: +43 1 2600 22417
email:
/>
© IAEA, 2008
Printed by the IAEA in Austria
October 2008
STI/PUB/1331
IAEA Library Cataloguing in Publication Data
The role of instrumentation and control systems in power uprating
projects for nuclear power plants / report prepared within the
framework of the Technical Working Group on Nuclear Power Plants
Control and Instrumentation. — Vienna : International Atomic
Energy Agency, 2008.
p. ; 29 cm. - (IAEA nuclear energy series, ISSN 1995-7807 ; no.
NP-T-1.3)
STI/PUB/1331
ISBN 978–92–0–102508–1
Includes bibliographical references.
1. Nuclear power plants — Management. 2. Nuclear power plants —
Safety measures. I. International Atomic Energy Agency. II. Series.
IAEAL
08-00536
FOREWORD
The IAEA’s activities in nuclear power plant operating performance and life cycle management are aimed
at increasing Member State capabilities in utilizing good engineering and management practices developed and
transferred by the IAEA. In particular, the IAEA supports activities focusing on the improvement of nuclear
power plant (NPP) performance, plant life management, training, power uprating, operational licence renewal,
and the modernization of instrumentation and control (I&C) systems of NPPs in Member States.
The subject of the I&C systems’ role in power uprating projects in NPPs was suggested by the Technical
Working Group on Nuclear Power Plant Control and Instrumentation in 2003. The subject was then approved
by the IAEA and included in the programmes for 2004–2007. The increasing importance of power uprating
projects can be attributed to the general worldwide tendency to the deregulation of the electricity market. The
greater demand for electricity and the available capacity and safety margins, as well as the pressure from several
operating NPPs resulted in requests for licence modification to enable operation at a higher power level, beyond
the original licence provisions. A number of nuclear utilities have already gone through the uprating process for
their nuclear reactors, and many more are planning to go through this modification process.
In addition to mechanical and process equipment changes, parts of the electrical and I&C systems and
components may also need to be altered to accommodate the new operating conditions and safety limits. This
report addresses the role of I&C systems in NPP power uprating projects. The objective of the report is to
provide guidance to utilities, safety analysts, regulators and others involved in the preparation, implementation
and licensing of power uprating projects, with particular emphasis on the I&C aspects of these projects.
As the average age of NPPs is increasing, it is becoming common for power uprating in a plant to be
implemented in parallel with other modernization activities in the I&C systems. Any modernization project,
including a power uprating project, provides a good opportunity to improve areas where the I&C design is
judged to be deficient or where the equipment is becoming obsolescent or unreliable.
There are many technical issues associated with the implementation of I&C modifications in NPPs. As
several other IAEA reports have already covered the relevant areas, it is not the intention of this report to
repeat such guidance. However, I&C issues that are either specific to, or particularly important for, the
successful implementation of power uprating projects are covered here.
As time passes and more NPPs operate at uprated power levels, lessons learned from power uprates
accumulate. Some units, for example, have operated beyond their licensed power levels because of errors in
reactor thermal power calculations. Therefore, this report also provides a review of the relevant lessons learned
and gives information on potential concerns.
This report was prepared by a group of experts from Canada, Hungary, the Republic of Korea, Slovenia, Sweden,
the United Kingdom, and the United States of America. The chairperson of the report preparation group was J. Eiler from
Hungary. The IAEA wishes to thank all participants and their Member States for their valuable contributions. The IAEA
officer responsible for this publication was O. Glöckler of the Division of Nuclear Power.
EDITORIAL NOTE
Although great care has been taken to maintain the accuracy of information contained in this publication, neither the
IAEA nor its Member States assume any responsibility for consequences which may arise from its use.
The use of particular designations of countries or territories does not imply any judgement by the publisher, the IAEA, as
to the legal status of such countries or territories, of their authorities and institutions or of the delimitation of their boundaries.
The mention of names of specific companies or products (whether or not indicated as registered) does not imply any
intention to infringe proprietary rights, nor should it be construed as an endorsement or recommendation on the part of the
IAEA.
CONTENTS
1.
2.
3.
4.
INTRODUCTION TO POWER UPRATING . . . . . . . . . . . . . . . . .
1
1.1. Background . . . . . . . . . . . . . . . . . . . . . . . . . . . . . . . . . . . . . . . . . .
1.2. Definition of power uprate . . . . . . . . . . . . . . . . . . . . . . . . . . . . .
1.3. Types of power uprates . . . . . . . . . . . . . . . . . . . . . . . . . . . . . . . . .
1.3.1. Measurement uncertainty recapture power uprates . .
1.3.2. Stretch power uprates, effective margin utilization . . .
1.3.3. Extended power uprates . . . . . . . . . . . . . . . . . . . . . . . . .
1.4. Scope for power uprate . . . . . . . . . . . . . . . . . . . . . . . . . . . . . . . .
1.5. Current status of power uprates, international trends . . . . . . .
1.6. Scope and objectives of the report . . . . . . . . . . . . . . . . . . . . . . .
1.7. Organization of the report . . . . . . . . . . . . . . . . . . . . . . . . . . . . . .
1
1
1
2
2
2
3
3
4
4
LIMITS, MARGINS AND THEIR RELEVANCE TO
INSTRUMENTATION AND CONTROL . . . . . . . . . . . . . . . . . . . .
5
2.1. Definition and application of limits and margins . . . . . . . . . . .
2.1.1. Introduction . . . . . . . . . . . . . . . . . . . . . . . . . . . . . . . . . . . .
2.1.2. Limits . . . . . . . . . . . . . . . . . . . . . . . . . . . . . . . . . . . . . . . . .
2.1.3. Margins . . . . . . . . . . . . . . . . . . . . . . . . . . . . . . . . . . . . . . .
2.2. Relationship between limits, margins and instrumentation
and control . . . . . . . . . . . . . . . . . . . . . . . . . . . . . . . . . . . . . . . . . . .
5
5
6
7
CALCULATION OF THERMAL POWER . . . . . . . . . . . . . . . . . . .
8
3.1. Calculation of thermal power by heat balance . . . . . . . . . . . . .
3.1.1. Constant term . . . . . . . . . . . . . . . . . . . . . . . . . . . . . . . . . .
3.1.2. Power to the purification (feed and bleed) system . . . .
3.1.3. Moderator power . . . . . . . . . . . . . . . . . . . . . . . . . . . . . . .
3.1.4. Power to boilers/steam generators . . . . . . . . . . . . . . . . .
3.2. Contributions to boiler/steam generator power . . . . . . . . . . . .
3.3. Feedwater flow measurements . . . . . . . . . . . . . . . . . . . . . . . . . .
3.4. Feedwater temperature measurements . . . . . . . . . . . . . . . . . . .
3.5. Sources of error in the reactor thermal power calculation . . .
3.6. Thermal power, safety analyses and limits in the operating
licence . . . . . . . . . . . . . . . . . . . . . . . . . . . . . . . . . . . . . . . . . . . . . . .
8
9
9
9
9
10
11
12
12
IMPACT OF POWER UPRATING ON PLANT
INSTRUMENTATION AND CONTROL . . . . . . . . . . . . . . . . . . . .
4.1. Effects of the analyses and operating instructions on
instrumentation and control changes . . . . . . . . . . . . . . . . . . . . .
4.2. Suitability of instruments . . . . . . . . . . . . . . . . . . . . . . . . . . . . . . .
4.2.1. Transmitters . . . . . . . . . . . . . . . . . . . . . . . . . . . . . . . . . . . .
4.2.2. Sufficient accuracy and response time of
measurements . . . . . . . . . . . . . . . . . . . . . . . . . . . . . . . . . .
4.3. Instrumentation and control systems of interest . . . . . . . . . . . .
4.3.1. NSSS pressure control system . . . . . . . . . . . . . . . . . . . . .
4.3.2. Steam generator level measurement and control . . . . .
4.3.3. In-core monitoring system . . . . . . . . . . . . . . . . . . . . . . . .
4.4. Calculations and algorithms . . . . . . . . . . . . . . . . . . . . . . . . . . . . .
7
13
14
16
17
17
18
18
18
19
19
19
4.5. Modification of set points . . . . . . . . . . . . . . . . . . . . . . . . . . . . . . .
4.6. Effects of transients — how instrumentation and control
can help . . . . . . . . . . . . . . . . . . . . . . . . . . . . . . . . . . . . . . . . . . . . . .
4.7. Indirect impact of power uprating . . . . . . . . . . . . . . . . . . . . . . .
4.8. Integration of the original and modernized systems from a
human aspect . . . . . . . . . . . . . . . . . . . . . . . . . . . . . . . . . . . . . . . . .
4.9. Impact of instrumentation and control changes on plant
procedures . . . . . . . . . . . . . . . . . . . . . . . . . . . . . . . . . . . . . . . . . . .
4.10. Benchmarking for uprated operating conditions . . . . . . . . . . .
5.
6.
7.
20
21
21
22
5.1. Human errors . . . . . . . . . . . . . . . . . . . . . . . . . . . . . . . . . . . . . . . . .
5.2. Changes to control room controls, displays and alarms . . . . . .
5.2.1. Controls . . . . . . . . . . . . . . . . . . . . . . . . . . . . . . . . . . . . . . .
5.2.2. Displays . . . . . . . . . . . . . . . . . . . . . . . . . . . . . . . . . . . . . . .
5.2.3. Alarms . . . . . . . . . . . . . . . . . . . . . . . . . . . . . . . . . . . . . . . .
5.3. Changes to the safety parameter display system . . . . . . . . . . . .
5.4. Training and simulation issues . . . . . . . . . . . . . . . . . . . . . . . . . . .
5.5. Critical time schedule for the full scale simulator . . . . . . . . . . .
22
22
22
23
23
24
24
24
REGULATORY ASPECTS . . . . . . . . . . . . . . . . . . . . . . . . . . . . . . . . .
25
6.1. Licensing evaluation . . . . . . . . . . . . . . . . . . . . . . . . . . . . . . . . . . .
6.2. Potential regulatory concerns . . . . . . . . . . . . . . . . . . . . . . . . . . .
6.2.1. General concerns . . . . . . . . . . . . . . . . . . . . . . . . . . . . . . .
6.2.2. MUR type uprates . . . . . . . . . . . . . . . . . . . . . . . . . . . . . .
6.2.3. Stretch and extended power uprates . . . . . . . . . . . . . . .
6.2.4. Test programs . . . . . . . . . . . . . . . . . . . . . . . . . . . . . . . . . .
25
26
26
27
28
29
INSTRUMENTATION AND CONTROL
IMPLEMENTATION GUIDELINES FOR POWER
UPRATING . . . . . . . . . . . . . . . . . . . . . . . . . . . . . . . . . . . . . . . . . . . . . .
29
INSTRUMENTATION AND CONTROL BENEFITS AND
LESSONS LEARNED FROM POWER UPRATING . . . . . . . . . .
8.1. Main instrumentation and control benefits in relation to
power uprating . . . . . . . . . . . . . . . . . . . . . . . . . . . . . . . . . . . . . . . .
8.2. Concerns . . . . . . . . . . . . . . . . . . . . . . . . . . . . . . . . . . . . . . . . . . . . .
8.2.1. General lessons learned . . . . . . . . . . . . . . . . . . . . . . . . . .
8.2.2. Lessons learned from the use of ultrasonic
flowmeters . . . . . . . . . . . . . . . . . . . . . . . . . . . . . . . . . . . . .
9.
19
20
HUMAN AND TRAINING ASPECTS . . . . . . . . . . . . . . . . . . . . . . .
7.1. Introduction . . . . . . . . . . . . . . . . . . . . . . . . . . . . . . . . . . . . . . . . . .
7.2. Instrumentation and control design related issues . . . . . . . . . .
7.2.1. Existing documentation update . . . . . . . . . . . . . . . . . . .
7.2.2. Design and verification preparation . . . . . . . . . . . . . . . .
7.2.3. Administration and design process . . . . . . . . . . . . . . . . .
7.3. Synchronizing activities in an integrated plan for power
uprates . . . . . . . . . . . . . . . . . . . . . . . . . . . . . . . . . . . . . . . . . . . . . .
7.4. Example: MUR specific instrumentation and control
activities . . . . . . . . . . . . . . . . . . . . . . . . . . . . . . . . . . . . . . . . . . . . .
8.
19
KEY RECOMMENDATIONS . . . . . . . . . . . . . . . . . . . . . . . . . . . . . .
29
29
30
30
30
31
32
33
33
33
33
34
36
APPENDIX I:
HEAT BALANCE SENSITIVITY TO
MEASUREMENT ERRORS . . . . . . . . . . . . . . . . . . . . .
39
APPENDIX II: PRINCIPLES OF THE ULTRASONIC
FLOWMETER OPERATION . . . . . . . . . . . . . . . . . . . .
44
APPENDIX III: TRAINING NEEDS FOR DESIGN
CHANGES . . . . . . . . . . . . . . . . . . . . . . . . . . . . . . . . . . . . .
46
REFERENCES . . . . . . . . . . . . . . . . . . . . . . . . . . . . . . . . . . . . . . . . . . . . . . . .
47
BIBLIOGRAPHY . . . . . . . . . . . . . . . . . . . . . . . . . . . . . . . . . . . . . . . . . . . . . .
48
ANNEX: COUNTRY REPORTS . . . . . . . . . . . . . . . . . . . . . . . . . . . . . . . . .
49
GLOSSARY . . . . . . . . . . . . . . . . . . . . . . . . . . . . . . . . . . . . . . . . . . . . . . . . . . .
75
CONTRIBUTORS TO DRAFTING AND REVIEW . . . . . . . . . . . . . . .
77
1. INTRODUCTION TO POWER UPRATING
1.1. BACKGROUND
Increasing plant output is the cheapest source of power when compared to adding new capacity. In
addition, gaining public acceptance to increasing existing nuclear power plant (NPP) capacity has proved to be
significantly less controversial than constructing a new NPP. The greater demand for electricity, and the available
capacity and safety margins in some of the operating NPPs are prompting nuclear utilities to request a licence
modification to enable operation at a higher power level, beyond the original licence provisions. Currently, a
number of nuclear utilities have already gone through the uprating process for their nuclear reactors, and many
more are planning this modification process.
Additionally, in a deregulated electricity market, there is a need for flexibility in the mode of reactor
operation. It is of importance to increase plant output when the demand is high and to allow the flexibility to
make savings when the demand is low. There is also a need to make use of extra margins gained by backfitting
and safety improvements done already for other purposes. Replacement of equipment can be required, as an
example, for plant lifetime extension or for other reasons, and it is usually feasible to optimize the new
equipment for possible higher power levels.
To increase the power output of a reactor, typically a more highly enriched uranium fuel is added. This
enables the reactor to produce more thermal energy and, therefore, more steam, driving the turbine generator to
produce more electricity. In order to accomplish this, plant components, such as pipes, valves, pumps, heat
exchangers, electrical transformers and turbine generator sets must be able to accommodate the conditions that
exist at the higher power level. In smaller scale power uprating activities, the reactor thermal power may remain
at its original level, and fewer and less significant changes may be required.
In addition to mechanical and process equipment changes, parts of the electrical and I&C systems and
components may also need to be altered to accommodate the new operating conditions and safety limits. The
power uprating may, for example, require more precise and more accurate instrumentation, faster data
processing, modification of the protection system set points, and/or more sophisticated in-core monitoring
systems. It is also common that power uprating in an ageing plant is implemented in parallel with other modernization activities in the I&C systems. Therefore, it is essential to find ways to synchronize these parallel tasks in
the I&C field to perform a cost efficient and properly scheduled series of activities serving all the major plant
goals.
Any power uprate project is clearly motivated by economic reasons, where the focus is to increase the
output power at the lowest possible cost. It is, therefore, important to realize that the project might face a need
to include a larger portion of I&C changes than first expected. The existing I&C might be obsolete, or the
intended supplier does not have the necessary skills with the equipment, or the components’ (printed circuit
card, relays, etc.) cost can be equal to or higher than a new, modern digital I&C.
All of these factors must be analysed by the licensee as part of a request for a power uprate, which is
accomplished by amending the plant’s operating licence. The analyses must demonstrate that the proposed new
configuration remains safe and that measures continue to be in place to protect the health and safety of the
public.
1.2. DEFINITION OF POWER UPRATE
The process of increasing the maximum licensed power level, at which a commercial nuclear power plant
may operate, is called a power uprate.
1.3. TYPES OF POWER UPRATES
The three categories of power uprates are:
1
— Measurement uncertainty recapture power uprates;
— Stretch power uprates;
— Extended power uprates.
1.3.1.
Measurement uncertainty recapture power uprates
Measurement uncertainty recapture (MUR) power uprates are those which seek to take advantage of a
more accurate measurement of the reactor thermal power in order to operate closer to, but still within, the
analysed maximum power level. They are achieved by implementing enhanced techniques, such as the improved
performance of plant equipment both on the primary and secondary side, protection and monitoring system,
operator performance, etc. These uprates are less than 2% measured in electrical output power. An example of
the applicability of MUR uprates can be found in the following paragraphs.
At the time of the issuance of initial operating licences to the majority of NPPs in the USA, Title 10 of the
Code of Federal Regulations (10 CFR) Part 50, Appendix K, required licensees to assume a 2.0% measurement
uncertainty for the reactor thermal power and to base their transient and accident analyses on an assumed
power level of at least 102% of the licensed thermal power level. The 2% power margin was intended to address
uncertainties related to heat sources and measuring instruments. Appendix K to 10 CFR Part 50 did not allow
for any credit for demonstrating that the measuring instruments may be more accurate than originally assumed
in the emergency core cooling system (ECCS) rule making. It was not demanded that one should be able to
demonstrate that the uncertainty in the calculation of thermal power was equal to or less than 2% either.
On 1 June 2000, the United States Nuclear Regulatory Commission (NRC) published a final rule (65 FR
34913) that allows licensees to justify a smaller margin for power measurement uncertainty when more accurate
instrumentation is used to calculate the reactor thermal power and calibrate the neutron flux instrumentation.
The amount of the power increase is equal to the difference between the original 2% margin established by
the NRC in 1973 and the justifiable accuracy of the instrumentation being used. For example, if the instrumentation can be demonstrated to measure thermal power to within 0.6%, then a 1.4% power increase could be
obtained.
1.3.2.
Stretch power uprates, effective margin utilization
Stretch power uprates are within the design capacity of the plant. The actual value for percentage increase
in power which a plant can achieve and within which the stretch power uprate category can stay is plant specific,
and depends on the operating margins included in the design of a particular plant, but typically remains within
7%. Stretch power uprates usually involve changes to instrumentation set points, but do not involve major plant
modifications. This is especially true for boiling water reactor (BWR) plants. In some limited cases, where plant
equipment was operated near capacity prior to the power uprate, more substantial changes, such as refurbishment or replacement of equipment contributing considerably to plant power without violating any
regulatory acceptance criteria, may be required. A detailed cost–benefit analysis needs to be performed,
considering implications on various aspects such as safety analyses, both deterministic and probabilistic.
1.3.3.
Extended power uprates
Extended power uprates are greater than stretch power uprates and are usually limited by critical reactor
components, such as the reactor vessel, pressurizer, primary heat transport systems, piping, etc., or secondary
components, such as the turbine or main generator. To cope with these limitations, extended uprates usually
require significant modifications to major balance of plant equipment, such as the high pressure turbines,
condensate pumps and motors, main generators, and/or transformers. Extended power uprates have been
approved for increases as high as 20%.
2
1.4. SCOPE FOR POWER UPRATE
Early generations of NPPs are likely to have included substantial design margins due to conservatism on
the part of: (a) the designer; (b) the utility; and (c) the regulatory authority. This is particularly relevant for
plants that were ‘first of a kind’ since there would have been no operating experience to substantiate the various
safety and performance claims. Such plants may, therefore, include a significant scope for power uprating
without the need for replacement of major plant items.
Later generations of NPPs are more likely to have been optimized (i.e. major plant items designed to
operate closer to their limits), thereby reducing the potential for power uprating without the need for the
replacement of major plant items (i.e. providing less opportunity for ‘stretch’ power uprating).
1.5. CURRENT STATUS OF POWER UPRATES, INTERNATIONAL TRENDS
Many of the operating NPPs in the world have already completed, or are in the process of, power uprating.
Examples of a successful power increase can be found among different types of reactors, such as pressurized
water reactors (PWRs), boiling water reactors (BWRs), the Russian types of PWRs (WWERs) and others. The
Loviisa NPP in Finland, for example, increased thermal power by 9.1% between 1998 and 2000. Two of the
Hungarian Paks WWER-440 units are now operating at 470 MW(e), while the other two at 500 MW(e),
compared to the original 440 MW(e), due to significant modifications to relevant process components and the
introduction of a new type of fuel.
Much experience has been gained in Belgium on power uprates of NPPs. Out of the seven Belgian nuclear
units in operation, power uprates have been performed for three of them (Doel 3, Tihange 1 and Tihange 2),
while a power uprate is under way for a fourth plant (Doel 2). For Tihange 2, the power uprate occurred in two
steps of about 5%. For Doel 3, Tihange 1 and that planned for Doel 2, the single step power uprate is also
coupled with a steam generator replacement. To allow a final uprate value of 10%, core design evolutions, major
equipment modifications and changes of instrumentation set points were needed. Also, new methodologies were
introduced to take advantage of unnecessarily large safety margins in some safety analyses.
A gradual increase in reactor thermal power began in the German pressurized water plants of the 1300
MW series roughly a decade ago. In this way, operational experience with a power uprate of approximately 5%
of the original nominal power has been gathered. Examples of German PWRs with the mentioned uprates are
Philippsburg 2, Emsland, Isar 2 and Unterweser.
In Switzerland, three utilities have requested and received regulatory authorization for power uprates. The
Gösgen plant was permitted to undergo a 6.9% power uprate in 1985. In 1992, the Mühleberg power plant also
received permission for a power uprate of about 10%. On the other hand, the Leibstadt power plant twice
requested and received permission to uprate. This included an uprate of 4.2% in 1985 and subsequently, in 1998,
the plant was permitted to uprate by an additional 14.7%.
During the 1980s, seven out of eight BWRs in Sweden were uprated between 5.9% and 10.1%. One of the
PWRs was uprated as well. Most of the Swedish reactors are planning further uprates in the coming years; a few
of them have already been given a first approval by the Swedish Government and the regulatory body.
In the Republic of Korea, the first power uprating projects are ongoing for 4 units out of 20 operating ones.
The two affected plants are Kori Units 3 and 4 and Yongwang Units 1 and 2, which are PWR type reactors. The
NSSS supplier was Westinghouse and the original electrical output was 950 MW(e). Uprating will result in the
thermal power increase from 2775 MW(th) to 2900 MW(th) (4.5%). The category of this uprating is a stretch
power uprate.
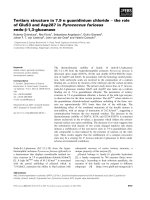
In the USA, the NRC has reviewed and approved 105 power uprates for a total of 13 250 MW(th) (or
estimated 4417 MW(e), equivalent to four new reactors) from 1977 to 2005 (Fig. 1). These power uprates have
been implemented for both BWRs and PWRs, and fall into all three categories. There have been 34
measurement uncertainty recapture power uprates ranging from 0.4% to 1.7%, typically achieved by using more
accurate techniques for measuring feedwater flow. The number of stretch power uprates which have occurred is
58, ranging from 0.9% to 8.0%, typically achieved by changing instrumentation set points with few major plant
modifications, and 13 extended power uprates have been reached, ranging from 6.3% to 20.0%, achieved
3
Nuclear Industry Power Uprates:
(1977-2005)
Cumulative Megawatts Gained
(cumulative power capacity increases)
5,000
4,500
4,000
3,500
3,000
2,500
2,000
1,500
1,000
500
0
4417
77
79
81
83
85
87
89
91
93
95
97
99
01
03
05
Source: NRC (SECY-04-104 Power Status Report on Power Uprates, June 2004. Last updated – July 2005 by NEI)
FIG. 1. Cumulative power capacity increases in the USA from 1977 to mid-2005 (NEI).
through advanced core design and by significant modifications to major plant equipment. These power uprates
have had a dominant impact on the amount of electrical output produced by NPPs in the USA.
As of mid-2005, 12 power uprate submittals were under review by the NRC. These represent 2972 MW(th)
(estimated 990 MW(e)) additional capacity. Based on a survey done in early 2005, 26 more power uprates are
expected through 2010. These represent 4643 MW(th) (estimated 1548 MW(e)) additional power.
1.6. SCOPE AND OBJECTIVES OF THE REPORT
The report addresses the role of I&C systems in NPP power uprating projects. It applies to all reactor types
and power levels used for commercial power production. It includes all projects starting from those aimed at
increasing the efficiency and, hence, the electrical power generated at the same reactor thermal power through
those associated with a minor increase in the thermal power of the reactor to those that constitute a major
extension of the NPPs capacity. However, it excludes consideration of projects aimed at reducing the duration of
the regular planned reactor outages or increasing the cycle time between these reactor outages.
The objective of the report is to provide guidance to utilities, safety analysts, equipment suppliers and
regulators involved in the preparation, implementation and licensing of power uprating projects, with particular
emphasis on the I&C aspects of these projects. While concentrating on a general treatment of I&C aspects, it
also includes specific appendices and country reports to provide a comprehensive coverage of the potentially
needed modifications.
1.7. ORGANIZATION OF THE REPORT
The report contains nine main sections and three appendices referred to as the body, as well as an annex.
This major part of the report introduces the topic in Section 1 by describing the background to power uprating,
4
the different types of power uprates, the current status of power uprating across Member States, and the scope
and objectives of the report.
A good understanding of limits and margins, including their impact on I&C and the calculation of reactor
thermal power, are crucial to power uprating, and these aspects are described in Sections 2 and 3.
Section 4 considers the impact of power uprating on plant I&C. It discusses the interaction with the safety
analysis and operating procedures, the suitability of instruments, I&C systems of special interest, calculations
and algorithms, set point changes, and many other I&C aspects related to power uprating. It constitutes the main
section within the report.
Section 5 addresses human and training aspects with emphasis on the important role of the operating and
maintenance staff following a power uprate and, hence, on the actions required during the uprating project to
ensure that they are suitably equipped for that role.
Section 6 addresses regulatory aspects and, in particular, discusses those issues which a regulatory
authority would expect to be considered in a power uprating licensing submission.
Section 7 provides implementation guidelines for the I&C aspects of power uprating projects and discusses
the importance of having both a sound basis for the design activities, and a plan that is integrated with other
modification activities. It also provides an example of the steps to undertake for a MUR uprating project.
Section 8 summarizes the additional benefits of plant uprating on the plant I&C and discusses some of the
lessons learned in relation to I&C by those Member States which have undertaken power uprating.
Section 9 provides a few key recommendations based on the body of the report.
Appendix I illustrates the heat balance sensitivity to input parameters and sources of measurement errors;
Appendix II describes the operating principle of ultrasonic flow measurement; and Appendix III summarizes
training needs for design changes.
The References and Bibliography provide additional detailed information on topics relevant to the role of
I&C in power uprating projects in NPPs.
Some Member States have provided independent reports to describe their own practices and experience
related to the role of I&C in power uprating activities in NPPs. The Annex comprises these country reports.
2. LIMITS, MARGINS AND THEIR RELEVANCE TO
INSTRUMENTATION AND CONTROL
2.1. DEFINITION AND APPLICATION OF LIMITS AND MARGINS
2.1.1.
Introduction
There is a general tendency for utilities to take advantage of unnecessarily large conservatisms in safety
analyses and margins, and to utilize them for reactor power uprates. Before they are used, however, there should
be a discussion about why they were originally built in and what margins might be acceptable to use in a power
uprate. The following section is to be seen only as a general basis for these discussions, since each case has its
own prerequisites and, therefore, has to be handled separately.
Different limits can be identified that are related to nuclear safety, and in turn related to the built in
margins. For every limit there is also a tolerance area, where an output signal from the limit supervision
equipment should be activated so that the corresponding margin will not be exceeded.
A limit can be seen as a dot, position or line, where exceeding this value might cause a material or function
to be used more than its intended purpose in the upcoming sequence of events. The limits are set so that the
characteristics of a material or function are not exceeded eventually, from the reactor safety perspective.
5
TABLE 1. EXAMPLES OF DIFFERENT LIMITS IN A NUCLEAR POWER PLANT
Limits
Comment
Damage limit
If exceeded, the integrity of existing barriers cannot be demonstrated with analytical
methods. The damage limit normally comes from a best estimate calculation, and is not an
absolute limit due to material and manufacturing variations and operating history.
Safety limit
Set so that the probability of reaching the damage limit during a shutdown event sequence is
acceptably low.
Limit for initiating reactor
protection via the reactor
protection system (RPS)
Supervised by the RPS equipment, and that initiates a shutdown of the reactor. This is one of
the areas where instrumentation uncertainty (RPS uncertainty, in this example) plays an
important role (Fig. 2).
Operating limit
Defines the normal area for operation such that no safety limits are exceeded during various
types of transients or design basis events, provided the reactor protection system action
occurs as intended.
2.1.2.
Limits
To illustrate the reactor safety aspect for an NPP, different design events are used to demonstrate how the
integrity barriers are satisfied. In connection with these analyses, various limits can be identified. As an example
of the various approaches, Table 1 lists some of the conceivable limits applicable for NPP equipment.
The main principle is that the NPP should not exceed the safety limits under any circumstances. By doing
so, good and verified margins to the damage limit are kept. The analysis to demonstrate the integrity of the
barriers will also give the required response time, from detection of a limit being exceeded to initiation and
activation of barrier protective equipment. For some parameters, there might be both an upper and lower limit.
The relationship between these limits and the design event categories defined in the deterministic safety
analysis are illustrated in Fig. 2.
Damage limit or ultimate
capability
H4
Safety limit
H3
Margin for
RPS initiation
H2
H1
Limit for initiating
reactor protection
RPS
uncertainty
Operational
margin
Normal
operation
FIG. 2. Limit values and margins.
6
Operating limit
(in design documents and the
technical specifications)
2.1.3.
Margins
Note that in Fig. 2, the limits are not set to represent the calculated maximum value of the studied
parameter; instead, they are set so that the maximum value of the process parameter — even keeping some
room for various uncertainties — does not exceed the corresponding limit during the event sequence.
Margins are defined as the difference between the acceptance criteria (different limits in Fig. 2) and the
conservative calculation of the upper bound of the design basis occurrences or the upper bound of the calculated
uncertainty range (the maximum value of the H1–H4 curves in Fig. 2). The existence of such margins ensures
that NPPs operate safely in all modes of operation and at all times.
One basic prerequisite for defining margins is that the characteristics of the studied functions are known
with confidence, and that different aspects of the event sequence are well known.
The width of the margins is dependent, among others, on the:
— Knowledge about damage limits;
— Manufacturing uncertainties;
— Calibration uncertainties;
— Capacity decay due to operation and use of equipment.
With increased knowledge about physical phenomena and/or with improved analysis tools, it might be
possible to demonstrate that some margins are larger than necessary. These ‘extra’ margins could arise, for
example, from a reduction in the uncertainties previously used in the analysis.
The barrier protective functions are repeatedly (frequently) tested, and testing experience might show an
‘extra’ margin, or that more frequent testing provides a more secure way of verifying the margins.
Better knowledge about different circumstances or event sequences might permit a more detailed analysis,
where new acceptance criteria or limits can be defined and will result in larger margins.
The above ‘extra’ margins can then be used for other purposes such as a power uprate (see also IAEA
publications [1, 2]).
2.2. RELATIONSHIP BETWEEN LIMITS, MARGINS AND INSTRUMENTATION AND CONTROL
As can be seen in the previous paragraphs, instrumentation uncertainties play a key role in the identification of margins in Fig. 2. Consider, for example, measurement and controller ranges and tolerances while
measuring feedwater flow rate, feedwater temperature, steam quality, fuel temperature, neutron flux, etc.
A typical example is the calculation of reactor thermal power in a more accurate manner. The reactor core
thermal power is validated by a nuclear steam supply system (NSSS) energy balance calculation. The reliability
of this calculation depends primarily on the accuracy of feedwater flow, temperature and pressure measurements. Because the measuring instruments have measurement uncertainties, margins are included to ensure that
the reactor core thermal power does not exceed safe operating levels or, for that matter, does not exceed the
licence value. Instrumentation enhancement may involve the use of state of the art feedwater flow or other
measurement devices that reduce the degree of uncertainty associated with the process parameter measurements. Performing regular calibration and maintenance of instrumentation will also improve measurement reliability. These activities will, in turn, provide for a more accurate calculation of reactor thermal power. With this
more accurate value, the corresponding margins may be narrowed and the extra space gained this way can be
used for the safe increase of reactor thermal power.
7
3. CALCULATION OF THERMAL POWER
The operating licence for every NPP specifies the maximum amount of fission power that the reactor core
is allowed to produce. Since the total fission power is very hard to measure accurately, it is usually estimated
based on the readings of neutron flux detectors, which are time compensated by the power calculated by the
reactor regulating system. However, to ensure that the reactor power is known as accurately as possible, and to
satisfy licensing requirements, the reactor regulating system power is periodically adjusted to the power
calculated by the heat balance around boilers/steam generators, sometimes also known as secondary calorimetric. The total fission power is then inferred from the boiler/steam generator power by adding or subtracting
smaller terms, such as pump heat, piping and purification system losses.
An accurate and reliable calculation of reactor thermal power is essential both to make sure that the
reactor stays within the limits of the safety analyses, and that the thermal power stated in the licence is not
exceeded. Improvements in the calculation of thermal power through the increased accuracy of installed instrumentation or more sophisticated calculation algorithms may also provide opportunities to tighten uncertainty
margins identified in the original licence and, in turn, to increase output power.
3.1. CALCULATION OF THERMAL POWER BY HEAT BALANCE
The heat balance program adds up all heat sinks and heat sources within a specified envelope to evaluate
the amount of power produced by the reactor (see Fig. 3 for an illustration of the envelope). The heat balance
program is run either in automatic or manual mode.
In the automatic mode, reactor thermal power is calculated in the plant process computer but with the
fallback that this can be done manually should the automatic means be unavailable. The manual means typically
involves the operating staff taking the relevant plant parameters from the control room displays and entering
them into an off-line program such as a spreadsheet.
Steam heat
Boiler/steam generator
RHD
heat
Constant
heat term
Heat to moderator
Reactor
Heat to
coolant
bleed
Heat from
coolant
feed
Heat from
coolant and
other pumps
FIG. 3. Primary heat sources and heat sinks in a typical NPP arrangement.
8
Feedwater
heat
The expression used for evaluating reactor thermal power normally is as follows:
QRP = QB + QM + QPUR + QCONST
where:
QRP:
QB:
QM:
QPUR:
QCONST:
Reactor thermal power;
Power to boilers/steam generators;
Power to the moderator;
Power to the heat transport purification (also called feed and bleed) system;
Constant term.
The following discussion will consider each term in order of increased contribution to the total reactor
power, with specific emphasis on the effect of improving the accuracy of measuring a particular term on
maximizing the power uprate.
3.1.1.
Constant term
This term usually incorporates contributions from various heat sinks and heat sources outside of the
reactor core, and is about 1% of the total reactor thermal power. The biggest contribution to this term is from
heat produced by the coolant circulation pumps. Other contributions include heat produced by smaller pumps
and piping heat losses. Sometimes the power correction due to steam moisture content is also included in the
constant term. As the name implies, the value of the constant term is fixed and is usually obtained from the plant
design information. With the exception of steam moisture (STM) content, which can be measured directly using
chemical tracer methods and is done several times over the lifetime of the reactor, accuracy of other contributions to the constant term can be improved only by improving the models used in design calculations.
3.1.2.
Power to the purification (feed and bleed) system
This term accounts for heat losses due to a small flow of reactor coolant to the outside of the heat balance
envelope in order to maintain the coolant chemical specifications. A typical value of this term amounts to a
fraction of 1% of the total reactor thermal power. The accuracy of this term can be improved by improving the
accuracy of the purification flow and temperature measurements but the net effect on the calculated reactor
thermal power will be almost negligible.
3.1.3.
Moderator power
This term accounts for the heat removed by the reactor moderator system. It is the second biggest contribution to the calculated reactor thermal power after power to the boilers/steam generators, and is usually a few
per cent of the total reactor thermal power. Moderator power is normally obtained from design calculations and
is assumed to be constant at a particular power level. However, those plants that use plant instrumentation to
evaluate moderator power can increase the overall heat balance accuracy by improving moderator flow and
temperature measurements.
3.1.4.
Power to boilers/steam generators
This is by far the biggest contribution to the total reactor thermal power and comprises steam power,
feedwater power, and some smaller contributions such as, for example, second stage reheat power. Each contribution is a product of the relevant flow multiplied by the enthalpy, which is obtained from the steam tables based
on measured temperatures and pressures. This is summarized by the following equation (Σ implies summation
over individual boilers/steam generators):
QB = Σ (WST × HST – WFW × HFW – WRHD × HRHD)
9
where:
QB:
WST:
HST:
WFW:
HFW:
WRHD:
HRHD:
Power to boilers/steam generators;
Steam flow from a boiler/steam generator;
Main steam enthalpy;
Feedwater flow into a boiler/steam generator;
Feedwater enthalpy;
Second stage reheater drains flow;
Second stage reheater drains enthalpy.
It should be noted that, instead of a direct measurement, steam flow is obtained in several NPPs by adding
up the three flows into the boilers/steam generators, that is, feedwater flow, second stage reheat flow and boiler/
steam generator blowdown flow.
Therefore, the equation for the boiler/steam generator power can be rewritten as:
QB = Σ [WFW × (HST – HFW) – WRHD × ( HST – HRHD) + WBD × HBD]
where:
WBD:
HBD:
Blowdown flow;
Blowdown enthalpy.
Table 2 summarizes typical values of flows, temperatures and pressures for selected reactor types. It should
be noted that for any reactor type, steam and feedwater flow is very nearly proportional to the reactor thermal
power.
3.2. CONTRIBUTIONS TO BOILER/STEAM GENERATOR POWER
This section deals specifically with contributions to the largest component of the heat balance: power to the
boilers/steam generators, with particular emphasis on the relative importance of the accuracy of individual
measurements.
The accuracy of different instruments used to measure the parameters included in the equation mentioned
has a different effect on the maximum achievable reactor power and generator output. This notion is more
conveniently expressed through sensitivities, defined as the change in reactor power per per cent change in the
parameter being measured. Since by far the biggest contribution to the boiler/steam generator power comes
from feedwater flow and enthalpy, and since enthalpy is strongly dependent on the fluid temperature but not on
TABLE 2. VALUES OF THE MAIN HEAT BALANCE PARAMETERS FOR SELECTED REACTOR
TYPES
Reactor type
PWR
BWR
WWER-440
Reactor thermal power at 100% FP – QRP (MW(th))
3300
2900
Reactor net electrical output at 100%FP (MW(e))
1200
1000
450
900
Main steam pressure – PSTEAM (kPa)
6000
5500
4500
5000
Main steam temperature – TSTEAM (C)
285
280
250
265
Feedwater temperature – TFW (C)
235
180
140
170
Steam flow – WSTEAM (kg/s)
1500
1450
375
1300
Feedwater flow – WFW (kg/s)
1450
1400
375
1250
Moisture content – M (%)
10
0.1
0.1
1375
CANDU
0.3
2800
0.25
pressure, calculated reactor power will be very sensitive to the errors in feedwater flow and temperature
measurements. Typical sensitivity values are summarized in Table 3.
Absolute sensitivity is expressed as the ratio of the contribution to the total reactor thermal power in per cent
full power (%FP) per measurement unit of a particular parameter. Relative sensitivity is expressed as a ratio of
%FP, divided by per cent error in a specific parameter. It is clear that the largest effect is due to errors in boiler/
steam generator steam moisture content and in feedwater flow measurements, followed by the error in feedwater
temperature measurements. However, since boiler/steam generator steam moisture content can be measured to
within about +0.1% accuracy, and it remains constant over long time periods, the effect on the reactor thermal
power uncertainty is relatively small. In some cases, moisture carry-over tests were performed prior to an MUR
uprate to ensure the most accurate possible value for the steam moisture content. In other cases, boiler/steam
generator blowdown flow was measured ultrasonically to verify the value assumed in the heat balance program.
Additional examples of heat balance sensitivity to measurement uncertainty are given in Appendix I.
In general, measurement accuracy of a particular parameter is determined by contributions from:
— Errors in the primary measurement element, such as a venturi or nozzle in the case of feedwater flow, or an
RTD in the case of feedwater temperature;
— Location of the primary element with respect to the heat balance envelope;
— Errors due to transmitter manufacturing specifications and transmitter calibration;
— Errors due to signal wiring;
— Errors due to analogue to digital conversion of the signal.
Examples of sources of instrumentation errors are also given in Appendix I.
Neutron flux instrumentation is calibrated to the core thermal power. As described in the previous
sections, the core thermal power is determined by an automatic or manual calculation of the energy balance
around the plant NSSS. An accurate measurement of feedwater flow, and main steam and feedwater
temperature and pressure, will result in an accurate determination of core thermal power, and thereby an
accurate calibration of the nuclear instrumentation.
In the next sections the focus will be, therefore, on the accuracy of feedwater flow and temperature
measurements, with accurate flow measurements presenting a greater challenge.
3.3. FEEDWATER FLOW MEASUREMENTS
The instrumentation used for measuring feedwater flow is typically an orifice plate, a venturi meter or a
flow nozzle. These devices generate a differential pressure proportional to the feedwater velocity in the pipe. Of
the three differential pressure devices, a venturi meter is most widely used for feedwater measurement in NPPs.
The major advantage of a venturi meter is a relatively low head loss as the fluid passes through the device.
However, nozzles and venturis are subject to a variety of problems, such as:
— Instrumentation drift;
— Feedwater pipe erosion;
— Cracked sensing tube;
— Bypass flow;
— Initial calibration problems;
— Fouling.
TABLE 3. SENSITIVITY VALUES FOR MAIN HEAT BALANCE PARAMETERS
Parameter
WFW
TFW
PSTEAM
M
Sensitivity (absolute)
0.09%FP/kg/s
0.25%FP/°C
0.0005%FP/kPa
0.1%FP/0.1%
Sensitivity (relative)
0.9%FP/%
0.5%FP/%
0.1%FP/%
1%FP/%
11
Some of the same problems are also encountered in the case of orifices, which are in addition subject to
edge deterioration. Therefore, in general, to ensure that the claimed total feedwater flow measurement accuracy
of better than +0.5% is satisfied, it is essential to implement a regular surveillance and calibration program.
The major disadvantage of the venturi device is that the calibration of the flow element shifts when the
flow element is fouled, which causes the meter to indicate a higher differential pressure and, hence, a higher than
actual flow rate. This leads the plant operator to calibrate nuclear instrumentation high. Calibrating the nuclear
instrumentation high is conservative with respect to the reactor safety, but causes the electrical output to be
proportionally low when the plant is operated at its thermal power rating. On the other hand, undiagnosed
defouling will lead to an underestimate of the measured feedwater and may result in the reactor thermal power
licence limit being exceeded. This is particularly important if the plant has been power uprated.
To eliminate the fouling effects, the flow device has to be removed, cleaned and recalibrated. Due to the
high cost of recalibration and the need to improve flow instrumentation uncertainty, the industry assessed other
flow measurement techniques and found the ultrasonic flow measurement (UFM) to be a viable alternative. The
UFM does not replace the currently installed plant venturi, but provides the licensee an in-plant capability for
periodically recalibrating the feedwater venturi to adjust for the effect of fouling. Since the UFM technique is
based on a totally different concept of flow measurement from that of a more standard pressure drop based flow
measurement, it is not only free from the problems mentioned previously, but also provides a second, totally
independent set of flow readings, which results in increased surveillance capabilities. A more detailed introduction of the applied UFMs is provided in Appendix II of this report.
3.4. FEEDWATER TEMPERATURE MEASUREMENTS
Plant temperature measurements are normally done by resistance temperature devices (RTDs). When
installed properly, including the correct compensation for the lead wire resistance, RTDs can be as accurate as
+0.25% of the total measurement range, or better than +1°C. However, experience has shown that often this is
not the case and the resulting bias can significantly reduce RTD accuracy. Possible feedwater stratification
downstream of high pressure feedwater heaters and the RTD location can add to the bias.
Some of the plants that have implemented MUR uprates have also improved the accuracy of feedwater
temperature measurements by replacing existing RTDs and/or installing ultrasonic temperature measurement
devices. These steps resulted in an improvement in feedwater temperature measurement accuracy from about
+1°C to better than +0.5°C.
More information on instrument uncertainties can be found in the IAEA report on on-line monitoring [3].
3.5. SOURCES OF ERROR IN THE REACTOR THERMAL POWER CALCULATION
The total error in the reactor thermal power calculation is comprised of the contributions from different
sources. In addition to errors arising from random and systematic measurement uncertainties, there are errors or
uncertainties that are due to departures from the reactor steady state, changing constant terms such as main
steam moisture content, or errors in design calculations such as in the total pump heat.
These faults or uncertainties could lead to an underestimation as well as an overestimation of the actual
thermal power.
As mentioned previously, there are two methods for undertaking the reactor thermal power (heat balance)
calculation — an automatic method using the plant computer and a manual method. The uncertainties
associated with the two methods are unlikely to be the same and should be assessed individually. Aspects such
as: (a) the way in which redundant measurements are averaged; (b) the use of instantaneous readings or
readings averaged over time; and (c) any additional inaccuracies associated with the use of the displayed
readings, should all be taken into account.
A change from automatic to manual means is also required when instrumentation drift is observed, such as
in the form of a discrepancy between the original plant instrumentation and any add on instrumentation
installed to improve the accuracy of the reactor thermal power calculation. An example of add on instrumentation is an ultrasonic flowmeter installed for on-line calibration of the feedwater flow instrumentation. When
12
changes in the calibration factors are observed that are outside of the normal acceptance range, reactor power is
usually reduced by an appropriate amount and manual means are used until the reason for the drift is identified.
3.6. THERMAL POWER, SAFETY ANALYSES AND LIMITS IN THE OPERATING LICENCE
The reactor thermal power limit is one of the most important quantities specified in the plant operating
licence. The reactor thermal power limit is normally expressed in MW(th), corresponding to 100% full power
(FP), and is based on the safety analysis performed at between 102% and 103% FP to account for the
uncertainty in reactor power measurements. In certain cases, a safety analysis is performed at even higher power
levels (e.g. 106% FP) to account for the reactor regulating system allowing the reactor to operate at up to 103%
FP for short periods of time. Practical implementation of the compliance with the reactor thermal power licence
limit depends on the specific safety margin and on specific regulatory requirements, and varies somewhat from
country to country or even from plant to plant.
The most common options are:
— Instantaneous reactor power must be below 100% FP at all times;
— Power is allowed to drift above 100% FP by a few tenths of 1% and stay at that level until the value is
verified by a repeated run of the calorimetric program;
— Power is allowed to drift above 100% FP by even 2% for a very short time, provided the average power
over a specific period of time (usually between 2 h and 24 h) stays below 100% FP.
For stretch and extended power uprates, the safety margin normally remains the same, and, therefore, the
reactor power compliance strategy can also remain unchanged. However, the essence of MUR uprates is a
reduction in the margin between the licence limit and the value assumed in the safety analysis, based on the
increased accuracy of reactor thermal power measurements. It is clear, therefore, that for MUR uprates the
reactor power compliance strategy may have to be revised to ensure that the assumptions of the safety analysis
are not violated.
For a typical MUR uprate of between 1% and 1.5%, the remaining margin is as little as 0.5%. It needs to
be emphasized once again that, in this case, exceeding the margin may not only result in a violation of the
operating licence but, more importantly, may invalidate the assumptions of the safety analysis. Therefore, the
following steps are taken to ensure that a reactor that has undergone the MUR uprate is operating below the
reactor thermal power limit:
— Reactor thermal power uncertainty analysis is redone to include instrumentation upgrades that were
implemented as part of the MUR uprate application;
— Additional capability for on-line monitoring of the upgraded instrumentation, such as the installed
ultrasonic flowmeter for feedwater flow calibration, is provided;
— Continuous comparison between the two methods for feedwater flow measurements (a nozzle and an
ultrasonic flowmeter) is performed;
— The calorimetric program is run in the plant process computer and the output is available in the control
room;
— Operating procedures clearly state that the reactor must be derated by a specified amount if there is any
suspicion that the measurement uncertainty assumed in the application for the MUR uprate is in question.
Since by far the biggest effect on the reactor power measurement uncertainty comes from feedwater flow
measurements, close attention has to be paid to justifying the validity of the measurement uncertainty, particularly transferring validation of the ultrasonic flowmeter calibration performed under laboratory conditions to
field installations. It is also good practice to critically compare changes in feedwater readings of the installed
ultrasonic flowmeter to the existing plant instrumentation, and to reconcile the revised value of the feedwater
flow and of the reactor thermal power with other plant indications.
13
4. IMPACT OF POWER UPRATING ON PLANT
INSTRUMENTATION AND CONTROL
The opportunities for power uprating will vary depending on: (a) the reactor type, nominal power rating
and generation; (b) the margins inherent in the original design of the reactor and its major plant items; and (c)
other factors specific to each NPP unit.
As for any licensing application, the uprated plant configuration will need to be supported by detailed
analyses that demonstrate acceptable plant behaviour under normal operation, anticipated operational
occurrences and design basis events. In order to achieve such demonstrably acceptable plant behaviour for the
increased power level, it may be necessary to change specific algorithms or set points within the plant control,
limitation or protection systems. Equivalent changes may be required to the set points for the alarms associated
with the monitoring of the plant parameters.
An increase in output power will inevitably give rise to different conditions in the plant (temperature,
pressure, flow rate, neutron flux), which could in turn potentially give rise to increased ageing or other
phenomena. There may be, therefore, a need for monitoring of different parts of the plant, or surveillance
activities at an increased frequency, to ensure that any appreciable deterioration is noted and appropriate action
taken.
Any significant changes to the plant control, limitation or protection systems, or to the plant monitoring,
will necessitate corresponding changes to the human system interface (HSI) in the main control room (and
possibly also in other control rooms). It could also lead to changes being required in any plant simulator.
The I&C system functions in an NPP comprise protection functions, limitation functions, control functions,
monitoring/display functions (including alarms), and testing/diagnostic functions. These include functions
important to safety and functions not important to safety. All of these function types are potentially affected by
a power uprating project.
Modifications in the instrumentation and control systems in relation to power uprating are, however, not
necessarily very substantial. The following preconditions, in terms of sufficiency, must be fulfilled in the frame of I&C:
— Measurement ranges;
— Calculation algorithms to indicate credible reactor thermal power;
— Accuracy of process parameter measurements;
— Possibilities for setting new limits in the reactor protection system, limitation systems and other control
systems.
I&C can feature in power uprating projects in the following three ways, where:
— Changes to specific I&C systems constitute a direct means by which an increase in output power can be
engineered (or maximized), subject to a successful licensing application (I&C as enabler);
— Other changes to specific I&C systems are also required to enable the increase in power to be implemented;
— Further changes to I&C systems are necessary, for safety or operational reasons, as a consequence of the
planned increase in thermal power (I&C as follower).
Referring to the first I&C role identified previously, several I&C capabilities and activities may be needed
in order that a power uprate project can be implemented. By way of example, these may include the following:
— Modification of specific control systems to enable operation under different primary or secondary circuit
conditions (e.g. higher primary circuit temperatures and flow rates) with the analytical justification to
make the changes;
— Faster and more accurate three dimensional core analysis software program for the new fuel and to
provide adequate representation of the core power in a timely manner for operational decisions;
— Changes in the pressurizer pressure control system to provide finer control under reduced operating margins;
14