Comparison of rainfall distribution between ground measurements and data capture from satellite in Ca river basin
Bạn đang xem bản rút gọn của tài liệu. Xem và tải ngay bản đầy đủ của tài liệu tại đây (772.7 KB, 10 trang )
HNUE JOURNAL OF SCIENCE
DOI: 10.18173/2354-1059.2019-0087
Natural Sciences 2019, Volume 64, Issue 10, pp. 183-192
This paper is available online at
COMPARISON OF RAINFALL DISTRIBUTION BETWEEN GROUND
MEASUREMENTS AND DATA CAPTURE FROM SATELLITE IN CA RIVER BASIN
Le Thi Thu Hien and Hoang Luu Thu Thuy
Institute of Geography, Vietnam Academy of Science and Technology
Abstract. This paper presents a comparison of four different rainfall data sources:
rainfalls from TRMM and GPM satellites, PERSIANN system, and in-situ
measurements at meteorological stations. The data from TRMM and GPM
satellites have been used by many countries. The comparisons of rainfall data from
satellites or the online metadata system with in-situ measurement present a similar
pattern of spatial distribution between these resources but the amounts of rainfall
are quite different.
Keywords: TRMM, GPM, PERSIANN, Ca river basin.
1. Introduction
Rain is a key element in the hydrological cycle. Accuracy of the rainfall monitoring
plays a very important role in water recourses management as well as minimizing the
impact of natural hazards on human society such as drought, flood, flash flood, and
landslide. In reality, rainfall monitoring has difficulties: in-situ rainfall measurement
using rain gauge is a conventional method; the obtained data is highly reliable and
accurate but this method has limitations in temporal and spatial extension. Satellite
metering data can overcome these critical problems due to its coverage and temporal
resolution, but on the opposite side, its accuracy is not as good as in comparison with
in-situ rainfall measurement.
With the rapid in development of space science and computer engineering, since
1960s remote sensing technology has been more popularized in monitoring weather
conditions, especially in calculating the precipitation. Information captured from
satellite is used for measuring rainfall based on algorithms; in-situ measurement data
and/or the weather radar are used in order to calibrate obtained rainfall from remote
sensing. Among the satellite rainfall data, TRMM is deemed to be reliable and, thus,
shows potential for using in hydrological applications. This conclusion is consistent
with those of other studies [1-3]. When comparing some of the satellite rainfall data
Received August 21, 2019. Revised October 22, 2019. Accepted October 29, 2019.
Contact Le Thi Thu Hien, e-mail address:
183
Le Thi Thu Hien and Hoang Luu Thu Thuy
with in-situ rainfall measurement in the Central of Vietnam, rainfall amounts are
underestimated depending on zonal wind speed and elevation, but the CMORPH and
GSMaP biases are larger than those of TRMM. Therefore, variability in elevation plays
an important role in these biases and suggests that CMORPH and GSMaP can be further
improved via algorithm correction for elevation and zonal wind speed [2].
In other studies, the comprehensive overview of 30 existing precipitation products
and quantifies the discrepancies in the different precipitation estimates over timescales
ranging from daily to annual. The 22 monthly or daily precipitation products evaluated
had spatial resolutions varying from 0.04° to 2.5° and included gauge-based (CRU,
GPCC, GPCC-daily, PRECL, UDEL, and CPC-Global), satellite-related (PERSIANNCCS, PERSIANN-CDR, CMORPH, TRMM 3B43, TRMM 3B42 GPCP, GPCP 1dd,
CMAP, and MSWEP), and reanalysis (NCEP1, NCEP2, ERA Interim, 20CRv2, JRA55, MERRA, and CFSR) products. They found that current observations had large
uncertainties in the magnitude and variability of precipitation at multiple timescales.
There were deviations of up to 300 mm in the estimated magnitude of annual
precipitation, even among products within the same category. The reanalysis data sets
generally had the largest discrepancies when compared with the other data sets [4].
The purpose of this paper is to present the results of the comparison between
satellite rainfall data (TRMM, GPM, and PERSIANN systems) with in-situ rainfall
measurement in Ca River basin including its amount and spatial rainfall distribution and
recommend the usage of the satellite rainfall data in the study area.
2. Content
2.1. Methods and data
* Research methods
Establishing a rainfall map
Principles of mapping: we apply a territory zonation based on the system of natural
criteria with relative homogeneity of annual rainfall, and based on combining climate
parameters and geographic indicators. The map of total annual rainfall in the
year/season must reflect the general humidity of the territory.
Base on the analysis of rainfall regime in the study area, we could see the highlights
in the rainfall regime as follows:
- Due to the complexity of the rainfall, its amount could range from >1200mm to
over 2200mm. Rainfall accumulates mainly in the summertime. Also that, winter is a
wet period involving an increase in the moisture content due to northeast monsoon
whose flow blows through the sea and the polar front and it is blocked at the eastern
side of the Truong Son Range.
- The conditions of atmospheric circulation and terrain conditions (elevation, slope
direction, vegetation), are caused amount of rainfall to be distributed
Comparative method
- Comparing satellite rainfall data and in-situ measurement data: collect and
calculate according to rainfall hourly and rainy season. Comparison of characteristics of
184
Comparison of rainfall distribution between ground measurements and data capture…
rainfall distribution by volume and region were carried by using ArcGIS’s tools 10.4 for
3 years: 2010, 2015 and 2017.
*Data source
Daily rainfall data were collected at 44 meteorological, hydrological and rainfall
stations in 2010, 2015 and 2017 in Ca River basin and surrounding area. In Vietnam,
there are 12 meteorological stations, 14 hydrological stations, and 15 rain gauges, in
Laos, there are 3 stations measuring rainfall.
Data of regional international stations include three stations in Laos territory and
two national stations located in Vietnamese territory (in the Ca River Basin) from
NOAA (data from 1961 to 2017) [5].
Other supporting data include:
- DEM data from SRTM, resolution 30mx30m for interpolation of rainfall map for
key areas, from USGS [6].
- Characteristics of atmospheric circulation in the study area and surrounding areas
[7, 8].
- 3-year vegetation cover data: 2010, 2015 and 2017 interpreted from satellite data,
from USGS [6].
- NDVI 2010, 2015 and 2017, from the Copernicus Global Land website data
source service [9].
Satellite data form 2017 by day, month and year from G-WADI data source,
contains PERSIANN data; PERSIANN-CCS [10].
Satellite rainfall data in 2010, 2015 and 2017 are taken from the data source
whether radar rainfall TRMM and GPM by day/hour, resolution 5km x 5km [5].
2.2. Study area
The Ca River originates in the Kon Sa and Sam Nua provinces of the Democratic
Republic Laos, flowing in the main direction from the direction of NorthwesternSoutheastern through the territory of Thanh Hoa, Nghe An, and Ha Tinh provinces. The
total area of the whole Ca River basin, calculated from the upstream to the estuary is
about 27,200 km2, but its part in Vietnam accounts for 17,730 km2. Ca River’s terrain
takes into account Yen Upper is a form of topography with many forms with the
common slope in the direction of Northwestern-Southeastern. The average slope of the
basin is high, the plain part is narrow [8]. The Ca River basin is located in the North
Central region where it is cold during the winter. The sunshine is relatively weak, with
drizzling rain. There is a year of salt fog occurring in some areas of the basin. In the
summer, this region is suffered by the hot dry west wind, characterized by high
temperature, strong rain in the second half of the year. The average annual temperature
is less than 20°C in the mountains and more than 24°C in the plain. Ca River basin has a
rainy summer regime. The rainy season occurs in the period of May-October in the
middle of the Ca River, in the period of May-October, November in the left bank of the
Ca River and La River basin in Ha Tinh province [7, 8].
185
Le Thi Thu Hien and Hoang Luu Thu Thuy
Annual average rainfall: The annual amount range from 1100 mm to over 2800 mm.
But its spatial distribution is uneven. At the heavy rain centers such as upstream of
Hieu, La, Giang River basins, the average annual rainfall reaches over 2000 to 2400
mm. The centers of light rain locate along the mainstream of the Ca River, at Cua Rao,
Muong Xen the average annual rainfall reaches 1100 to 1400 mm. At the downstream
of Ca River, the annual average rainfall ranges from 1700 to 1800 mm [7, 8].
Figure 1. Region Delta of Ca River
Rainy season: The rainy season of the Ca River basin starts from May to the end of
October. At the centers of heavy rain, the rainy season can prolong for more than 1-2
months. The number of rainy days varies from 125 to 160 days. Rainfall in the rainy
season occupies from 80 to 90% of total annual rainfall, of which the rainfalls of the 3
largest consecutive months occupy from 50 to 60% and appear during the following
periods: April - October and September - November [7, 8].
Rainfall in dry season occupies from 10 to 45% of annual rainfall, of which 3
months have the least amount, fell from 1.5 to 10% of annual rainfall and it occurs in
December, January - February or January - March, February - April.
186
Comparison of rainfall distribution between ground measurements and data capture…
The dry season occurs from December to April with many drizzling days. The
number of the rainy day counts from 30 to 40 days per year at the plain. But rainfall in
the dry season can reach from 130 to 300 mm, facilitating the cultivation of the winterspring crop.
2.3. Results and discussion
2.3.1. Comparison of the rain data
Data for drawing rainfall in 2015 were taken at the local rain gauge stations;
measuring from National meteorologic stations on the Ca River basin and its
neighborhood; and the data were obtained also from Laos’ stations.
- Rains from September 15-18, 2015, rain distribution in 2 main areas:
+ In the North of the basin: it composes of Laos and the central region with light
rainfall,
+ In the South of the basin: it is a heavy rainy area with a rain center located in the
southwest areas (Huong Son – Huong Khe, Hoa Duyet, Ky Anh, rainfall of 4 days is up
to 506 mm and 596 mm; 492 mm; and 456 mm), its amount lessened in coastal areas
(Vinh; Nam Dan; Dai Loc; Ha Tinh, etc...) and decreased completely in the North of the
Ca River basin; In the central part, the contour line is 300 m; but in the area covering
Con Cuong, Quy Hon, the contour line reduced to 200 mm; in the area of Tuong Duong,
Cua Rao, this one decreased to 100 m.
- Comparing in-situ rainfall measurement with rainfall data from PERSIANN-CCS
system:
Rainfall data was captured from 15th to 18th September 2015, at PERSIANN-CCS
system in the local time (24 hours from 19h00 of the day). This data shows the rainfall
distribution which is into 2 areas:
+ The Northwest (Laos and mountainous areas of Vietnam): light rainfall.
+ Rainy center is located in the Southeast and Southwest of the Ca River basin
(Vietnam coastal area). There are 2 rain centers in Do Luong - Quy Chau - pulling up
North (outside the basin), and Huong Khe - pull down to the South (outside the basin).
The Intensity of rainfall: up to 258 mm, rainfall intensity in a specific day is as
follows:
+ Rainfall on 15th was 125 mm; rainfall on 16th was 124 mm; rainfall on 17th was
178 mm, and rainfall on 18th was 77 mm;
+ The intensity of highest rainfall reaches 83 mm in 6 hours (from 06h on September
17, 2015) the rainfall’s center lies in the Northern of the Ca River basin (Quy Chau).
- Comparing the intensity and the spatial distribution of the rain (from day 15th to
18th September 2015) of the PERSIANN system and in-situ measurement data
(drawn according to expert method/rain mapping method presented above).
+ Rainfall from the in-situ measurement stations (by Vietnam) is much larger than
the rainfall measured from the PERSIANN system.
+ On the one hand, the distribution of rainfall from in-situ measurement is quite
similar to the distribution of rainfall data from the PERSIANN system, i.e. heavy
rainfall in the South, light rainfall in the North. On the other hand, the center of the rain
187
Le Thi Thu Hien and Hoang Luu Thu Thuy
issue from in-situ measurement was situated on the Southwest; and there were 2 rain
centers from PERSIANN: one in the South – pulling down to the South (outside the
basin) and one in the central area stretching to the North (outside the basin)
- Comparing rain (September 15-18, 2015) of PERSIANN system with in-situ
measurement data from the international rain gauge stations, the rainfall data from the
stations still has differences: some stations can measure more accurate; other stations
can measure less accurate.
- Comparing in-situ measurement data with rainfall data from GPM and TRMM
+ Data of TRMM ended data acquisition from April 15, 2015. So the data of
rainfall from September 2015 was not available.
+ Rainfall data collected from GPM satellites:
+ Spatial distribution: quite similar to the distribution of the rain map generated by
the Experts method. It is also divided into 2 areas: heavy rainfall locates in the South
and the central area; light rainfall locates in the Northwestern region and the Laos side.
But rainfall is quite identical in the central area and the South of the Ca River basin;
+ Amount of rainfall: close to the actually measured rainfall; rainfall in the study
area varied from 17 mm - 276 mm (according to 00h UTC); and from 21.6 - 288.2 mm
(local time).
2.3.2. Comparison of seasonal data
* Comparison with rainy season data from Persian system
Comparing rainfall in 2010: in-situ measurement data with rainfall data from
PERSIANN system
Rainy season:
- According to the in-situ measurement data, the rainy season in 2010 starts from
July to the end of October. The rainy season includes the period of January - June and
the period of November - December; in which it guarantees > 50% number of
meteorological stations has rainfall exceeding 100 mm or < 100 mm
- According to the rainfall data of PERSIANN system, the rainy season starts from
the April 2010, the highest rainfall reaches 108 mm at some areas of the study area: for
example, proximity of Cua Rao, Huong Khe; Starting from the May, most of rainfall is
over 100 mm on the whole region and many areas have rainfall > 300mm which
occupies more than half of the study area; Rainy season prolongs to the end of October
2001, the highest rainfall was 537 mm in Huong Khe. In the remaining months
(January-March and November-December), monthly rainfall is less than 100 mm at all
locations, total rainfall of these months is quite small.
However, to compare the distribution of rainfall will assess the rainy season and
less rainfall according to the measured data ground (as shown).
- Similarities: The rainy season appears both in the satellite image and in the
rainfall maps drawing by the expert method: the heavy rainfall is situated in the South
and the center. The area with light rainfall is located in the Northwest (Laos side);
rainfall reduces from about 500-800 mm
+ Differences: The amount of heavy rainfall area: Rainfall identified by expert
method increases gradually from the center areas by 2000 m (in Quy Hop, Quy Chau,
188
Comparison of rainfall distribution between ground measurements and data capture…
Con Cuong) to the Southeast of the Ca River basin where heavy rainfall contour in the
end of Southeastern region reaches 2800 mm (in Huong Khe); Moreover rainy season
based on satellite images, there is heavy rainfall in the Southeast, but is concentrated
mainly in Do Luong; Son Diem; Huong Son areas, it decreased in the Southeast and fell
sharply towards the sea. Huong Khe is another rain center, however, this center is very
narrow. In combination with the above center, they create a large rainfall area in the
South of the Ca River basin, the total measured rainfall is about 1700 mm.
Dry season
- After expert method: distribution of light rainfall area situates at the East (Nghia
Khanh; Quynh Luu), about 200 m, then it gradually increases to the West and South, but
rainfall reaches to 800 mm in the South area (Huong Khe).
- After satellite image: 2 dry areas located in the Southeast. The amount decreased
to 170 mm (toward the sea), it fell around 200 mm in the West (Lao’s districts. In
Muong Xen, Cua Rao, Quy Chau, the amount ranges between 550-900 mm (because of
rain center located in the North). Rain center situates outside of the area, and its amount
increased up to 1100 mm.
In conclusion, the rainfall data in the dry season is quite similar between the in-situ
measurement rainfall, with the one identified by expert method; and the one obtained by
the PERSIANN system.
* Comparison of rain in 2015: Data collected from the PERSIANN system
Rainy season
- The rainy season begins from May and lasts until the end of October, its amount
ranges between 800-2700 mm, while the dry season prolongs in the remaining months.
- Rainfall distribution: Heavy rainfall area located in the center (up to the North)
and the South (to the West); Otherwise, the light rainfall area located in the Southeast
(near the ocean) the amount ranges between 1500-1700 mm (Quynh Luu, Do Diem, Dai
Loc), and the far more less rain located in the North (belongs to Laos) and the amount
varies between 900-1400 mm.
Dry season
It starts in January - April, and November, December. At this time around, the
center of the rain had relocated down to Southwester outside of the basin, remaining
few Southwesters effected by the central which leaded to rain, of course the amount of
rainfall was counted only up to 150-230 mm in some areas in the Southwestern basins
such as Con Cuong; Dua; Do Luong; Yen Thuong; Huong Son. Other districts in the
North and southeast had less rain, only fell from 30-150 mm, the lowest were located in
Moung Xen; Tuong Duong/ Cua Rao (locates in the North); Nghia Khanh, Quy Hop;
Tay Hieu (locates in the Northeast); and Dai Loc; Vinh; Cua Hoi; Do Diem (locates in
the Southeast).
* Comparison of rainfall in 2017 between in-situ measurement data with rainfall
data from PERSIANN system
Rainy season
- The rainy season starts from May and lasts until the end of October, the amount
ranges from 800 - 2700 mm.
189
Le Thi Thu Hien and Hoang Luu Thu Thuy
- Rainy distribution: heavy rainfall area is located in the central area (up to the
North) and South area (toward the West); Light rainfall area is located in the Southeast
(close to the sea) and its amount changes from about 1500 - 1700 mm (Quynh Luu, Do
Diem; Dai Loc, etc.); and light rainfall areas located in the North (belonging to Laos)
with an amount ranges from about 900-1400 mm.
Dry season
- From January to April and November, December. At that time, the rainfall center has
moved to the Southwest (outside the basin), it remains some areas in the Southwest which
are affected by the rain. However, the total of highest rainfall is only about 150 - 230 mm at
some places in the Southwest basin such as Con Cuong, Dua, Do Luong, Yen Thuong,
Huong Son. The remaining areas in the North and Southeast have less rainfall. The
rainfall ranges from 30 - 150 mm, but the lowest rainfall situates in Muong Xen area,
Tuong Duong/Cua Rao (in the North); Nghia Khanh and Quy Hop, Tay Hieu (in the
Northeast), and Dai Loc, Vinh; Cua Hoi, Do Diem (in the Southeast).
Legend
!
Rainfall hours in stations
Rainfall contourline
Rainfall hours in stations
Rainfall contourline
Ca River Basiin
Rainfall from satellite
Rainfall from satellite
Value in mm
Value in mm
High : 257
High : 2882
Low : 0
Low : 0
Legend
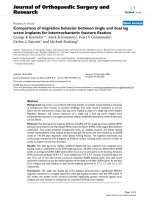
Figure 1b. Comparison of the
rainfall from 15th to 18th September
2015 between in-situ measurement
and GPM satellite data)
Legend
Rain gause stations
# Rain gause stations
Rainfall contourline
Rainfall contourline
Ca River Basiin
Ca River Basiin
Rainfall from satellite
Rainfall from satellite
Value in mm
Value in mm
High : 1726
Low : 337
Figure 2a. Comparison of the rainy
season in 2010 between in-situ
measurement and PERSIANN system)
190
!
Ca River Basiin
Figure 1a. Comparison of the rainfall
from 15th to 18th September 2015 between
in-situ measurement
and ERSIANN system)
#
Legend
High : 1123
Low : 47
Figure 2b. Comparison of the dry
season in 2010 between in-situ
measurement and PERSIANN system)
Comparison of rainfall distribution between ground measurements and data capture…
Legend
#
Rain gause stations
Legend
#
Rainfall contourline
Rain gause stations
Rainfall contourline
Ca River Basiin
Ca River Basiin
Rainfall from satellite
Rainfall from satellite
Value in mm
Value in mm
High : 2440
High : 211
Low : 418
Figure 3a. Comparison of the rainy
season in 2015 between in-situ
measurement and PERSIANN system
Low : 5
Figure 3b. Comparion of the dry season
in 2015 between in-situ measurement
and PERSIANN system
Legend
Legend
#
Rain gause stations
Rainfall contourline
Ca River Basiin
Rainfall from satellite
Value in mm
High : 1,726
#
Rain gause stations
Rainfall contourline
Ca River Basiin
Rainfall from satellite
Value in mm
High : 387
Low : 9
Low : 337
Figure 4a. Comparison of the rainy
season in 2017 between in-situ
measurement and PERSIANN system
Figure 4b. Comparison of the dry
season in 2017 between in-situ
measurement and PERSIANN system
3. Conclusions
1-There are two resources of rainfall data, which are free of charge and convenient
from the Ca River’s basin.
The data collected from the TRMM satellite and GPM satellite of the PSS system.
The rainfall data has been storing from 1st January, 1997 until present (2018) and
continuing in the future. The temporal resolution: rainfall has been measured for 30
minutes, bases on the UTC from 00h to 24h; rainy day; the highest spatial resolution is
5 km x 5 km. Since 2014, the TRMM satellite has stopped working; the next generation
of the satellite is the GPM satellite. TRMM satellite cannot measure an amount less than
50 mm. Otherwise, the GPM could measure what the TRMM can not do.
G-WADI PERSIAN – GeoServer rainfall system has been processing its data from
many sources of different satellites using the PERSIANN-CCS algorithm to combine
artificial intelligence with clouds classification. This processing technique had created a
significant product. It can store rainfall data from 2003 until the present, according to 1
h; 3h; 6 h; 01 day; month and year.
191
Le Thi Thu Hien and Hoang Luu Thu Thuy
Many regions and countries in the world have been using data resources from the
G-WADI PERSIANN system. Therefore, they can build an early warning system base
on these recourses from the G-WADI PERSIANN-CCS GeoServer to minimize the
natural disasters, protecting lives and properties of the citizens in many places of the world.
2- Comparison results of the satellite data and the in-situ measurement station as follows:
Comparing rainfall (from 15th to 18th September, 2015): the distributions are quite
similar between the data collected from in-situ measurement and data collected from the
PERSIANN and PPS system, in which the satellite data from the PPS system (GPM
satellite) has many similarities; the amount of rainfall: The satellite data is usually lower
than the data collected from conventional measurement, the value from the GPM
satellite is more accurate than the PERSIAN.
Comparing the dry season (from the PERSIAN): It shows that the seasonal rainfall
based on the satellites is much lower than the conventional measurement method in the
period of 2010, 2015. This distribution changes through out the years, in 2010 it was
quite similar. But in 2015, it was the opposite. Also, in the dry season, we can see that
the distribution of rainfall is appropriate through out the years. The information from the
satellite is usually higher than the conventional measurements.
Indeed, it is necessary to develop a rainfall algorithm to process rain data
(especially rainfall) before being used in the satellite’s data.
Acknowledgements: This paper presents a part of the results of the project "Researching and
calculating river flows for management and usage of water resources in Ca River basin based on
the application of mathematical models and remote sensing technology". Code: DTĐL.CN-56/15.
REFERENCES
[1] Hobouchian MP, Salio P, Skabar YG, Vila D, Garreaud R, 2017. Assessment of satellite
precipitation estimates over the slopes of the subtropical Andes. Atmos Res 190:4354. />[2] Long Trinh-Tuan, Jun Matsumoto, Thanh Ngo-Duc, Masato I. Nodzu and Tomoshige
Inoue, 2019. Evaluation of satellite precipitation products over Central Vietnam. Progress
in Earth and Planetary Science volume 6, Article number: 54.
[3] Mantas VM, Liu Z, Caro C, Pereira AJSC, 2015. Validation of TRMM multi-satellite
precipitation analysis (TMPA) products in the Peruvian Andes. Atmos Res 163:132–
145. />[4] Qiaohong Sun, Chiyuan Miao, QingyunDuan, HamedAshouri, SorooshSorooshian, and
Kuo-Lin Hsu, 2017. A Review of Global Precipitation Data Sets: Data Sources,
Estimation, and Intercomparisons. Review of Geophysis, Volume 56, Issue1. https://
doi.org/10.1002/2017RG000574.
[5] Global climate data. />[6] Landsat images, SRTM. />[7] Center for Central Hydrometeorological Forecasting, 2011. Hydro-meteorological
Characteristics in 2010. Labour Publishing house.
[8] Center for Central Hydrometeorological Forecasting, 2015. Hydro-meteorological
Characteristics in 2015. Labour Publishing house.
[9] Copernecus Global Land service .
[10] PERSIANN, PERSIANN-CCS />
192