Designing household survey samples: Practical guidelines
Bạn đang xem bản rút gọn của tài liệu. Xem và tải ngay bản đầy đủ của tài liệu tại đây (1.25 MB, 264 trang )
Department of Economic and Social Affairs
Statistics Division
Studies in Methods
Series F No.98
Designing Household Survey Samples: Practical Guidelines
Logo
United Nations
New York, 2005
The Department of Economic and Social Affairs o f the United Nations Secretariat is a
vital interface between global policies in the economic, social and environmental spheres and
national action. The department works in three main interlinked areas: (i) it compiles,
generates and analyses a wide range of economic, social and environmental data and
information on which States Members of the United Nations draw to review common
problems and to take stock of policy options; (ii) it facilitates the negotiations of Members
States in many intergovernmental bodies on joint courses of action to address ongoing or
emerging global challenges; and (iii) it advises interested Governments on the ways and
means of translating policy frameworks developed in United Nations conferences and
summits into programmes at the country level and, through technical assistance, helps build
national capacities.
NOTE
Symbols of the United Nations documents are composed of capital letters combined with
figures.
ST/ESA/STAT/SER.F/98
UNITED NATIONS PUBLICATION
Sales No.
ISBN
Copyright @ United Nations 2005
All rights reserved
Preface
The main purpose of the handbook is to include in one publication the main sample
survey design issues that can conveniently be referred to by practicing national statisticians,
researchers and analysts involved in sample survey work and activities in countries.
Methodologically sound techniques that are grounded in statistical theory are used in the
handbook, implying the use of probability sampling at each stage of the sample selection
process. A well designed household survey which is properly implemented can generate
necessary information of sufficient quality and accuracy with speed and at a relatively low cost.
The contents of the handbook can also be used, in part, as a training guide for
introductory courses in sample survey design at various statistical training institutions that offer
courses in applied statistics, especially survey methodology.
In addition, the handbook has been prepared to complement other publications dealing
with sample survey methodology issued by the United Nations, such as the recent publication on
Household Surveys in Developing and Transitional Countries and the series under the National
Household Survey Capability Programme (NHSCP).
More specifically, the objectives of the Handbook are to:
a.
b.
c.
d.
Provide, in one publication, basic concepts and methodologically sound procedures
for designing samples for, in particular, national-level household surveys,
emphasizing applied aspects of household sample design;
Serve as a practical guide for survey practitioners in designing and implementing
efficient household sample surveys;
Illustrate the interrelationship of sample design, data collection, estimation,
processing and analysis;
Highlight the importance of controlling and reducing nonsampling errors in
household sample surveys.
While having a sampling background is helpful in using the handbook, other users with a
general knowledge of statistical and mathematical concepts should also be able to use and apply
the handbook with little or no assistance. This is because one of the key aims of the handbook is
to present material in a practical, hands-on format as opposed to stressing the theoretical aspects
of sampling. Theoretical underpinnings are, however, provided when necessary. It is expected
that a basic understanding of algebra is all that is needed to follow the presentation easily and to
apply the techniques. Accordingly, numerous examples are provided to illustrate the concepts,
methods and techniques.
In the preparation of this handbook the United Nations Statistics Division was assisted by
Mr. Anthony Turner, Sampling Consultant, who drafted chapters 3 to 5 and finally reviewed the
consolidated document. Mr. Ibrahim Yansaneh, Deputy Chief of Cost of living Division of the
International Civil Service Commission, drafted chapters 6 and 7 and Mr. Maphion Jambwa,
Technical Adviser, Southern African Development Community Secretariat, drafted chapter 9.
The draft chapters were reviewed by an Expert Group Meeting organized, in New York, by the
i
United Nations Statistics Division from 3 to 5 December 2003. List of experts is given in the
Appendix.
ii
Preface.............................................................................................................................................. i
Chapter 1......................................................................................................................................... 1
Sources of Data for Social and Demographic Statistics ................................................................. 1
1.1
Introduction..................................................................................................................... 1
1.2
Data sources ................................................................................................................... 1
1.2.1 Household surveys ......................................................................................................... 1
1.2.2 Population and housing censuses................................................................................... 4
1.2.3 Administrative records................................................................................................... 5
1.2.4 Complementarities of the three data sources ................................................................. 6
1.2.5 Concluding remarks ....................................................................................................... 7
References and further reading ....................................................................................................... 8
Chapter 2......................................................................................................................................... 9
Planning and Execution of Surveys ................................................................................................ 9
2.1
Planning of surveys......................................................................................................... 9
2.1.1 Objectives of a survey.................................................................................................... 9
2.1.2 Survey universe............................................................................................................ 10
2.1.3. Information to be collected ......................................................................................... 10
2.1.4 Survey budget .............................................................................................................. 11
2. 2.
Execution of surveys..................................................................................................... 16
2.2.1 Data collection methods............................................................................................... 16
2.2.2 Questionnaire design.................................................................................................... 18
2.2.3 Tabulation and analysis plan........................................................................................ 20
2.2.4 Implementation of field work ...................................................................................... 21
References and further reading ..................................................................................................... 26
Chapter 3....................................................................................................................................... 27
Sampling Strategies ...................................................................................................................... 27
3.1
Introduction................................................................................................................... 27
3.1.1 Overview...................................................................................................................... 27
3.1.2 Glossary of sampling and related terms....................................................................... 28
3.1.3 Notations ...................................................................................................................... 31
3. 2
Probability sampling versus other sampling methods for household surveys .............. 32
3.2.1 Probability sampling .................................................................................................... 32
3.2.2 Non-probability sampling methods.............................................................................. 34
3.3
Sample size determination for household surveys........................................................ 36
3.3.1 Magnitudes of survey estimates................................................................................... 37
3.3.2 Target population ......................................................................................................... 37
3.3.3 Precision and statistical confidence ............................................................................. 38
3.3.4 Analysis groups - domains........................................................................................... 39
3.3.5 Clustering effects ......................................................................................................... 41
3.3.6 Adjusting sample size for anticipated non-response.................................................... 42
3.3.7 Sample size for master samples ................................................................................... 42
3.3.8 Estimating change or level........................................................................................... 43
3.3.9 Survey budget .............................................................................................................. 43
3.3.10 Sample size calculation.............................................................................................. 44
3.4
Stratification.................................................................................................................. 46
iii
3.4.1 Stratification and sample allocation............................................................................. 47
3.4.2 Rules of stratification ................................................................................................... 48
3.4.3 Implicit stratification.................................................................................................... 49
3.5
Cluster sampling ........................................................................................................... 50
3.5.1 Characteristics of cluster sampling .............................................................................. 51
3.5.2 Cluster design effect..................................................................................................... 51
3.5.3 Cluster size................................................................................................................... 53
3.5.4 Calculating deff ............................................................................................................ 54
3.5.5 Number of clusters ....................................................................................................... 54
3.6
Sampling in stages ........................................................................................................ 54
3.6.1 Benefits of sampling in stages ..................................................................................... 54
3.6.2 Use of dummy stages ................................................................................................... 55
3.6.3 The two-stage design ................................................................................................... 58
3.7
Sampling with probability proportional to size (PPS) .................................................. 60
3.7.1 PPS sampling ............................................................................................................... 60
3.7.2 PPES sampling (probability proportional to estimated size) ....................................... 63
3.8
Options in sampling ...................................................................................................... 65
3.8.1 Epsem, PPS, fixed-size, fixed-rate sampling ............................................................... 65
3.8.2 Demographic and Health Survey (DHS) ..................................................................... 69
3.8.3 Modified Cluster Design - Multiple Indicator Cluster Surveys (MICS) ..................... 70
3.9
Special topics – two-phase samples and sampling for trends ....................................... 72
3.9.1 Two-phase sampling .................................................................................................... 72
3.9.2 Sampling to estimate change or trend.......................................................................... 74
3.10
When implementation goes wrong ............................................................................... 77
3.10.1 Target population definition and coverage ................................................................ 77
3.10.2 Sample size too large for survey budget .................................................................... 78
3.10.3 Cluster size larger or smaller than expected .............................................................. 78
3.10.4 Handling non-response cases ..................................................................................... 79
3.11
Summary guidelines...................................................................................................... 79
References and further reading ..................................................................................................... 81
Chapter 4....................................................................................................................................... 83
Sampling Frames and Master Samples ......................................................................................... 83
4.1
Sampling frames in household surveys......................................................................... 83
4.1.1 Definition of sample frame .......................................................................................... 83
4.1.2 Properties of sampling frames ..................................................................................... 84
4.1.3 Area frames .................................................................................................................. 86
4.1.4 List frames ................................................................................................................... 87
4.1.5 Multiple frames ............................................................................................................ 88
4.1.6 Typical frame(s) in two-stage designs ......................................................................... 89
4.1.7 Master sample frames .................................................................................................. 90
4.1.8 Common problems of frames and suggested remedies................................................ 90
4.2
Master sampling frames................................................................................................ 94
4.2.1 Definition and use of a master sample ......................................................................... 94
4.2.2 Ideal characteristics of PSUs for a master sample frame............................................. 94
4.2.3 Use of master samples to support surveys ................................................................... 95
4.2.4 Allocation across domains (administrative regions, etc.) ............................................ 97
iv
4.2.5 Maintenance and updating of master samples ............................................................. 98
4.2.6 Rotation of PSUs in master samples ............................................................................ 98
4.2.7 Country examples of master samples ........................................................................ 100
4.3
Summary guidelines.................................................................................................... 106
References and further reading ................................................................................................... 108
Chapter 5..................................................................................................................................... 109
Documentation and Evaluation of Sample Designs.................................................................... 109
5.0
Introduction................................................................................................................. 109
5.1
Need for, and types of, sample documentation and evaluation .................................. 109
5.2
Labels for design variables ......................................................................................... 110
5.3
Selection probabilities................................................................................................. 112
5.4
Response rates and coverage rates at various stages of sample selection................... 112
5.5
Weighting: base weights, non-response and other adjustments.................................. 113
5.6
Information on sampling costs.................................................................................... 114
5.7
Evaluation – limitations of survey data ...................................................................... 115
5.8
Summary guidelines.................................................................................................... 117
References and further reading ................................................................................................... 118
Chapter 6..................................................................................................................................... 119
Construction and Use of Sample Weights .................................................................................. 119
6.1
Introduction................................................................................................................. 119
6.2
Need for sampling weights ......................................................................................... 119
6.2.1 Overview.................................................................................................................... 120
6.3
Development of sampling weights.............................................................................. 120
6.3.1 Adjustments of sample weights for unknown eligibility ........................................... 121
6.3.2 Adjustments of sample weights for duplicates .......................................................... 122
6.4
Weighting for unequal probabilities of selection........................................................ 123
6.4.1 Case study in construction of weights: Vietnam National Health Survey 2001....... 127
6.4.2 Self-weighting samples...................................................................................................... 128
6.5
Adjustment of sample weights for non-response........................................................ 128
6.5.1 Reducing non-response bias in household surveys.................................................... 129
6.5.2 Compensating for non-response ................................................................................ 129
6.5.3 Non-response adjustment of sample weights............................................................. 130
6.6
Adjustment of sample weights for non-coverage ....................................................... 132
6.6.1 Sources of non-coverage in household surveys ......................................................... 133
6.6.2 Compensating for non-coverage in household surveys ............................................. 134
6.7
Increase in sampling variance due to weighting ......................................................... 135
6.8
Trimming of Weights.................................................................................................. 136
6.9
Concluding Remarks................................................................................................... 138
References and further reading ................................................................................................... 140
Chapter 7..................................................................................................................................... 141
Estimation of Sampling Errors for Survey Data ......................................................................... 141
7.1
Introduction................................................................................................................. 141
7.1.1 Sampling error estimation for complex survey data .................................................. 141
7.1.2 Overview of the chapter............................................................................................. 142
7.2
Sampling variance under simple random sampling .................................................... 143
7.3
Other measures of sampling error............................................................................... 149
v
7.3.1 Standard error............................................................................................................. 149
7.3.2 Coefficient of variation .............................................................................................. 149
7.3.3 Design effect .............................................................................................................. 150
7.4
Calculating sampling variance for other standard designs ......................................... 150
7.4.1 Stratified sampling ..................................................................................................... 150
7.4.2 Single-stage cluster sampling .................................................................................... 153
7.5
Common features of household survey sample designs and data............................... 154
7.5.1 Deviations of household survey designs from simple random sampling................. 154
7.5.2 Preparation of data files for analysis.......................................................................... 154
7.5.3 Types of Survey Estimates......................................................................................... 155
7.6
Guidelines for presentation of information on sampling errors.................................. 156
7.6.1 Determining what to report ........................................................................................ 156
7.6.2 How to report sampling error information................................................................. 157
7.6.3 Rule of thumb in reporting standard errors................................................................ 157
7.7
Methods of variance estimation for household surveys.............................................. 158
7.7.1 Exact methods ............................................................................................................ 158
7.7.2 Ultimate cluster method ............................................................................................. 159
7.7.3 Linearization approximations .................................................................................... 163
7.7.4 Replication ................................................................................................................. 165
7.7.5 Some replication techniques ...................................................................................... 167
7.8 Pitfalls of using standard statistical software packages to analyze household survey data 172
7.9
Computer software for sampling error estimation ...................................................... 174
7.10
General comparison of software packages ................................................................. 177
7.11
Concluding remarks .................................................................................................... 177
References and further reading ................................................................................................... 179
Chapter 8..................................................................................................................................... 181
Nonsampling Errors in Household Surveys................................................................................ 181
8.1
Introduction................................................................................................................. 181
8.2
Bias and variable error ............................................................................................... 182
8.2.1 Variable component ................................................................................................... 184
8.2.2 Systematic error (bias) ............................................................................................... 185
8.2.3 Sampling bias............................................................................................................. 185
8.2.4 Further comparison of bias and variable error ........................................................... 185
8.3
Sources of nonsampling error ..................................................................................... 186
8.4
Components of nonsampling error.............................................................................. 186
8.4.1 Specification error...................................................................................................... 186
8.4.2 Coverage or frame error............................................................................................. 187
8.4.3 Non-response ............................................................................................................. 189
8.4.4 Measurement error ..................................................................................................... 190
8.4.5 Processing errors ........................................................................................................ 191
8.4.6 Errors of estimation.................................................................................................... 191
8.5
Assessing nonsampling error ...................................................................................... 192
8.5.1 Consistency checks .................................................................................................... 192
8.5.2 Sample check/verification.......................................................................................... 192
8.5.3 Post-survey or re-interview checks ............................................................................ 193
8.5.4 Quality control techniques ......................................................................................... 193
vi
8.5.5 Study of recall errors.................................................................................................. 194
8.5.6 Interpenetrating sub-sampling ................................................................................... 194
8.6
Concluding remarks .................................................................................................... 195
References and further reading ................................................................................................... 196
Chapter 9..................................................................................................................................... 197
Data Processing for Household Surveys..................................................................................... 197
9.1
Introduction................................................................................................................. 197
9.2
The household survey cycle........................................................................................ 197
9.3
Survey planning and the data processing system........................................................ 199
9.3.1 Survey objectives and content ................................................................................... 199
9.3.2 Survey procedures and instruments ........................................................................... 199
9.3.3 Design for household surveys data processing systems ............................................ 202
9.4
Survey operations and data processing ....................................................................... 206
9.4.1 Frame creation and sample design ............................................................................. 206
9.4.2 Data collection and data management ....................................................................... 208
9.4.3 Data preparation......................................................................................................... 209
References and further reading ................................................................................................... 226
Software options for different steps of survey data processing .................................................. 230
Annex: Overview of sample survey design ............................................................................. 233
A.1
Sample design ............................................................................................................. 233
A. 2
Basics of probability sampling strategies ................................................................... 235
A.2.1
Simple random sampling .................................................................................... 235
A.2.2
Systematic sampling .......................................................................................... 240
A.2.2.1.
Linear systematic sampling............................................................................. 241
A.2.2.2
Circular systematic sampling.......................................................................... 241
A. 2.2.3.
Estimation in systematic sampling.................................................................. 242
A. 2.2.4
Advantages of using systematic sampling ...................................................... 244
A. 2.2.5.
Disadvantages of Systematic Sampling .......................................................... 246
A.2.3
Stratification....................................................................................................... 246
A.2.3.1.
Advantages of stratified sampling .................................................................. 246
A. 2.3.2.
Weights ........................................................................................................... 248
A. 2.3.3.
Sample values ................................................................................................. 248
A. 2.3.4.
Proportional allocation.................................................................................... 249
A. 2.3.5.
Optimum allocation ........................................................................................ 249
A. 2.3.6
Determination of within stratum sample sizes................................................ 251
A.2.4
Cluster sampling ................................................................................................ 252
A.2.4.1.
Some reasons for using cluster sampling........................................................ 253
A.2.4.2.
Single stage cluster sampling.......................................................................... 253
A.2.4.3.
Sample mean and variance.............................................................................. 254
Appendix.................................................................................................................................... 255
List of E Experts........................................................................................................................ 255
vii
Chapter 1
Sources of Data for Social and Demographic Statistics
1.1
Introduction
1.
Household surveys are among three major sources of social and demographic statistics in
many countries. It is recognized that population and housing censuses are also a key source of
social statistics but they are conducted, usually, at long intervals of about ten years. The third
source is administrative record systems. For most countries this source is somewhat better
developed for health and vital statistics, however, than for social statistics. Household surveys
provide a cheaper alternative to censuses for timely data and a more relevant and convenient
alternative to administrative record systems. They are used for collection of detailed and varied
socio-demographic data pertaining to conditions under which people live, their well-being,
activities in which they engage, demographic characteristics and cultural factors which influence
behaviour, as well as social and economic change. This, however, does not preclude the
complementary use of data generated through household surveys with data from other sources
such as censuses and administrative records.
1.2
Data sources
2.
As mentioned in the introductory section, the main sources of social and demographic
data are population and housing censuses, administrative records and household sample surveys.
These three sources, if well planned and executed, can be complementary in an integrated
programme of data collection and compilation. Social and demographic statistics are essential for
planning and monitoring socio-economic development programmes. Statistics on population
composition by age and sex including geographical distribution are among the most basic data
necessary to describe a population and/or a sub-group of a population. These basic characteristics
provide the context within which other important information on social phenomena, such as
education, disability, labour force participation, health conditions, nutritional status, criminal
victimization, fertility, mortality and migration, can be studied.
1.2.1 Household surveys
3.
Household sample surveys have become a key source of data on social phenomena in the
last 60-70 years. They are among the most flexible methods of data collection. In theory almost
any population-based subject can be investigated through household surveys. It is common for
households to be used as second-stage sampling units in most area-based sampling strategies (see
chapters 3 and 4 of this handbook). In sample surveys part of the population is selected from
which observations are made or data are collected and then inferences are made to the whole
population. Because in sample surveys there are smaller workloads for interviewers and a longer
time period assigned to data collection, most subject matter can be covered in greater detail than
in censuses. In addition, because there are far fewer field staff needed more qualified individuals
can be recruited and they can be trained more intensively than is possible in a census operation.
1
The reality is that not all the data needs of a country can be met through census-taking; therefore,
household surveys provide a mechanism for meeting the additional and emerging needs on a
continuous basis. The flexibility of household surveys makes them excellent choices for meeting
data users’ needs for statistical information which otherwise would not be available and
insufficient.
1.2.1.1 Types of household surveys
4.
Many countries have in place household survey programmes that include both periodic
and adhoc surveys. It is advisable that the household survey programme be part of an integrated
statistical data collection system of a country. In the area of social and demographic statistics
intercensal household surveys can constitute part of this system.
5.
The National Household Survey Capability Programme (NHSCP) was a major effort to
help developing countries establish the statistical and survey capabilities to obtain requisite
socio-economic and demographic information from the household sector. The NHSCP was
implemented for nearly 14 years from 1979 to 1992. By the time of its conclusion, 50 countries
had participated in the programme. Its major achievement was the promotion and adoption by
countries of continuous multi-subject, integrated household surveys. In addition, the programme
fostered sample survey capacity-building, especially in African countries.
6.
There are different types of household surveys that can be conducted to collect data on
social and demographic statistics such as specialized surveys, multi-phase surveys, multi-subject
surveys and longitudinal surveys. The selection of the appropriate type of survey is dependent
on a number of factors including subject matter requirements, resources and logistical
considerations.
7.
Specialized surveys cover single subjects or issues such as time-use or nutritional status.
The surveys may be periodic or ad-hoc.
8.
Multi-phase surveys entail collecting statistical information in succeeding phases with
one phase serving as a precursor to the next. The initial phase usually constitutes a larger sample
than subsequent phases. It is used to screen sample units based on certain characteristics to
ascertain the eligibility of such units to be used in the subsequent phases. These surveys are a
cost-effective way of reaching the target population in the latter phases to collect detailed
information on a subject of interest. The study of such topics as disability and orphanhood are
among those suited to this approach.
9.
In multi-subject surveys, different subjects are covered in a single survey. This approach
is generally more cost-effective than conducting a series of single subject surveys.
10.
In longitudinal surveys, data is collected from the same sample units over a period of
time. The interval can be monthly, quarterly or annually. The purpose for conducting such
surveys is to measure changes in some characteristics for the same population over a period of
time. The major problem with this type of surveys is the high attrition rate of respondents. There
is also the problem of conditioning effect.
2
1.2.1.2 Advantages and limitations compared to censuses
11.
While household surveys are not as expensive as censuses they can, nevertheless, become
quite costly if results have to be produced separately for relatively lower administrative domains
such as provinces or districts. Unlike a census where data are collected for millions of
households, a sample survey is typically limited to a sample of several thousand households due
to cost constraint, severely limiting its use to produce reliable data for small areas. See more
about the relationship of sample size on data reliability for small areas and domains in
succeeding chapters.
Some advantages of household surveys compared to censuses are as follows:
a.
b.
c.
As mentioned above, the overall cost of a survey is generally lower compared to a
census as the latter requires large amounts of manpower, financial, logistical and
material resources. From a probability sample, properly selected and implemented,
accurate and reliable results can be a basis for making inferences on the total
population. Consequently for some estimates such as total fertility rate, there is no
compelling need for a census.
In general sample surveys produce statistical information of better quality because, as
stated earlier, it is more feasible to engage better and well-trained interviewers. It is
also easier to provide better supervision because supervisors are usually well trained
and the supervisor/interviewer ratio can be as high as 1 to 4. In addition it is possible
to use better technical equipment for taking physical measurements in surveys when
such measurements are needed. In a census data quality is, in some cases,
compromised because of the massive nature of the exercise, which is prone to lapses
in, and neglect of, quality assurance at various stages, resulting in high nonsampling
errors.
There is greater scope and flexibility in a sample survey than in a census with respect
to the depth of investigation and number of items in the questionnaire. Information of
a more specialized type may not be collected in a census because of the prohibitive
number of specialists or equipment necessary to carry out the study. An example is
the weighing of food and other measurements in a nutrition study. It is likewise not
feasible to subject every person in the population to a medical examination to collect
health information such as the incidence of HIV/AIDS infection. On the other hand,
it is possible to add items in a household sample survey that would be relatively
complex for the census.
12.
Sample surveys are better suited for the collection of national and relatively large
geographic domain level data on topics that need to be explored in depth such as the multidimensional aspects of disability, household expenditure, labour-force activities and criminal
victimization. This is in contrast to censuses that collect and are a source of relatively general
information covering small domains.
13.
In general, the strengths of household survey statistical operations include the flexibility
of data collection instruments to accommodate a larger number of questions on a variety of
3
topics and also the possibility of estimating parameters comparable to those measured in
population and housing censuses.
1.2.2 Population and housing censuses
14.
A population census, henceforth referred to as census, is the total process of collecting,
compiling, evaluating and disseminating demographic, social and other data at a specified time
covering all persons in a country or in well-delimited part(s) of a country. It is a major source of
social statistics, with its obvious advantage of providing reliable data – that is, unaffected by
sampling error - for small geographic units. A census is an ideal method for providing
information on size, composition and spatial distribution of the population in addition to socioeconomic and demographic characteristics. In general the census collects information for each
individual in households and each set of living quarters, usually for the whole country or welldefined parts of the country.
1.2.2.1 Basic features of a traditional population and housing census
a.
b.
c.
d.
Individuals in the population and each set of living quarters are enumerated separately
and the characteristics thereof are recorded separately.
The goal of a census is to cover the whole population in a clearly defined territory. It
is intended to include every person present and/or usual residents depending on
whether the type of population count is de facto or de jure. In the absence of
comprehensive population or administrative registers, censuses are the only source
that can provide small area statistics.
The enumeration over the entire country is generally as simultaneous as possible. All
persons and dwellings are enumerated with respect to the same reference period.
Censuses are usually conducted at defined intervals. Most countries conduct censuses
every 10 years while others every five years. This facilitates the availability of
comparable information at fixed intervals.
1.2.2.2 Uses of census results
a.
b.
c.
Censuses provide information on size, composition and spatial distribution of
population together with demographic and social characteristics.
Censuses are a source of small area statistics.
Census enumeration areas are the major source of sampling frames for household
surveys. Data collected in censuses are often used as auxiliary information for
stratifying samples and for improving the estimation in household surveys.
1.2.2.3 Main limitations of censuses
15.
Because of its unparalleled geographical coverage it is usually a major source of baseline
data on the characteristics of the population. It is not feasible, therefore, to cover many topics
4
with appreciable detail. The census may not be the most ideal source of detailed information, for
example on, economic activity. Such information requires detailed questioning and probing.
16.
Because the census interview relies heavily on proxy respondents it may not always
capture accurate information on characteristics which only an individual might know, such as
occupation, hours worked, income, etc.
17.
Population censuses have been carried out in many countries during the past few decades.
For example, about 184 countries and areas have conducted censuses during the 2000 round
(1995-2004).
1.2.3 Administrative records
18.
Many types of social statistics are compiled from various administrative records as byproducts of the administrative processes. Examples include health statistics compiled from
hospital records, employment statistics from employment exchange services, vital statistics
compiled from the civil registration system and education statistics from enrolment reports of the
ministries of education. The reliability of statistics from administrative records depends on the
completeness of the administrative records and the consistency of definitions and concepts.
19.
While administrative records can be very cost-effective sources of data, such systems are
not well established in most developing countries. This implies that in a majority of cases such
data are inaccurate. Even if the administrative recording processes are continuous for purposes of
administration, the compilation of statistics is, in most cases, a secondary concern for most
organizations and, as a result, the quality of the data suffers. Statistical requirements that need to
be maintained such as standardization of concepts and definitions, adhering to timeliness and
complete coverage are not usually considered or adhered to.
20.
For most countries, information from administrative records is often limited in content as
their uses are more for legal or administrative purposes. Civil registration systems are examples
of administrative systems that many countries have developed. However, not all countries have
been successful in this effort. Countries with complete vital registration systems are able to
produce periodic reports on vital events, such as number of live births by sex; date and place of
births; number of deaths by age; sex; place of deaths and cause of death; marriages and divorces;
etc.
21.
A population register maintains life databases for every person and household in a
country. The register is updated on a continuous basis when there are changes in the
characteristics of an individual and/or a household. If such registers are combined with other
social registers they can be a source of rich information. Countries which have developed such
systems include Denmark, Norway, the Netherlands, Germany and Sweden. For most of these
countries censuses are based on the registration system.
22.
In many developing countries, while administrative records for various social
programmes can be cost-effective data source and an attractive proposition, they are not well
5
developed. Administrative records are often limited in content and do not usually have the
adaptability of household surveys from the standpoint of concepts or subject detail. In this case
their complementary use with other sources is a big challenge because of lack of standardized
concepts, classification systems coupled with selective coverage and under-coverage.
1.2.4 Complementarities of the three data sources
23.
The sub-sections above, in this chapter, have alluded to various ways in which censuses,
surveys and administrative record systems can be used in concert. This sub-section provides
more detail on the subject of combining information from different data sources in a
complementary fashion. The interest in this area is driven by the necessity to limit census and
survey costs and to lower response burden, to provide data at lower domains, which may not be
covered by survey data for instance, and to maximize the use of available data in the country.
24.
Because censuses cannot be repeated frequently, household surveys provide a basis for
updating some census information especially at national and other large domain levels. In most
cases only relatively simple topics are investigated in a census and the number of questions is
usually limited. Census information can therefore be complemented by detailed information on
complex topics from the household surveys, taking advantage of their small size and potential
flexibility.
25.
Censuses and household surveys have, in many instances, been complementary.
Collecting information on additional topics from a sample of the households during the census is
a cost-effective way to broaden the scope of the census to meet the expanding demands of social
statistics. The use of sampling methods and techniques makes it feasible to produce urgently
needed data with acceptable precision when time and cost constraints would make it impractical
to obtain such data through complete enumeration.
26.
The census also provides a sampling frame, statistical infrastructure, statistical capacity
and benchmark statistics that are needed in conducting household surveys. It is common to draw
a sample of households within a census context, to collect information on more complex topics
such as, disability, maternal mortality, economic activity and fertility.
27.
Censuses support household surveys by providing sampling frames; the census provides
an explicit list of all area units, such as enumeration areas, commonly used as first stage units in
household sample surveys selection process. Moreover, some auxiliary information available
from a census can be used for efficient design of surveys. Furthermore, auxiliary information
from censuses can be used to improve sample estimates through regression and ratio estimates,
thereby improving the precision of survey estimates.
28.
In order to achieve integration of data sources there is need to clearly identify units of
enumeration and adopt consistent geographic units in collecting and reporting statistics through
the various sources. In addition, it is essential to adopt common definitions, concepts and
classifications across different sources of data including administrative records.
6
29.
Data from household surveys can also be used to check census coverage and content. The
aim is to determine the size and direction of such errors. Post enumeration surveys were, for
instance, used for this purpose during the 2000 round of censuses in Zambia and in Cambodia to
evaluate coverage errors. Likewise census data can be used to evaluate some survey results.
30.
Small area estimation, which has received a lot of attention due to growing demand for
reliable small area estimators, is an area where data from surveys and administrative records are
used to produce estimates concurrently. Traditional area-specific direct estimators do not provide
adequate precision because sample sizes in small areas are seldom large enough. Small area
estimation is based on a range of statistical techniques used to produce estimates for areas when
traditional survey estimates for such areas are unreliable or cannot be calculated. The techniques
involve models that borrow strength over space and time or from auxiliary information from
administrative records or censuses. The basic idea of small area procedures is, therefore, to
borrow and combine the relative strength of different sources of data in an effort to produce more
accurate and reliable estimates.
31.
In countries with well-developed civil registration systems, census and survey data can be
successfully used together with data from administrative records. For example in the 1990
population census in Singapore, interviewers had pre-filled basic information, from
administrative records, for every member of the household. This approach reduced interviewing
time and enumeration costs. Since the register-based census provides only the total count of the
population and basic characteristics of the population, detailed socio-economic characteristics
are collected on a sample basis.
32.
Data from administrative records can be used to check and evaluate results from surveys
and censuses. For instance in countries with complete vital registration systems, data on fertility
and mortality from censuses can be cross-checked with that from the registration system.
1.2.5 Concluding remarks
33.
In conclusion household, surveys, censuses and administrative sources should be viewed
as complementary. This implies that, whenever possible, in planning for censuses and surveys
common concepts and definitions should be used. Administrative procedures should also be
checked periodically to make sure that common concepts and definitions are being used.
34.
The household survey programme should be part of an integrated statistical data
collection system within a country, including censuses and administrative records so that the
overall needs for socio-demographic statistics can be adequately met.
7
References and further reading
Ambler, R. et al. (2001), “Combining Unemployment Benefits Data and LFS to Estimate ILO
Unemployment for Small Areas: An Application of Modified Fay-Herriot Method,”
Invited Paper, International Statistical Institute Session, Seoul.
Banda, J (2003), Current Status of Social Statistics: An overview of Issues and Concerns, United
Nations Expert Group Meeting in collaboration with the Siena Group on Social
Statistics, New York, 6-9 May 2003.
Bee-Geok, L. and Eng-Chuan, K. (2001), “Combining Survey and Administrative Data for
Singapore’s Census of Population 2000,” Invited Paper, International Statistical Institute
Session, Seoul.
Kiregyera, B. (1999), Sample Surveys: with Special Reference to Africa, PHIDAM Enterprises,
Kampala.
Rao, J.N.K. (1999), “Some Recent Advances in Model-based Small Area Estimation,” Survey
Methodology, Vol.25, No.2, pp. 175-186, Statistics Canada, Ottawa.
Singh, R. and Mangat, N. (1996), Elements of Survey Sampling, Kluwer Academic Publishers,
Boston.
Statistics Canada. (2003) Survey Methods and Practices, Ottawa.
United Nations Statistics Division (1982), Nonsampling Errors in Household Surveys: Sources,
Assessment and Control, National Household Survey Capability Programme, United
Nations, New York.
___________________________ (1984), Handbook of Household Surveys, revised edition
ST/ESA/SER.F/31, United Nations, New York.
___________________________ (1998), Principles and Recommendations for Population and
Housing Censuses, Revision 1, ST/ESA/STAT/SER.M/67/REV.1, New York
___________________________ (2001), Principles and Recommendations for a Vital Statistics
System, Revision 2, ST/ESA/STAT/SER.M/19/Rev. 2, New York.
United Nations (2002), Technical Report on Collection of Economic Characteristics in
Population Censuses, Statistics Division, Department of Social and Economic Affairs
and Bureau of Statistics, International Labour Office, New York and Geneva.
Whitfold, D. and Banda, J. (2001), “Post Enumeration Surveys: Are they Worth it?” United
Nations Symposium on Global Review of 2000 Round of Population and Housing
Censuses: Mid –Decade Assessment and Future Prospects, New York, 7-10 August.
8
Chapter 2 Planning and Execution of Surveys
Chapter 2
Planning and Execution of Surveys
1.
While the emphasis of this handbook is on the sampling aspects of household surveys, it
is necessary to provide an overview of household survey planning, operations and
implementation in order to fit the sampling chapters and sections into proper context. There are
many textbooks, handbooks and manuals that deal, in considerable detail, with the subject of
household survey planning and execution and the reader is urged to refer to those for more
information. Many of the main points, however, are highlighted and briefly described in this
chapter. A key feature of planning and execution is sample design and selection but those topics
are discussed in chapters 3 and 4.
2.1
Planning of surveys
2.
For a survey to yield desired results, there is need to pay particular attention to the
preparations that precede the field work. In this regard all surveys require careful and judicious
preparations if they have to be successful. However, the amount of planning will vary depending
on the type of survey, materials and information required. The development of an adequate
survey plan requires sufficient time and resources and a planning cycle of two years is not
uncommon for a complex survey (for detailed discussion on survey planning see United Nations
Handbook of Household Surveys ST/ESA/Ser.F/31, 1984).
2.1.1 Objectives of a survey
3.
It is imperative that the objectives of a survey be clearly spelled out from the start of the
project. There should be a clear statistical statement on the desired information, giving a clear
description of the population and geographical coverage. It is also necessary at this stage to
stipulate how the results are going to be used. The given budget of the survey should guide the
survey statistician in tailoring the objectives. Taking due cognizance of the budgetary constraints
will facilitate successful planning and execution of the survey.
4.
In some cases objectives of surveys are not explicitly stated. For instance, a survey
organization may be called upon to carry out a study on the activities of the informal sector. If
the purpose is not clearly stated, it is for the statistician or survey manager to define the informal
sector in operational terms for survey-taking, outlining in detail the particular economic activities
that most closely reflect the requirements of the sponsoring agency. It should be mentioned that a
survey which has ambiguous and vague objectives is very much susceptible to high nonsampling
errors.
5.
It is very important that stakeholders, thus various users and producers of statistics, be
involved in defining the objective of the survey as well as its scope and coverage. The
consultations help to come up with consensus or compromises on what data are needed, the form
in which data are required, levels of disaggregation, dissemination strategies and frequency of
data collection.
9
Chapter 2 Planning and Execution of Surveys
6.
Some of the surveys conducted by survey organizations have clear objectives. For
example, the 1983 Zambian Pilot Manpower Survey had the following objectives:
a.
b.
c.
d.
To collect information on the size and composition of currently working
population in the formal sector;
To assess manpower demand and supply;
To serve as a basis for making manpower projections for particular occupations.
To assist in planning for the expansion of education in fields that are crucial to
economic development.
7.
It should be noted that having clearly stated objectives is the first step in forming the
basis of what questions to ask in the survey for which statistical answers are required.
2.1.2 Survey universe
8.
When planning to carry out a survey, it is necessary to define the geographical areas to be
covered and the target population. In a household Income and Expenditure Survey, for instance,
the survey may cover the urban areas and perhaps exclude rural areas.
9.
In defining the universe, the exact population to be sampled should be identified. In the
above-mentioned survey the universe of first stage units would be enumeration areas (EAs) in
urban areas and the second-stage would be households in selected EAs.
10.
It should be pointed out that in practice, however, the target population is somewhat
smaller than the population forming the universe. It is usual to restrict the target population for a
number of reasons. For instance, in some surveys, some military households in barracks may be
excluded from the survey. In labour-force surveys, children below a specified age may be shown
as members of households surveyed, but would not be part of the labour-force.
11.
It is important to note that when the actual population differs from the target population,
the results will apply to the particular population from which a sample was drawn. As discussed
in chapter 4, comprehensive and mutually exclusive frames should be constructed for every stage
of selection.
2.1.3. Information to be collected
12.
From the list of questions requiring statistical answers, a list of items that could provide
factual information bearing on issues under investigation can be produced. It is always important
to bear in mind that some of the required data could be available from existing sources. In
producing the list of items, provision should be given for the inclusion of supplementary items
that are correlated with the main items. In a survey of Employment and Earnings, for example,
supplementary information on age, sex and education may be gathered. Such information would
give additional insight into related questions and thus enrich the analysis.
10
Chapter 2 Planning and Execution of Surveys
13.
We may add that a tabulation plan should be produced at the time of planning the survey.
The blank tables should be circulated for comments and improvement.
2.1.4 Survey budget
14.
The survey budget indicates the financial requirements of the survey which is to be
conducted. The budget is necessary to support and guide the implementation of the survey and
the construction of the timetable for producing the survey results. Cost estimates must be as
detailed as possible. It is therefore necessary to understand all the detailed steps involved in the
survey operation. The budget shows cost of personnel, equipment and all other items of expense.
If there is a pre-determined ceiling (which is usually the case) of funds available, the overall
survey budget must be within the pre-determined framework. It is also advisable to follow the
general guidelines of the financing agency in preparing the budget. This may facilitate the
approval of the budget estimates. If there is need to depart from the prescribed budget, authority
must be sought from the relevant organization(s). The financial requests of the survey should be
prepared at an early stage. In general, the budget will depend largely on the survey design,
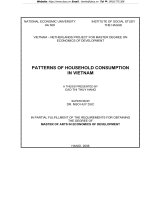
precision required and geographical coverage. Table 2.1 below illustrates a possible survey
budget.
11
Chapter 2 Planning and Execution of Surveys
TABLE 2.1. Illustration of a cost worksheet for a household survey programme
Estimated units of work
(person-months except
where otherwise
indicated)
Activity
I.
PLANNING AND PREPARATORY ACTIVITIES
Initial planning and subsequent monitoring (senior staff)
…………….……………
A.
B.
Selection and specification of subject-matter
1
2
3
Subject-matter planning ..........................................................
Preparation of tabulation plans ...............................................
Secretarial and other services ................................................
C
D.
E.
Development of survey design
1.
Initial design planning: survey structure, population coverage, sampling
procedures, data collection methods etc. (professional staff)
2.
Development of sampling materials:
(a) Cartographic materials (assumes census materials available):
Personnel costs .............................................................
Maps and supplies .........................................................
(b) Field household listings (2,000 enumeration areas):
Personnel costs (mainly interviewers) ...........................
Travel costs ............................................................
(c) Sample selection and preparation from field lists
Design and printing of questionnaires and other
1
2
3
Professional staff ....................................................................
Secretarial and other services ................................................
Printing costs (after pre-tests) ................................................
Pre-testing
1
Professional staff planning:
(a) Initial preparations .........................................................
(b) Analysis of results and revision of
materials ........................................................................
2.
Field supervisor:
(a) Personnel costs .............................................................
(b) Travel costs ...................................................................
3. Interviewers:
(a) Personnel costs ..................................................................
(b) Travel costs ........................................................................
F.
Preparation of instructional and training materials
for field use
1. Professional staff ........................................................................
2. Secretarial and other services ...................................................
3. Reproduction costs .....................................................................
G.
H.
Miscellaneous planning activities (for example, public relations and
publicity)
Subtotal components
I.
2.
3.
4.
5.
6.
7.
Senior staff ..................................................................................
Professional staff ........................................................................
Technical staff .............................................................................
Service staff ................................................................................
Travel ...........................................................................................
Printing ........................................................................................
Cartography and miscellaneous .................................................
SUBTOTAL
II.
FIELD OPERATIONS
A. Training of field supervisors
1. Personnel costs ...........................................................................
2. Lodging and meals ......................................................................
3. Travel costs .................................................................................
12
Unit cost (relevant unit
of currency per
person-month, except
where otherwise
indicated)
Estimated total
cost relevant
unit of
currency)
Chapter 2 Planning and Execution of Surveys
B.
Training of interviewers
1. Supervisor costs ..........................................................................
2. Interviewer costs:
(a) Personnel costs .............................................................
(b) Travel costs ...................................................................
C.
Data collection (including quality control)
1. Supervisor costs:
(a) Personnel costs ..................................................................
(b) Travel costs .........................................................................
2. Interviewer costs .........................................................................
Field administration
D.
1. Field direction ..............................................................................
2. Travel ...........................................................................................
3. Other costs (for example, control and shipment
of materials) ................................................................................
Subtotal components
E.
1.
2.
3.
4.
5.
6.
7.
Professional staff ........................................................................
Technical staff .............................................................................
Service staff ................................................................................
Travel ...........................................................................................
Travel subsistence ......................................................................
Interviewing .................................................................................
Miscellaneous ..............................................................................
SUBTOTAL
III.
DATA PROCESSING
A.
B.
C.
Systems planning
Computer programming
Clerical coding
1.
2.
3.
D.
1.
2.
3.
E.
F.
G.
1.
2.
3.
4.
5.
6.
Initial coding ......................................................................................
Quality control ..................................................................................
Supervision ......................................................................................
Key-to-disk operations
Initial keying .....................................................................................
Quality control .................................................................................
Supervision ......................................................................................
Computer time (including operator and maintenance
costs)
Miscellaneous processing costs (supplies etc.)
Subtotal components
Professional staff
Technical staff
Quality control staff
Service staff
Computing
Miscellaneous
SUBTOTAL
IV.
DATA REVIEW AND PUBLICATION
A.
B.
V.
Professional time .....................................................
Publication costs ......................................................
SURVEY DIRECTION AND CO-ORDINATION
(continuing oversight over all activities) .......................
VI.
VII.
SUBTOTAL ...................................................................................
EVALUATION STUDIES AND METHODOLOGICAL RESEARCH
VIII.
GENERAL OVERHEAD
(may be estimated at 10 per cent of cumulative total)
(may be estimated at 15 per cent of
cumulative total for administrative
costs, space rental, general supplies
and the like) .......................................................................
IX.
TOTAL
Sourrce: Handbook of household surveys (revised edition) St/ESA/StTAT/SER.F/31, United Nations, New York 1984
13
Chapter 2 Planning and Execution of Surveys
15.
It is essential that an effective cost control system be established in the organization that
is conducting the survey. In most large scale survey operations, chances are high of losing
control of monitoring the disbursement of funds once field work starts. In such circumstances a
large amount of funds tend to be channeled in areas unrelated to the major survey operations.
Judicious cost control helps to monitor actual expenditures in relation to estimated costs and
actual work accomplished. It is imperative that management responsible for the survey should
ensure accountability of funds. This greatly enhances the credibility of the survey organization.
14
Chapter 2 Planning and Execution of Surveys
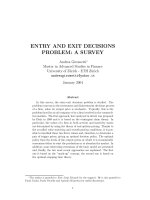
The following graphic is an illustration of a timetable.
15
Chapter 2 Planning and Execution of Surveys
2. 2. Execution of surveys
2.2.1 Data collection methods
16.
There are a number of methods used in data collection, among them, direct observation
and measurement; mail questionnaire; telephone and personal interview.
Direct observation and measurement: is the most ideal method as it is usually more objective. It
is free from memory lapse and subjectivity of both respondents and interviewers. Examples of
areas where direct observation has been used are:
a.
b.
Some aspects of food consumption surveys;
Price collection exercises, where enumerators can purchase the produce and
record prices.
17.
This method, though useful, has a snag of being expensive both in terms of resources
and time. In most cases, interviewers have to use some equipment. Experience has shown that
the method of direct observation and measurement tends to be useful and practical when the
sample sizes or populations are relatively small.
Mail questionnaires: the use of mail questionnaires is fairly cheap and quick. The major cost
component at the data collection stage is postage. After the questionnaire is designed and
printed it is mailed to respondents. In this case the respondents are assumed to be literate as they
are expected to fill the questionnaire on their own. This may be an erroneous assumption
especially in developing countries where literacy levels are still low. The major weakness of
this method is the high non-response rates associated with it. This may be due to the complexity
of questionnaires used. However, apathy cannot be completely ruled out. In some cases there is
good questionnaire response but high item non-response.
18.
In trying to improve the response rate, some reminders have to be sent to nonrespondents. However, it is advisable to select a sub-sample of the non-respondents and cover
them by the personal interview method. This may be necessary because the characteristics of
the non-responding units may be completely different from those that responded. In this case
the responding and non-responding units are treated as two post-strata that have to be
differentially weighted when preparing the estimates (see more about survey weighting in
subsequent chapters particularly chapter 6). In order to increase the response rate, the mailed
questionnaires should be attractive, short and as simple as possible. Enclosing stamped and
addressed returns may help to improve the response rate.
19.
In order to use this method satisfactorily, there must also be a sampling frame that is as
current as possible. Thus addresses of the respondents must be up-to-date. The survey
organization must also be convinced that respondents are capable of completing the
questionnaires on their own.
20.
Here is a summary of some of the advantages and limitations of mail questionnaire
surveys:
16