Molecular mapping of QTLs for zinc deficiency tolerance in rice (Oryza sativa L.)
Bạn đang xem bản rút gọn của tài liệu. Xem và tải ngay bản đầy đủ của tài liệu tại đây (386 KB, 9 trang )
Int.J.Curr.Microbiol.App.Sci (2018) 7(11): 2267-2275
International Journal of Current Microbiology and Applied Sciences
ISSN: 2319-7706 Volume 7 Number 11 (2018)
Journal homepage:
Original Research Article
/>
Molecular Mapping of QTLs for Zinc Deficiency Tolerance
in Rice (Oryza sativa L.)
Elicherla Siva Sankar Reddy*, S.B. Verulkar and R.R. Saxena
Indira Gandhi Krishi Viswavidyalaya, College of Agriculture, Raipur, Chhattisgarh, India
*Corresponding author
ABSTRACT
Keywords
Rice, Zinc
deficiency, QTLs,
SSR markers
Article Info
Accepted:
18 October 2018
Available Online:
10 November 2018
Zinc deficiency which leads to “Khaira” disease is the major micronutrient problem in
rice. It can be corrected by applying zinc supplements to the soil or plant which will put
burden on resource poor farmers. Present investigation was taken to map QTLs for zinc
deficiency tolerance to zinc deficiency in rice which may helpful to develop zinc
deficiency tolerant cultivars. Phenotypic data generated under rainfed zinc deficiency field
condition using 271 recombinant inbred lines(RILs) derived from cross between two
indica genotypes, Danteshwari and Dagad Deshi during wet season 2011 concluded that
zinc deficiency tolerance as a polygenic trait. Bulk segregant analysis (BSA) and cosegregation analysis methods were used to generate genotypic data followed by single
marker analysis with chi-square test along with Yates correction for molecular mapping of
QTLs related to zinc deficiency tolerance. Three QTL S linked with HvSSR 01- 80, HvSSR
01-87 and RM 499 markers identified on chromosome 1, two QTLs linked with RM 135
and RM 232 markers located on chromosome 3, one QTL linked with marker HvSSR 0531 present on chromosome 5, two QTLs linked with RM 242 and RM 296 on chromosome
9 and one QTL linked with marker RM 26334 located on chromosome 11 are contributing
zinc deficiency tolerance based on the genotypic data.
Introduction
“Rice is life”- This slogan of the international
year of rice 2004, outlines the importance of
rice. Rice (Oryza sativa L.) is the most
important cereal crop that has been referred as
“Global Grain” (Shalini and Tulasi, 2008)
because of its use as prime staple food in
about 100 countries of the world. Zinc is one
of the essential nutrients for plants and its
deficiency is one of the major micronutrient
constraints to crop production throughout the
world. It was first diagnosed in on calcareous
soils of northern India (Nene, 1966; Yoshida
and Tanaka, 1969). The “khaira‟ disease of
India, “Hadda” of west Pakistan and “TayaTaya” of the Philippines have been known for
a long time among local farmers though the
causes were unknown.
However, this disorder was proved later as due
to zinc deficiency (Tanaka, 1970). It has been
associated with a wide range of soil
conditions: high pH (7.0), low available zinc
content, prolonged submergence and low
redox potential, high organic matter and
bicarbonate content, high magnesium (Mg) to
2267
Int.J.Curr.Microbiol.App.Sci (2018) 7(11): 2267-2275
calcium (Ca) ratio and high available P (Nene
and Lantin, 1994).
Rice yield and growth is very sensitive to zinc
and it can be corrected by adding zinc
compounds to the soil or plant, but the high
cost associated with applying zinc fertilizers in
sufficient quantities to overcome zinc
deficiency places considerable burden on
resource-poor farmers and it has therefore
been suggested that breeding efforts should be
intensified to improve the tolerance to zinc
deficiency in rice cultivars (Quijano-Guerta et
al., 2002 and Singh et al., 2003).
In this study an attempt has been made to
identify QTLs for tolerance to zinc deficiency
in rice using Recombinant Inbred Line (RIL)
mapping population with the help of
microsatellite markers.
Materials and Methods
A Recombinant Inbred line population in F12
generation having 271 lines was developed
from Danteshwari and Dagad Deshi (drought
tolerant land race) as parents by using
modified single seed descent method. In the
present study, 271 lines of this RIL population
along with parents were in the field during wet
season 2011 at research cum instructional
farm of College of Agriculture, IGKV, Raipur.
The field trials were conducted under rainfed
direct sown condition. Each genotype was
sown in three rows of 2 m length and one line
gap with spacing of 15 cm between rows. All
the genotypes were replicated twice in RBD
design.
Scoring of zinc deficiency tolerance
Zinc deficiency scale (Anon, 2002)
1 - Growth and tillering nearly normal;
healthy
2 - Growth and tillering nearly normal; basal
leaves slightly discolored
3 - Stunting slight, tillering decreased, some
basal leaves brown or yellow
5 - Growth and tillering severely retarded,
about half of all leaves brown or yellow
7 - Growth and tillering ceases, most leaves
brown or yellow
9 - Almost all plants dead or dying
Soil sampling
Six soil samples were collected from the
experimental field at different locations to
know zinc nutrient present in the soil. These
soil samples were analyzed in soil science
laboratory by using Atomic Absorption
Spectrophotometry (AAS). Readings of these
samples were ranged between 0.5ppm to
1.0ppm. Critical level of soil below which
zinc deficiency might occur is 1.0ppm (Castro,
1977).
Genomic DNA isolation
A mini prep method was used to extract
genomic DNA from selected lines along with
parents. Approximately 2g of young leaf
material cut into the small pieces was
transferred to 2ml centrifuge containing 500
µl of DNA extraction buffer along with small
stainless steel beads. These tubes were fixed in
tissue homolyzer (MO. BIO. powerlyzer 24)
and it was operated in two cycles at 2400 rpm
about 2 minutes with 5 seconds pause between
two cycles. After removing stainless steel
beads from tubes, 400 µl of 24:1 choloroform:
Iso amyl Alcohol was mixed. Centrifugation
of these tubes at 14000rpm for about four
minutes gave super aqueous which was taken
into new centrifuge tube. To the double of the
super aqueous taken 100% chilled ethanol was
added and it was kept at -20O C for about 30
2268
Int.J.Curr.Microbiol.App.Sci (2018) 7(11): 2267-2275
minutes to precipitate the DNA. After that it
was centrifuged at 14000rpm for about four
minutes to settle the DNA as a pellet and later
it was washed with 70% ethanol. At the end it
was air dried and 100µl TE buffer was added
to dissolve the DNA pellet. Each DNA sample
was quantified and diluted to 20ɳg/l to
proceed for PCR.
Bulking of DNA samples for selective
genotyping
Diluted DNA (20ɳg/l) from each eleven lines
which were most tolerant and most susceptible
to zinc deficiency was taken and prepared
bulks as tolerant bulk lines (TBL) and
susceptible lines (SBL) respectively as
suggested by Michelmore et al., (1991).
PCR and electrophoresis
For amplification, SSR and HvSSR (Highly
Variable SSR) markers were used. For DNA
amplification, reaction mixture consisted of
following in 20l volume (Table 1) and
temperature
profile
used
for
PCR
amplification (Table 2). To each completed
reaction 2l of loading dye was added and
they were electrophorosed in 5% PAGE (Poly
Acrylamide Gel Electrophoresis). After
electrophoresis gels were stained with
Ethidium Bromide (EtBr) for 4 minutes,
washed with distilled water and photographed
using gel doc unit (BIO RAD).
Selective genotyping
A total of 186 primers (110 SSR and 76
HvSSR) were used for genotyping. Primarily
both the bulks along with parents were
subjected to amplification using 186 primers.
Among those primers, which were showing
polymorphic along with parents were selected
for co-segregation analysis. Single marker
analysis was used to validate these markers.
Statistical analysis
Single marker analysis by Chi square analysis
with Yates correction was used for mapping
the QTLs associated with these root traits.
Results and Discussion
Significant variation for zinc deficiency
tolerance was noticed among recombinant
inbred lines under rainfed condition.
Screening was done in the field thirty days
after sowing, according to scoring pattern
given in the Standard Evaluation System
(SES) (Anonymous, 2002). The scoring was
done in the field when the differences for zinc
deficiency were very clear with lines
exhibiting a range of score from 1 to 9.
Among 271 RIL population, 11 lines were
highly tolerant to zinc deficiency with score of
1 with absolutely no symptom of deficiency.
36 lines exhibited score of 3, major portion of
this RIL lines i.e.172 lines exhibited score of
5, 48 lines were susceptible while, 4 lines
were highly susceptible. The above data is
showing continuous variation. Out of total 271
lines, 11 extreme susceptible lines (16, 78, 80,
89, 149, 156, 191, 220, 229, 259, 269) and 11
extreme tolerant lines (10, 26, 70.72, 74, 105,
106, 139, 140, 174, 245) were subsequently
used for further analysis.
Development of genotypic
HvSSR and SSR markers
data
using
RIL populations are genetically true-breeding
or homozygosity, stable and permanent and
well suited to QTL analysis. Further, RILs
undergoes multiple round of meiosis before
homozygosity is reached, there is a greater
chances for linked gene to recombine,
providing an opportunity for accurate
detection of QTLs (Burr and Burr, 1991;
McCouch and Doerge, 1995). After
standardization of the PCR protocol for SSR
assay, it was used for all subsequent studies.
BSA and co-segragtion analysis were used to
generate genotypic data using HvSSR and
2269
Int.J.Curr.Microbiol.App.Sci (2018) 7(11): 2267-2275
SSR markers. The markers were taken from
previously published rice genetic and
sequence maps (Singh et al., 2009; McCouch
et al., 2002; Temnykh et al., 2001).
Bulk Segregant Analysis (BSA)
In this analysis, DNA isolated from each
eleven tolerant lines and each eleven
susceptible lines was pooled to generate
tolerant bulk and susceptible bulks,
respectively. To form tolerant bulk, 50μl
diluted DNA (20ηg/μl) from all eleven
tolerant lines were pooled into one eppendorff
tube as suggested by Michelmore et al., 1991.
To form susceptible bulk, 50μl of diluted
DNA (20ηg/μl) from all eleven susceptible
lines were pooled into new eppendorf tube. In
this analysis, both the parents along with the
two bulks (tolerant and susceptible) were used
for amplification of genomic DNA through
PCR. PCR products were loaded on 5% PAGE
and electrophoresis was used to run and gels
were visualized and photographed by using
Gel Doc Unit (BIO RAD). Out of 186 HvSSR
and SSR markers, only 14 markers showed
parental
polymorphism
along
with
polymorphism in respective bulks. Only 7.5 %
(14 markers) out of 186 markers used
exhibited polymorphism. The low level of
polymorphism may be probably the indica x
indica cross used in this study. The level of
polymorphism was lower than that observed
for mapping parents in studies by Bernier et
al., (2007) using Vandana and Way Rarem as
parents. The relatively low recovery of
parental polymorphism under this study was
attributable to the narrow genetic variation
between the parents as both of these were
indica type and adopted to grow in the same
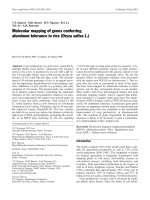
rice ecosystem. Gel pictures showing poly
morphic bulk segregation along with parents
for some primers were presented in plate 1.
Table.1 PCR mix for one reaction (Volume 20 l)
Reagent
1) Nanopure H2O
2) PCR buffer
3) MgCl2
3) dNTPs (Mix)
4) Primer (forward)
5) Primer (reverse)
6) Taq polymerase
7) DNA template
Total
Stock concentration
10 X
15 mM
10 mM
5 pmol.
5 pmol.
5 unit/ l
20 ηg/l
Volume (l)
13.3
2.0
0.5
1.0
0.5
0.5
0.2
2.0
20
Table.2 Temperature profile used for PCR amplification using microsatellite markers
Steps
1
2
3
4
5
6
Temperature (C)
95
94
55
72
72
4
Duration (min.)
5
1
1
2
10
24 hrs
2270
Cycles
1
34
1
1
Activity
Denaturation
Denaturation
Annealing
Extension
Final Extension
Storage
Int.J.Curr.Microbiol.App.Sci (2018) 7(11): 2267-2275
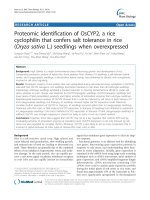
Table.3 Chi square (2) analysis with Yates correction
Markers
observed values for
susceptible lines
observed values for
tolerant lines
Chi square
value with
Yates
correction
A-type (a)
B-type (b)
A-type (c)
B-type (d)
HvSSR 01-80
11
0
2
9
12.03*
HvSSR 01-87
11
0
6
5
4.14*
HvSSR 01-89
8
0
6
5
3.00
HvSSR 03-40
7
2
3
7
2.78
HvSSR 04-35
8
1
2
4
2.94
HvSSR 05-31
8
0
2
5
6.60*
RM 17
7
1
5
6
2.01
RM 242
8
0
2
8
9.65*
RM 135
11
0
3
7
8.88*
RM 499
9
1
2
5
4.87*
RM 232
7
3
2
9
3.91*
RM 296
10
1
3
7
6.03*
RM 278
7
3
3
8
2.35
RM 26334
7
0
0
7
13.23*
Here (a), (b), (c), (d) are taken as variables in 2 x 2 contingency tables to substitute in the formula.
2 value at 0.05 level of probability.
2271
Int.J.Curr.Microbiol.App.Sci (2018) 7(11): 2267-2275
Plate.1 Gel images showing bulk segregant analysis
1
L A B C D
2
3
A B C
4
D A B
C D
5
A B C D A
6
B C D
7
8
A B C D A B C D A B C D
150 bp
100 bp
50 bp
ssr profile of primers used in BSA
9
L
A B C D
10
11
A B C D A B
12
13
14
15
C D A B C D A B C D A B C
16
D A B C D A B C D
150 bp
100 bp
50 bp
ssr profile of primers used in BSA
17
L
18
19
20
21
22
23
24
25
26
27
28
A B C D A B C D A B C D A B C D A B C D A B C D A B C D A B C D A B C D A B C D A B C D A B C D
150 bp
100 bp
50 bp
ssr profile of primers used in BSA
Primers:
L = Ladder
A = Danteshwari
B = Dagad deshi
C = Susceptible Bulk
D = Tolerant Bulk
1.
2.
3.
4.
5.
6.
7.
8.
HvSSR 04-26
HvSSR 04-32
HvSSR 04-35
HvSSR 04-38
HvSSR 04-39
HvSSR 04-42
HvSSR 05-12
HvSSR 05-13
2272
9.
10.
11.
12.
13.
14.
15.
16.
HvSSR 05-23
HvSSR 05-31
HvSSR 05-39
HvSSR 05-48
HvSSR 05-51
HvSSR 05-52
HvSSR 05-56
HvSSR 05-65
17.
18.
19.
20.
21.
22.
23.
24.
25.
26.
27.
28.
RM 17
RM 201
RM 242
RM 243
RM 256
RM 278
RM 281
RM 315
RM 410
RM 411
RM 444
RM 492
Int.J.Curr.Microbiol.App.Sci (2018) 7(11): 2267-2275
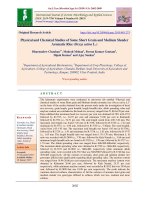
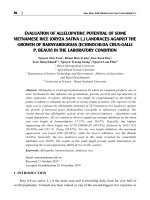
Plate.2 Gel images showing co-segregation analysis
HvSSR O1-80
L P1
SBL
P2
HvSSR 01-87
TBL
P1
SBL
P2
TBL
150 bp
100 bp
50 bp
ssr profile of HvSSR 01-80 and HvSSR 01-87 primers
HvSSR 05-31
L P1P2
SBL
RM 242
TBL
P1P2
SBL
TBL
150 bp
100 bp
50 bp
ssr profile of HvSSR 05-31 and RM242 primers
L = Ladder
P1 = Danteshwari
P2 = Dagaddeshi
SBL = Susceptible Bulk Lines
TBL = Tolerant Bulk Lines
Susceptible Bulk Lines (from left to right)
16,78,80,89,149,156,191,220,229,259,269
Tolerant Bulk Lines (from left to right)
10,26,70,72,74,105,106,139,140,174,245
Co-segregation analysis
The primers showing desired bulk segregation
were selected and subsequently used for PCR
amplification of each and every line of bulk
along with parents (co-segregation analysis)
using standardized PCR protocol. The PCR
products were loaded on 5% PAGE and run at
180 volts for about one hour. Then it was
stained with Ethidium bromide (EtBr) solution,
and visualized and photographed by using Gel
Doc Unit (BIO RAD). The bands observed were
designated as A, B and E where A represents
female parent like allele, B represent male
parent like allele, E represents other type allele
(which is not normally expected in RIL
population). Gel images of co-segregation
analysis for HvSSR 01-80, HvSSR 01-87,
HvSSR 05-31, RM 242 are presented in plate 2.
QTLs identification
For QTL identification selective genotyping
was done by selecting extreme phenotypic
classes. Test for QTL association was
performed by single marker approach. For
single marker analysis, chi-square test analysis
with Yates correction was followed to find out
2273
Int.J.Curr.Microbiol.App.Sci (2018) 7(11): 2267-2275
significant and non-significant association
between trait and markers. Results of chi-square
test analysis are presented in Table 3. Since the
population used in the study includes the fixed
homozygous lines in F12 generation therefore
theoretical expected ratio between A and B
banding pattern of lines should be 1:1 as per
Hardy Weinberg equilibrium (Mendelian
segregation without any linkage). Any
significant deviation from this ratio indicates
the disequilibrium of banding pattern.
This disequilibrium is expected if the marker is
closely located to the gene of interest, as the
complete set of population was selected for one
trait in its extreme form. Chi square(2) value
was deviated from the normal ratio and found
significant from table value for nine primers
among total fourteen primers showing bulk
segregation analysis polymorphism, they are
HvSSR 01-80, HvSSR 01-87, HvSSR 05-31,
RM 242, RM 135, RM 499, RM 232, RM 296
and RM 26334. These are the nine primers
deviated from normal Mendelian segregation
ratio and they are supposed to be linked with
the zinc deficiency tolerance.
HvSSR 05-31 primer present on chromosome 5
located at 13.46cM contributing zinc deficiency
tolerance QTL, did not matched with the region
obtained for zinc deficiency tolerance to
Avendano (2000) showing that 61.9% variation
with LOD value 3.45 on chromosome 5
between marker interval RM 164 and RM 87.
RM242 and RM296 primers present on
chromosome 9 at locus 73.3cM and 20.4cM
respectively were also found to be linked with
QTLs for zinc deficiency tolerance. Ramya et
al., (2010) reported that the region between
RM160 – RM215 on chromosome 9,
contributing to maximum root depth under both
control and drought stress condition. Primers
RM242 and RM296 linked with zinc deficiency
tolerance on chromosome 9 lying between
marker interval RM160 – RM215. In present
investigation, according to root scan data
obtained from samples collected from field
condition showing tolerance had more root
length and root volume (unpublished data),
which indicated that zinc deficiency tolerance
character is directly or indirectly associated
with the root length and root volume.
Traits associated with markers were observed
from gramene data base (www.gramene.org)
and cerealab database (www.cerealab.org),
which also revealed that RM242 is associated
with more root related traits. Mathews (2005)
reported that available zinc was maximum at
the surface and decreased with depth. Based on
this, in the present investigation, resistant lines
having more root length and volume can be
claimed to get corresponding nutrients very
easily than the lines having less root length and
volume.
From the above discussion, it was concluded
that QTLs are associated with nine markers
(HvSSR 01-80, HvSSR 01-87, HvSSR 05-31,
RM242, RM135, RM499, RM232, RM296 and
RM26334) for zinc deficiency tolerance, among
them RM242 is the marker that is associated
with root length and volume (Ramya et al.,
2006.) and zinc deficiency tolerance.
References
Anonymous, 2002. Standard Evaluation
System. IRRI. pp. 1-56
Avendano, B.S. 2000. Tagging high content in
the grain and zinc deficiency tolerance
genes in rice (Oryza sativa L.) using
simple sequence repeats (SSR). Thesis
submitted to university of Philippines at
Las banos.
Bernier, J., Kumar, A., Ramiah, V., Spaner, D.
and Atlin, G. 2007. A large effect of QTL
for grain yield under reproductive stage
drought stress in upland rice. Crop Sci.,
47: 505-518.
Burr, B. and Burr, F.A. 1991. Recombinant
inbreds for molecular mapping in maize.
Trends in Genet., 7: 55-60.
Castro, R.U. 1977.Zinc deficiency in rice:A
review of research at the International
2274
Int.J.Curr.Microbiol.App.Sci (2018) 7(11): 2267-2275
Rice
Research
Institute.I
RRI
res.pap.ser.9, pp. 1-12.
Mathews, D.V. 2005. Response of rice to soil
fertility constraints and Bio-fertilizers in
coastal alluvial soil of Karnataka. M.Sc.
Thesis, UAS, Dharwad.
McCouch, S.R. and Doerge, R.W. 1995. QTL
mapping in rice. TIG., 11(12): 482-487.
McCouch, S.R., Teytelman, L., Xu, Y., Lobos,
K.B., Clare, K., Walton, M., Fu, B.,
Maghirang, R., Li, Z., Xing, Y., Zhang,
Q., Kono, I., Yano, M., Fjellstrom, R.,
DeClerck, G., Schneider, D., Cartinhour,
S., Ware, D. and Stein, L. 2002.
Development and mapping of 2240 new
SSR markers for rice (Oryza sativa L.).
DNA Res., 9: 257-279.
Michelmore, R. W., Paran, I., and Kesseli, R. V.
1991. Identification of markers linked to
disease-resistance genes by bulked
segregant analysis: A rapid method to
detect markers in specific genomic
regions by using segregating populations.
Proc. Natl. Acad. Sci. USA, 88: 98289832.
Nene, Y.L. 1966. Symptoms, cause and control
of Khaira disease of paddy. Bull. Indian
Phytopathol Soc. 3: 97–191.
Neue, H.U. and Lantin, R.S. 1994.
Micronutrient toxicities and deficiencies
in rice. In AR Yeo, TJ Flowers, eds, Soil
mineral stresses: approaches to crop
improvement. Springer-Verlag, Berlin,
Germany, pp. 175-200.
Quijano-Guerta, C., Krik, G.J.D, Portugal, A.M,
Bartolome, V. and Mclaren, G.C. 2002.
Tolerance of rice germplasm to Zn
deficiency. Field Crops Res. 76: 123-130.
Ramya, M., Raveendran, M., Sathiyamoorthy,
S. and Ramalingam, J. 2010. In silico
analysis of drought tolerance genes in
rice. Int. J. of Bio. & Med. Res., 1(3): 3640.
Shalini, P. and Tulasi, T. 2008. Production
potential and nutrient use efficiency of
basmati rice (Oryza sativa L.) under
integrated nutrient management. Green
Farming, 1(9): 11-13.
Singh, B., Natesan, S.K.A., Singh, B.K. and
Usha, K. 2003. Improving Zn efficiency
of cereals under Zn deficiency. Curr. Sci.,
88: 36-44.
Singh, H., Deshmukh, R.K., Singh, A., Singh,
A.K., Gaikwad, K., Gaikwad, T., Sharma,
T.R., Mohapatra, T. and Singh, N.K.
2009. Highly variable SSR markers
suitable for Rice genotyping using
Agarose gels. Mol. Breed., 25(2): 359364.
Tanaka, A. and Yoshida. S. 1970. Nutritional
disorders of the rice plant in Asia. Int.
Rice Res. Inst. Tech. Bull., 10: 31-40.
Temnykh, S., DeClerk, G., Lukashova, A.,
Lipovich, L., Cartinhour, S. and
McCouch, S.R. 2001. Computational and
experimental analysis of microsatellites in
rice (Oryza sativa): frequency, length
variation, transposon associations and
genetic marker potential. Genome Res.,
11: 1441-1452.
www.cerealab.org
www.gramene.org
Yoshida, S. and Tanaka, A. 1969. Zinc
deficiency of the rice plant in calcareous
soils. Soil Sci. Plant Nutr., 15: 75-80.
How to cite this article:
Elicherla Siva Sankar Reddy, S.B. Verulkar and Saxena, R.R. 2018. Molecular Mapping of QTLs
for Zinc Deficiency Tolerance in Rice (Oryza sativa L.). Int.J.Curr.Microbiol.App.Sci. 7(11): 22672275. doi: />
2275