Soil physical properties as influenced with protected and conventional vegetable production system in district Kangra of Himachal Pradesh
Bạn đang xem bản rút gọn của tài liệu. Xem và tải ngay bản đầy đủ của tài liệu tại đây (555.19 KB, 14 trang )
Int.J.Curr.Microbiol.App.Sci (2018) 7(11): 3503-3516
International Journal of Current Microbiology and Applied Sciences
ISSN: 2319-7706 Volume 7 Number 11 (2018)
Journal homepage:
Original Research Article
/>
Soil Physical Properties as Influenced with Protected and Conventional
Vegetable Production System in District Kangra of Himachal Pradesh
Shabnam* and Sanjay K. Sharma
Department of Soil Science, CSKHPKV, Palampur Himachal Pradesh, India
*Corresponding author
ABSTRACT
Keywords
Protected,
conventional and
vegetables
Article Info
Accepted:
04 October 2018
Available Online:
10 November 2018
Protected cultivation is gaining momentum especially for vegetable cultivation in
Himachal Pradesh. Therefore the present study was undertaken to assess the soil quality
inside polyhouses vis a vis under conventional cultivation so as to ascertain the effect of
intensive cropping and the management practices being followed by farmers under these
two systems on soil physical properties. The main objective of this study was to assess the
effect of conventional and protected systems of farming on soil physical parameters.
Texture across the various sites varied from sandy loam to clay loam. Mean of two years
(2015 and 2016) revealed comparatively lower bulk density inside protected cultivation
(1.12 Mg m-3) as compared to conventional system (1.24 Mg m-3). There were as such no
differences were observed in particle density. However, porosity and water holding
capacity differ inside protected and conventional system of production. Considering
overall mean of mean weight diameter (MWD) it was observed higher inside protected
system (1.49 mm) as compared to conventional system (1.40 mm).
Introduction
Productivity and the sustainability of any
production system not only depend upon the
management practices but also on the
environment as well as on the soil quality. An
agricultural soil with good quality promotes
and sustains good agricultural productivity
with less environmental impact and possesses
utmost physical, chemical and biological
attributes to fulfill these requirements
(Reynolds et al., 2009). Soil quality has been
defined as “the capacity of specific kind of
soil to function within ecosystem and land use
boundaries to sustain biological productivity,
maintain environmental quality and sustain
plant, animal and human health” (Doran and
Parkin, 1994). To assess the soil quality we
have to consider various physical, chemical
and biological attributes referred to as
indicators. These indicators may directly
monitor the soil or monitor the outcomes that
are affected by the soil. India is the second
largest producer of vegetables in the world,
next to China. It produces 167.1 million
tonnes of vegetables from an area of 9.5
million ha (NHB, 2015-16) which is however,
much less than the actual requirement for
providing balanced diet to every individual.
To cope up with the burgeoning population,
3503
Int.J.Curr.Microbiol.App.Sci (2018) 7(11): 3503-3516
the total production of vegetables in India
needs to be raised to at least 250 million
tonnes by 2024-25. It means we have to
increase the productivity vertically from the
limited land resources as the per capita land
availability is decreasing. In general, the
farmers are still practicing less intensive and
remunerative farming system under open field
cultivation (Kokate et al., 2012). Besides,
there are many constraints with respect to
climatic
conditions
viz.,
moisture,
temperature, sunshine hours, wind velocities,
humidity and weather vagaries, coupled with
nutrient deficiencies, excessive weed growth
and insect pests attack leading to poor
productivity. To overcome these constraints,
“protected cultivation” a specialized high-tech
cultivation system under the polyhouses is
being emphasized for the last two decades.
Protected vegetable cultivation has proven to
be a good farming practice in various parts of
different countries and has been developed
rapidly during recent years because of the
comparatively higher economic benefits
In Himachal Pradesh too, protected vegetable
cultivation has gained quite a good momentum
particularly, for vegetables and commercial
crops due to higher productivity, intensive
cropping and assured income. The state
government is also emphasizing protected
farming through Horticultural Technology
Mission and Pandit Deen Dayal Kisan
Bagwan Samridhi Yojna. A large number of
polyhouses has been constructed in the state
occupying an area of about 223.2 ha
(Chaudhary, 2016) and the indeterminate
varieties of tomato, coloured capsicum and
cucumber etc. have particularly emerged more
popular among the farmers. The principle of
protected cultivation is optimum utilization of
inner space and to harness the off-season
advantage. However, intensive cultivation
coupled with very high use of specific inputs
under protected conditions may prove
detrimental to soil and produce quality in the
long run due to over exploitation of native
reserves of the nutrients. Sustainability of
intensive agriculture system is linked to
maintenance or enhancement of soil quality
(Benbi and Saroa, 2012). The intensive use of
chemical fertilizers and other inputs, air,
moisture and temperature manipulations and
higher productivity vis a vis nutrient removal
under protected cultivation may however,
affect the physical, chemical and biological
properties of soil i.e. „the soil quality‟.
In the present scenario of vegetable production
under protected conditions in Himachal
Pradesh, there is intensive cultivation of
vegetables and it becomes imperative to assess
the impact of prevalent management practices
with respect to use of fertilizers and other
inputs on soil quality for sustained production.
The changes in soil quality indicate, whether
the management practices being adopted are
sustainable or not. Owing to vast differences
in management practices, growth conditions
and the productivity of the vegetables, the
differences in soil quality may be expected
between the protected and open field
cultivation.
Materials and Methods
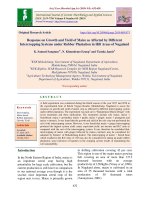
The study sites were located in between
31°59.700‟ N and 76°39.033‟ E to 32°08.500
N and 76°25.010‟E. For the present
investigation twenty five farmers (five farmers
per block) growing vegetables for at least five
years under the protected (polyhouse) as well
as conventional (open conditions) from
Kangra district were selected randomly from
five blocks viz; Baijnath, Bhedu-Mahadev,
Bhawarna, Kangra and Dharamshala. The
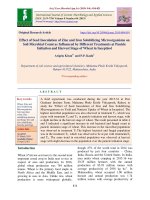
details of the selected sites are depicted in
figure.1. After this a general survey of the
selected farmers was carried out for
assortment of necessary information about
cultivation practices, cropping patterns and
problems prevailing in the polyhouses
3504
Int.J.Curr.Microbiol.App.Sci (2018) 7(11): 3503-3516
growing vegetables. Capsicum was the
predominant crop in most of the polyhouses.
However cucumber, tomato, beans, coriander
and cauliflower were also grown in some
polyhouses. All the polyhouses selected for
present study were naturally ventilated. These
polyhouse didn‟t have any environmental
control system except for the provision of
adequate ventilation and fogger system to
prevent basically the damage of weather
aberrations and other natural agents.
production system sand, silt and clay varied
from 41 to 60, 16 to 36 and 15 to 34 per cent,
respectively. Because texture does not change
much therefore, samples for this parameter
were analysed only once i.e. those collected
during 2015. Comparatively higher sand
percentage under protected conditions at some
sites (Nora, Suri, Bodda, Arla-Khas, Samloti,
Tang and Lower-Bagli) might be due to
addition of sand by the farmers to alter
texture, for making it more suitable for
vegetable production.
Results and Discussion
Bulk Density (BD)
Physical parameters
The physical indicators for assessing soil
quality comprised texture, bulk density (BD),
particle density (PD), porosity, water holding
capacity and water stable aggregates of soils.
Soil texture
Soil texture refers to weight percentage of
sand (0.05 to 2 mm), silt (0.002 to 0.05 mm)
and clay (<0.002 mm). Soil texture is one of
the most stable attributes of the soil which can
only be modified slightly by the practices that
cause mixing of different layers. Soil texture
has an important effect on water and nutrient
holding capacity. In general, sandy loam to
loam texture is considered good for optimum
crop growth because such soils allow easy
movement of water, air and nutrients. In the
present study soil texture under different sites
varied from sandy loam to clay loam; however
sandy loam was the most dominant texture
under protected and conventional vegetable
cultivation (Table 2). Chander et al., (2014)
also reported almost similar status of soil
texture in vegetable growing soils of subhumid and wet-temperate zones of Himachal
Pradesh. Sand, silt and clay contents under
protected system in the Kangra district ranged
from 43 to 62, 16 to 36 and 12 to 34 per cent,
respectively. While for conventional vegetable
Generally, bulk density increases with
increasing sand and rock content and
decreases with addition of organic matter. The
roots grow well in soils with low bulk
densities whereas root growth begins to
decline significantly at bulk density above
1.70 Mg m-3. Data in Table 3 revealed only
slight changes in bulk density during the study
period under two different management
practices (protected and conventional). Bulk
density during 2015 varied from 1.09 to 1.37
Mg m-3 under protected environment, and for
the same year bulk density under open
environment ranges from 1.13 to 1.42 Mg m-3.
Average bulk density for same year was found
comparatively lower (1.21±0.06 Mg m-3)
under protected system compared to
conventional system (1.24±0.05 Mg m-3).
However not much change in overall bulk
density was observed both, under protected as
well as conventional system during 2016 in
comparison to 2015. Overall average bulk
density during 2016 varied from 1.08 to 1.36
Mg m-3 under protected system, while under
conventional system it ranged from 1.15 to
1.41 Mg m-3. Based on the mean values of two
years, it further revealed that among different
blocks under protected system of vegetable
production, Baijnath and Bhedu-Mahadev
recorded higher average bulk density (1.22
Mg m-3) while, Dharamshala block recorded
3505
Int.J.Curr.Microbiol.App.Sci (2018) 7(11): 3503-3516
the lowest average bulk density (1.19 Mg m-3).
Conventional vegetable production system had
average bulk density values of 1.27, 1.26,
1.24, 1.22 and 1.23 Mg m-3 at Baijnath,
Bhedu-Mahadev, Bhawarna, Kangra and
Dharamshala blocks, respectively. Similar
range of bulk density was also observed by
Kyandiah (2012) for soils of Himachal
Pradesh. In general, if values of bulk density
are less than 1.50 Mg m-3, then it is taken as
low. Since most of the sites had low bulk
density, the soils were less compact and
therefore, good for the production of
vegetables. Most of the sites under
conventional vegetable production had higher
bulk density values as compared to protected
conditions which might be attributed to higher
organic carbon contents observed under
protected field conditions the role of intensive
management (tillage operations, frequent
applications of higher amount of organic
manures and chemical fertilizers) and
consequently better microbial activities and
soil aggregations are the other reasons for the
lower values of bulk density under protected
environment as compared to open one as
observed in the present study.
Farmers added more organic matter (FYM,
vermicompost) inside polyhouse condition in
comparison to open field conditions at most of
the sites which might be also one of the
factors for lower bulk density values under
protected conditions. Herencia et al., (2011)
also reported a decrease in bulk density in
sites where practice of addition of FYM has
been done under protected and conventional
production systems.
second year (2016), and were analysed for this
property just to confirm the results for the
previous year. As expected, no such variation
was observed in particle density values for
each of the locations under protected as well
as conventional systems of agriculture. The
mean particle density of two years among
different sites varied between 2.11 to 2.52 Mg
m-3 under protected system of vegetable
production with overall mean of 2.37±0.11
Mg m-3. Among different blocks which were
selected for the present study under protected
system of vegetable production lowest particle
density was observed in Baijnath (2.28 Mg m3
) followed by Bhawarna (2.34 Mg m-3) and
Dharamshala blocks (2.39 Mg m-3). BheduMahadev soils had higher particle density
among all the blocks (2.42 Mg m-3).
Average particle density under conventional
system of vegetable production varied from
2.14 to 2.51 Mg m-3 with overall mean of all
locations was 2.37±0.10 Mg m-3. The mean
PD of all locations in a block was observed
lowest in Baijnath (2.31 Mg m-3) followed by
Bhawarna (2.35 Mg m-3) and Kangra (2.38
Mg m-3), while the highest was recorded for
Dharamshala block (2.41 Mg m-3). The
differences in particle density among various
locations irrespective of the cultivation
conditions might be due to differences in the
parent material. Slightly lower values of
particle density under protected condition
might be due to binding of organic matter on
various separates of soil. The reason behind
slight variation in particle density under
protected and conventional conditions may
also be attributed to the management practices
followed by farmers (Hillel, 1980).
Particle Density (PD)
Porosity
The data on the status of particle density under
protected and conventional conditions have
been enumerated in Table 4. Though the
particle density is considered one of the static
properties, the samples collected during
Porosity is the ratio of total volume of pore
spaces to the total soil column volume and is
an index of relative pore volume in a soil.
3506
Int.J.Curr.Microbiol.App.Sci (2018) 7(11): 3503-3516
The status of soil porosity for different sites
under protected and conventional conditions
is presented in the Table 5. Data depicted that
during 2015 porosity ranged from 40.4 to 55.1
per cent under protected conditions, while it
varied from 40.3 to 53.9 per cent under
conventional vegetable production system
with overall mean values across all the
locations as 48.8±3 and 47.4±2.9 per cent,
respectively. Very slight variations were
observed in porosity during 2016 over the
values computed during 2015 among different
sites both under protected as well as
conventional system of vegetable production.
Among different blocks selected for present
study under protected system of vegetable
production, the highest mean porosity in a
block as a whole, was observed in Kangra
block (50.2%) while, the lowest in Baijnath
(46.4%). Similarly, mean porosity among
different blocks as a whole under
conventional production of vegetables was
worked out to 45, 47.8, 47.1, 48.6 and 49 per
cent
for
Baijnath,
Bhedu-Mahadev,
Bhawarna, Kangra and Dharamshala blocks,
respectively. Overall mean porosity values
were higher under protected conditions during
both the years.
Since most of the polyhouse‟s surface soil
exhibited low bulk and particle densities in
comparison to samples from conventionally
cultivated fields therefore, comparatively
higher porosity values under polyhouse are as
per expectation.
Water Holding Capacity (WHC)
Data pertaining to water holding capacity are
given in Table 6. Perusal of data in Table 6
revealed average water holding capacity for
both the years was higher under protected
environment as compared to conventional
system of vegetables production. It varied
between 46.2 to 60.3 per cent during 2015
and between 47.2 to 60.2 per cent during
2016 under the protected conditions. The
overall mean of all the locations during 2015
and 2016 for water holding capacity were
53.6±3.2 and 54±3 per cent, respectively.
Among various sites under protected system
highest average water holding capacity was
found in Bhedu-Mahadev block (54.8 %)
followed by Kangra (54.4%) while the lowest
was recorded at Baijnath (52.8%).
Under conventional system of vegetable
production, water holding capacity across
different sites varied from 44.1 to 58.4 per
cent and 44.3 to 56.2 per cent during 2015
and 2016, respectively. While, the overall
mean water holding capacity across all the
locations was 51.4±3.1 and 51.3±2.8 per cent
for 2015 and 2016, respectively.
Table.1 Methods used for analysis of physical parameters
Parameter
Texture
Water holding capacity
Bulk density
Particle Density
Method employed
International pipette method
Keen box method
Core sampler method
Pycnometer method
Porosity
Empirical method
Aggregate analysis
Wet sieving method
3507
Reference
Piper (1966)
Piper (1950)
Blake and Hartge (1986)
Gupta
and
Dhakshinamoorthy
(1980)
Gupta
and
Dhakshinamoorthy
(1980)
Yoder (1936)
Int.J.Curr.Microbiol.App.Sci (2018) 7(11): 3503-3516
Table.2 Mechanical separates (%) and soil texture under protected and conventional cultivation
in district Kangra
Sr.
No.
Sites
Protected
Sand
Silt
Conventional
Texture
Clay
Sand
Silt
Clay
48
55
55
56
50
53
22
26
26
29
29
26
30
19
19
15
21
21
Texture
Baijnath
1.
2.
3.
4.
5.
Vikasnagar
Lower-Kunsal
Nora Garh
Nora
Upper-Kunsal
Mean
6.
7.
8.
9.
10.
Suri
Dheera
Panapar Kholi
Bodda
Mansimbal
Mean
11.
12.
13.
14.
15.
Arla Khas
Chachiyan
Balla
Nagri
Dhakrehar
Mean
48
58
56
62
54
56
47
56
43
60
60
55
58
57
58
54
46
53
24
23
25
25
28
25
35
28
23
28
25
26
24
27
26
16
36
30
28
scl
19
sl
19
sl
13
sl
18
l
19
Bhedu-Mahadev
18
l
16
sl
34
cl
12
sl
15
sl
19
Bhawarna
18
16
16
30
18
17
42
56
42
53
60
50
36
28
24
28
25
30
22
16
34
19
15
21
scl
sl
sl
sl
l
l
sl
cl
sl
sl
-
sl
sl
sl
scl
l
-
53
54
58
54
46
53
31
28
26
16
36
27
16
18
16
30
18
20
sl
sl
sl
scl
l
-
20
scl
17
sl
31
scl
25
scl
25
scl
24
Dharamshala
54
56
48
49
46
51
26
28
23
26
25
26
20
16
29
25
29
24
scl
sl
scl
scl
scl
-
Kangra
16.
17.
18.
19.
20.
Kot kwal-II
Kot kwal-I
Zamanabad
Thanpuri
Samloti
Mean
21.
22.
23.
24.
25.
Jhikli Ichi
Lower-Bagli
Upper-Bagli
Tang
Dadh
Mean
Overall Range
Overall Mean ± SD
54
57
46
49
52
52
26
26
23
26
23
25
49
59
57
44
59
52
43-62
34
24
26
28
25
28
16-36
17
17
17
28
16
20
12-34
l
sl
sl
cl
sl
sl-cl
41
55
53
41
54
47
41-60
36
26
28
31
28
30
16-36
23
19
19
28
18
23
15-34
l
sl
sl
cl
sl
sl-cl
54±5.2
26±3.9
20±5.6
-
51±5.1
27±4.1
21±5.2
-
Note: scl=sandy clay loam; sl=sandy loam; cl=clay loam; l=loam
3508
Int.J.Curr.Microbiol.App.Sci (2018) 7(11): 3503-3516
Table.3 Bulk density (Mg m-3) under protected and conventional cultivation in district Kangra
Sr.
No.
Sites
Protected
2015
Conventional
2016
Mean
2015
2016
Mean
Baijnath
1.
2.
3.
4.
5.
Vikasnagar
Lower-Kunsal
Nora Garh
Nora
Upper-Kunsal
Mean
1.17
1.24
1.17
1.37
1.18
1.23
1.16
1.17
1.23
1.24
1.17
1.17
1.36
1.37
1.18
1.18
1.22
1.22
Bhedu-Mahadev
1.21
1.29
1.23
1.42
1.22
1.27
1.20
1.28
1.21
1.41
1.24
1.27
1.21
1.29
1.22
1.42
1.23
1.27
6.
7.
8.
9.
10.
Suri
Dheera
Panapar Kholi
Bodda
Mansimbal
Mean
1.17
1.26
1.17
1.29
1.24
1.23
1.16
1.24
1.16
1.27
1.24
1.21
1.17
1.25
1.17
1.28
1.24
1.22
Bhawarna
1.21
1.29
1.19
1.31
1.27
1.25
1.21
1.29
1.19
1.32
1.27
1.26
1.21
1.29
1.19
1.32
1.27
1.26
11.
12.
13.
14.
15.
Arla Khas
Chachiyan
Balla
Nagri
Dhakrehar
Mean
1.26
1.23
1.20
1.17
1.16
1.20
1.25
1.23
1.20
1.18
1.15
1.20
1.26
1.23
1.20
1.18
1.16
1.20
Kangra
1.28
1.25
1.22
1.20
1.24
1.24
1.29
1.26
1.23
1.20
1.25
1.25
1.29
1.26
1.23
1.20
1.25
1.24
16.
17.
18.
19.
20.
Kot kwal-II
Kot kwal-I
Zamanabad
Thanpuri
Samloti
Mean
1.19
1.23
1.17
1.14
1.26
1.20
1.19
1.21
1.15
1.16
1.26
1.19
1.19
1.22
1.16
1.15
1.26
1.20
Dharamshala
1.24
1.22
1.14
1.24
1.26
1.22
1.25
1.24
1.16
1.23
1.25
1.23
1.25
1.23
1.15
1.24
1.26
1.22
Jhikli Ichi
Lower-Bagli
Upper-Bagli
Tang
Dadh
Mean
Overall Range
1.25
1.24
1.17
1.09
1.22
1.19
1.09-1.37
1.27
1.22
1.17
1.08
1.21
1.19
1.08-1.36
1.26
1.23
1.17
1.09
1.22
1.19
1.09-1.37
1.27
1.24
1.24
1.13
1.24
1.22
1.13-1.42
1.29
1.26
1.21
1.15
1.24
1.23
1.15-1.41
1.28
1.25
1.23
1.14
1.24
1.23
1.14-1.42
Overall Mean ± SD
1.21±0.06
1.20±0.06
1.21±0.06
1.24±0.06
1.25±0.05
1.24±0.05
21.
22.
23.
24.
25.
3509
Int.J.Curr.Microbiol.App.Sci (2018) 7(11): 3503-3516
Table.4 Particle density (Mg m-3) under protected and conventional cultivation in district Kangra
Sr.
No.
Sites
Protected
2015
Conventional
2016
Mean
2015
2016
Mean
Baijnath
1.
2.
3.
4.
5.
Vikasnagar
Lower-Kunsal
Nora Garh
Nora
Upper-Kunsal
Mean
2.11
2.36
2.24
2.30
2.39
2.28
2.11
2.11
2.36
2.36
2.24
2.24
2.30
2.30
2.39
2.39
2.28
2.28
Bhedu-Mahadev
2.14
2.39
2.22
2.38
2.43
2.31
2.14
2.39
2.20
2.38
2.44
2.31
2.14
2.39
2.21
2.38
2.44
2.31
6.
7.
8.
9.
10.
Suri
Dheera
Panapar Kholi
Bodda
Mansimbal
Mean
2.23
2.46
2.52
2.41
2.49
2.42
2.23
2.46
2.53
2.41
2.47
2.42
2.23
2.46
2.53
2.41
2.48
2.42
Bhawarna
2.26
2.51
2.46
2.37
2.41
2.40
2.26
2.51
2.46
2.37
2.42
2.40
2.26
2.51
2.46
2.37
2.42
2.40
11.
12.
13.
14.
15.
Arla Khas
Chachiyan
Balla
Nagri
Dhakrehar
Mean
2.27
2.34
2.47
2.20
2.44
2.34
2.27
2.33
2.46
2.20
2.44
2.34
2.27
2.34
2.47
2.20
2.44
2.34
Kangra
2.27
2.31
2.48
2.20
2.47
2.35
2.27
2.31
2.48
2.20
2.47
2.35
2.27
2.31
2.48
2.20
2.47
2.35
16.
17.
18.
19.
20.
Kot kwal-II
Kot kwal-I
Zamanabad
Thanpuri
Samloti
Mean
2.49
2.36
2.37
2.34
2.44
2.40
2.48
2.36
2.38
2.34
2.44
2.40
2.49
2.36
2.38
2.34
2.44
2.40
Dharamshala
2.44
2.38
2.32
2.32
2.44
2.38
2.44
2.38
2.32
2.32
2.44
2.38
2.44
2.38
2.32
2.32
2.44
2.38
Jhikli Ichi
Lower-Bagli
Upper-Bagli
Tang
Dadh
Mean
Overall Range
2.44
2.51
2.14
2.43
2.43
2.39
2.11-2.52
2.44
2.51
2.15
2.43
2.43
2.39
2.15-2.53
2.44
2.51
2.15
2.43
2.43
2.39
2.11-2.53
2.47
2.49
2.19
2.45
2.43
2.41
2.14-2.51
2.47
2.49
2.19
2.45
2.43
2.41
2.14-2.51
2.47
2.49
2.19
2.45
2.43
2.41
2.14-2.51
Overall Mean ± SD
2.37±0.11
2.37±0.11
2.37±0.11
2.37±0.10
2.37±0.10
2.37±0.10
21.
22.
23.
24.
25.
3510
Int.J.Curr.Microbiol.App.Sci (2018) 7(11): 3503-3516
Table.5 Porosity (%) under protected and conventional cultivation in district Kangra
Sr.
No.
Sites
Protected
2015
Conventional
2016
Mean
2015
2016
Mean
Baijnath
1.
2.
3.
4.
5.
Vikasnagar
Lower-Kunsal
Nora Garh
Nora
Upper-Kunsal
Mean
44.5
47.5
47.8
40.4
50.6
46.2
45.0
44.8
47.9
47.7
47.8
47.8
40.9
40.7
50.6
50.6
46.5
46.4
Bhedu-Mahadev
43.5
46.0
44.6
40.3
49.8
44.9
43.9
46.4
45.0
40.8
49.2
45.1
43.7
46.2
44.8
40.5
49.5
45.0
6.
7.
8.
9.
10.
Suri
Dheera
Panapar Kholi
Bodda
Mansimbal
Mean
47.5
48.8
53.6
46.5
50.2
49.4
48.0
49.6
54.2
47.3
49.8
49.8
47.8
49.2
53.9
46.9
50.0
49.6
46.5
48.6
51.6
44.7
47.3
47.8
46.5
48.6
51.6
44.3
47.5
47.8
46.5
48.6
51.6
44.5
47.4
47.8
44.7
47.3
51.3
46.6
52.7
48.6
43.6
45.9
50.8
45.5
49.8
47.2
43.2
45.5
50.4
45.5
49.4
46.9
43.4
45.7
50.6
45.5
49.6
47.1
52.0
52.1
48.7
48.3
51.7
51.2
50.4
50.9
48.4
48.4
50.3
50.2
Dharamshala
49.2
48.7
50.9
46.6
48.4
48.7
48.8
47.9
50.0
47.0
48.8
48.5
49.0
48.3
50.4
46.8
48.6
48.6
48.6
50.2
43.4
53.9
49.0
49.1
40.3-53.9
47.8
49.4
44.7
53.1
49.0
48.9
40.8-53.1
48.2
49.8
44.1
53.5
49.0
49.0
40.5-53.5
47.4±2.9
47.3±2.7
47.4±2.8
Bhawarna
11.
12.
13.
14.
15.
Arla Khas
Chachiyan
Balla
Nagri
Dhakrehar
Mean
44.5
47.4
51.4
46.8
52.5
48.6
44.9
47.2
51.2
46.4
52.9
48.6
Kangra
16.
17.
18.
19.
20.
21.
22.
23.
24.
25.
Kot kwal-II
Kot kwal-I
Zamanabad
Thanpuri
Samloti
Mean
Jhikli Ichi
Lower-Bagli
Upper-Bagli
Tang
Dadh
Mean
Overall Range
Overall Mean ± SD
52.2
47.9
50.6
51.3
48.4
50.1
48.8
50.6
45.3
55.1
49.8
50.0
40.4-55.1
48.0
51.4
45.6
55.6
50.2
50.3
40.9-55.6
48.4
51.0
45.5
55.3
50.0
50.1
40.7-55.3
48.8±3
49±3
48.9±3
3511
Int.J.Curr.Microbiol.App.Sci (2018) 7(11): 3503-3516
Table.6 Water holding capacity (%) under protected and conventional cultivation in district
Kangra
Sr.
No.
Sites
Protected
2015
2016
Conventional
Mean
2015
2016
Mean
Baijnath
1.
2.
3.
4.
5.
Vikasnagar
Lower-Kunsal
Nora Garh
Nora
Upper-Kunsal
Mean
52.4
56.1
52.2
46.2
55.1
52.4
54.2
53.3
57.1
56.6
53.1
52.7
47.2
46.7
54.0
54.6
53.1
52.8
Bhedu-Mahadev
49.3
49.1
48.3
44.1
51.4
48.4
49.2
50.2
49.1
44.3
51.3
48.8
49.3
49.7
48.7
44.2
51.4
48.6
6.
7.
8.
9.
10.
Suri
Dheera
Panapar Kholi
Bodda
Mansimbal
Mean
53.2
54.4
58.1
51.4
55.2
54.5
54.1
55.0
58.3
52.6
56.0
55.2
53.6
54.7
58.2
52.0
55.6
54.8
52.1
54.4
56.4
48.2
49.3
52.1
53.2
53.1
56.2
47.2
49.5
51.8
52.7
53.8
56.3
47.7
49.4
52.0
48.3
51.2
56.2
51.2
58.0
53.0
47.2
49.1
54.1
49.2
52.3
50.4
47.3
48.2
55.4
49.5
53.5
50.8
47.3
48.7
54.8
49.4
52.9
50.6
58.0
58.2
52.5
52.4
54.0
53.7
56.2
56.7
51.0
51.2
54.3
54.4
Dharamshala
54.5
53.5
53.4
51.0
53.0
53.1
53.2
52.4
52.1
52.2
53.4
52.7
53.9
52.9
52.8
51.6
53.2
52.9
Bhawarna
11.
12.
13.
14.
15.
Arla Khas
Chachiyan
Balla
Nagri
Dhakrehar
Mean
48.0
51.0
56.1
51.1
58.0
52.8
48.6
51.4
56.2
51.3
58.0
53.1
Kangra
16.
17.
18.
19.
20.
Kot kwal-II
Kot kwal-I
Zamanabad
Thanpuri
Samloti
Mean
58.4
52.2
53.4
57.1
51.4
54.5
Jhikli Ichi
Lower-Bagli
Upper-Bagli
Tang
Dadh
Mean
Overall Range
52.0
54.1
48.2
60.3
53.2
53.6
46.2-60.3
52.0
55.0
49.4
60.2
54.0
54.1
47.2-60.2
52.0
54.6
48.8
60.3
53.6
53.8
46.7-60.3
52.2
54.5
48.0
58.4
52.2
53.1
44.1-58.4
52.6
52.1
49.2
56.2
52.1
52.4
44.3-56.2
52.4
53.3
48.6
57.3
52.2
52.7
44.2-57.3
Overall Mean ± SD
53.6±3.2
54±3.0
53.8±3.1
51.4±3.1
51.3±2.8
51.3±2.9
21.
22.
23.
24.
25.
3512
Int.J.Curr.Microbiol.App.Sci (2018) 7(11): 3503-3516
Table.7 Mean weight diameter (mm) under protected and conventional cultivation in district
Kangra
Sr. No.
Sites
Protected
2015
Conventional
2016
Mean
2015
2016
Mean
Baijnath
1.
2.
3.
4.
5.
Vikasnagar
Lower-Kunsal
Nora Garh
Nora
Upper-Kunsal
Mean
2.22
1.82
1.40
1.26
1.67
1.67
2.24
2.23
1.83
1.83
1.41
1.41
1.27
1.27
1.64
1.66
1.68
1.68
Bhedu-Mahadev
2.02
1.44
1.36
1.04
1.19
1.41
2.03
1.46
1.37
1.03
1.19
1.42
2.03
1.45
1.37
1.04
1.19
1.41
6.
7.
8.
9.
10.
Suri
Dheera
Panapar Kholi
Bodda
Mansimbal
1.37
1.42
1.69
1.14
1.07
1.34
1.38
1.44
1.68
1.16
1.06
1.34
1.38
1.43
1.69
1.15
1.07
1.34
Bhawarna
1.36
1.47
1.56
1.09
1.03
1.30
1.37
1.45
1.57
1.08
1.04
1.30
1.37
1.46
1.57
1.09
1.04
1.30
1.32
1.52
2.21
1.27
2.14
1.69
1.34
1.54
2.22
1.26
2.16
1.70
1.33
1.53
2.22
1.27
2.15
1.70
1.24
1.48
2.14
1.21
2.16
1.65
1.26
1.44
2.12
1.22
2.14
1.64
1.25
1.46
2.13
1.22
2.15
1.64
1.32
1.03
1.19
1.47
1.07
1.21
Dharamshala
1.22
1.04
1.28
1.39
1.04
1.19
1.23
1.01
1.27
1.38
1.02
1.18
1.23
1.03
1.28
1.39
1.03
1.19
Mean
11.
12.
13.
14.
15.
Arla Khas
Chachiyan
Balla
Nagri
Dhakrehar
Mean
Kangra
Kot kwal-II
Kot kwal-I
Zamanabad
Thanpuri
Samloti
1.31
1.03
1.18
1.47
1.06
1.21
1.33
1.02
1.19
1.46
1.08
1.22
Jhikli Ichi
Lower-Bagli
Upper-Bagli
Tang
Dadh
Mean
Overall Range
1.23
1.59
1.63
2.20
1.08
1.55
1.03-2.22
1.24
1.57
1.64
2.24
1.09
1.56
1.02-2.24
1.24
1.58
1.64
2.22
1.09
1.55
1.03-2.23
1.07
1.44
1.84
2.15
1.06
1.51
1.03-2.16
1.04
1.41
1.83
2.14
1.08
1.50
1.01-2.14
1.06
1.43
1.84
2.15
1.07
1.51
1.03-2.15
Overall Mean ± SD
1.49±0.36
1.50±0.36
1.49±0.36
1.41±0.35
1.40±0.35
1.41±0.35
16.
17.
18.
19.
20.
Mean
21.
22.
23.
24.
25.
3513
Int.J.Curr.Microbiol.App.Sci (2018) 7(11): 3503-3516
Figure.1 Locations of soil samples
The highest mean water holding capacity of a
block as a whole under the conventional
system was observed in Kangra (52.9%),
while, the lowest was observed for Baijnath
block (48.6%).Water holding capacity in soil
is influenced by many factors especially soil
texture, organic matter and structure of the
soil.
The variation observed between different sites
under protected and open environment, might
be the consequence of variation in
management practices followed by the
farmers. Increase in water holding capacity
under the protected production system might
be attributed to stable aggregates and better
structure as compared to open conditions of
vegetable
production.
Whereas,
comparatively lower values under open
environment might be due to the low stability
of aggregates as well repeated intensive
tillage practices and exposure of the organic
matter to oxidation.
Mean Weight Diameter (MWD)
Water-stable aggregates larger than 2 mm are
the most important fractions in assessing the
effects of fertilization practices on soil
aggregation, for they exert a strong influence
on the mean weight diameter, a
comprehensive index for evaluating soil
structure (Angers and Mehuys 1993). The
MWD in the present investigation for 2015
and 2016 under protected conditions varied
from 1.03 to 2.22 mm and 1.02 to 2.24 mm,
respectively. Considering mean values across
all the locations for 2015 and 2016, MWD
was 1.49±0.36 mm and 1.50±0.36 mm,
respectively (Table 7). Among different
blocks under protected system of vegetable
production, Bhawarna recorded the highest
3514
Int.J.Curr.Microbiol.App.Sci (2018) 7(11): 3503-3516
MWD (1.70 mm) under polyhouse soils,
while Kangra block had the lowest average
MWD (1.21 mm).
Under conventional vegetable cultivation it
varied from 1.03-2.16 mm and 1.01 to 2.14
mm for 2015 and 2016, respectively. Overall
mean values of MWD across all the locations
for 2015 and 2016 were 1.41±0.35 mm and
1.40±0.35 mm, respectively conventional
system of vegetable production followed
almost similar trend as per polyhouse soil and
found highest and lowest values of MWD
under similar blocks as observed under
protected conditions. Comparatively higher
MWD values observed under protected
system might be due to tillage practices which
were carried out within the range of optimum
moisture
conditions
under
protected
cultivation of vegetables ensuring the least
destruction of soil aggregates. As excessive
tilling of soil reduce the organic matter
through oxidation and erosion of soil hence
reduce aggregate stability. Further, soil under
protected condition remains protected from
the beating action of rain and erosion.
Frequent addition of organic matter is another
reason for better stable aggregates under
protected condition as compared to open soil.
Polyhouse growers are more concerned about
the proper management practices under
polyhouse cultivation owing to lesser area and
higher productivity and net returns. A strong
influence from the addition of organic matter
on the stability of aggregates was seen, and
this was more evident in the polyhouse. Also
the sites under protected system where
practice of lime addition was followed higher
MWD was recorded, because calcium act as a
binding agent in formation of large sized
aggregates as calcium is a flocculating agent.
Calcium ions associated with clay generally
promote aggregation and thus MWD.
Chaudhary et al., (2005) and Khan (2015)
have similar findings of calcium as
stabilization and binding agent and also
reported similar results which confirmed the
present findings.
In conclusions, the frequent use of organic
manures resulted in lower bulk density under
polyhouse conditions as compared to
conventional open condition. Continuous
organic fertilization indicated that the use of
FYM and organic manures produced a
decrease in the BD and therefore an increase
in the aggregate stability of soil. Aggregate
stability values were higher in the greenhouse
than in the outdoor plots. Therefore
differences in management practices exert a
significant influence on the evolution of
physical properties. This study indicated that
the comparatively better management
practices followed by farmers in chase of
better returns resulted in an increase in the
soil organic matter, depending upon different
management practices followed by different
farmers. The use of sustainable management
techniques such as the use of organic
amendments and low or no tillage improved
soil physical properties.
References
Blake, G.R. and Hartge, K.H. 1986. Bulk
Density. In Methods of Soil Analysis.
Part I. Physical and Mineralogical
Methods (A Klute, eds.). American
Society of Agronomy: Madison,
Wisconsin; Agronomy Monograph 9:
364-367
Benbi, D.K and Saroa, G.S. 2012. Soil health
and agriculture sustainability in Punjab.
In: 77th Annual Convention of Indian
Society of Soil Science, Dept. of Soil
Science, PAU, Ludhiana
Chander, G., Sharma, S., Sharma, V. and
Verma, S. 2014. Micronutrient cations
status in vegetable growing soils of subhumid and wet temperate zones of
Himachal Pradesh. Himachal Journal of
Agricultural Research 40(1): 79-83
3515
Int.J.Curr.Microbiol.App.Sci (2018) 7(11): 3503-3516
Chaudhary, P.R., Dodha, V., Ahire, V.D.,
Chkravarty, M. and Maity, S. 2005. Soil
bulk density as related to soil texture,
organic matter content and available
total nutrients of Coimbatore soil.
International Journal of Scientific and
Research Publications 3(2): 1-7
Doran, J. Wand Parkin T.B. 1994. Defining
and assessing soil quality. In: Defining
Soil
Quality
for
Sustainable
Environment. Soil Science Society of
America. Publication no. 35. Madison,
WI. Pp 3-21
Gupta, R.P., and Dhakshinamoorthy, C. 1980.
Procedures for Physical Analysis of
Soils
and
collection
of
Agrometerological Data, Division of
Agricultural
Physics,
Indian
Agricultural Research Institute, New
Delhi
Herencia, J.F., Galavis-Garcia, P.A., and
Maqueda, C. 2011. Long term effect of
organic and mineral fertilization on soil
physical properties under greenhouse
and outdoor management practices.
Pedosphere 21: 443-453
Hillel, D. 1980. Fundamentals of soil physics.
Harcourt Brace Jovanivich Publisher.
Academic Press, Inc. San Diego. 413 p
Khan, M., A. 2015. Effect of lime and fly ash
on cation exchange capacity and
unconfined compressive strength (UCS)
of soils. M.Tech. Thesis, NIT Rourkela,
Odisha
Kyandiah, R. 2012. Impact of different land
uses on runoff and nutrient losses in
Ga3 a micro watershed of Giri river in
Solan district of Himachal Pradesh.
M.Sc Thesis, p 74 Department of Soil
Science and Water Management, UHF
Nauni, Solan, India
Piper, C.D., 1950. Soil and Plant Analysis.
Inc. Sci. Pub. INC, New York
Piper, C.S., 1966. Soil and Plant Analysis
(Asian edition). Hans Publisher,
Bombay. p 223-237
Reynolds, W.D., Drury, C.F., Tan, C.S., Fox,
C.A., and Yang, X.M. 2009. Use of
indicators and pore volume function
characteristics to quantify soil physical
quality. Geoderma 152: 252–263
Yoder, R.E. 1936. A direct method of
aggregate analysis and study of the
physical nature of erosion losses.
Journal of American Society of
Agronomy 28: 337-351
How to cite this article:
Shabnam and Sanjay K. Sharma. 2018. Soil Physical Properties as Influenced with Protected
and Conventional Vegetable Production System in District Kangra of Himachal Pradesh.
Int.J.Curr.Microbiol.App.Sci. 7(11): 3503-3516. doi: />
3516