Vietnam’s labour market update newsletter - Volume 24, quarter 4, 2019
Bạn đang xem bản rút gọn của tài liệu. Xem và tải ngay bản đầy đủ của tài liệu tại đây (641.37 KB, 8 trang )
VIETNAM’S LABOUR MARKET
UPDATE NEWSLETTER
Volume 24, quarter 4, 2019
Ministry of Labour - Invalids
and Social Affairs
General Statistics Office
PART 1. SOME INDICATORS OF LABOUR MARKET
1. Key indicators
Table 1. Key economic and labour market indicators
Indicator
2018
2019
Q4
Q1
Q2
Q3
Q4
7.31
6.82
6.73
7.48
6.97
8.6
4.7
9.3
10.0
7.2
3. Total capital investment per GDP (%)
4. Consumer Price index (% compare to the same period
last year)
33.5*
32.2
33.1**
34.3***
33.9*
3.44
2.63
2.7
2.2
3.66
5. Labour force (million people)
55.64
55.43
55.46
55.67
56.12
6. Labour force participation rate (%)
77.21
22.22
54.53
76.58
22.30
54.32
76.21
22.37
54.36
76.14
22.89
54.56
76.60
23.68
55.01
9. Rate of salaried workers in total number of labourers
(%)
45.14
46.31
47.15
47.39
48.35
10. Rate of employment in agriculture. forestry and
fishery industry (AFF) in total employment (%)
36.53
35.53
35.09
34.44
33.79
5.88
6.82
6.46
6.58
6.71
1. Gross domestic product growth rate (GDP) (%)
2. Export turnover growth rate (% compare to the same
period last year)
7. Rate of trained labourers with certificate (%)
8. Number of labourers (million people)
11. Monthly average income of salaried workers (million
dong)
12. Number of unemployed people at working age
(thousand people)
13. Unemployment rate at working age (%)
14. Unemployment rate in urban area (%)
1,062.4 1,059.1 1,054.3 1,064.1 1,063.8
2.17
3.10
2.17
3.10
2.16
3.10
2.17
3.11
2.15
3.10
Source: GSO (2018, 2019), Quarterly statistics and labour force survey data
(*) data of the whole year; (**) date of the first 6 months; (***) data of the first 9 months.
The total GDP in quarter 4/2019 increased
by 6.97%, which was lower than quarter 3/2019
and quarter 4/2018 but exceeded the target set
by the National Assembly (6.6%-6.8%). The
manufacturing and processing industry and
construction remained at high level of growth
(11.29% and 9.1%), which was the major
driving force for economic growth in 2019.
The labour market continued to be improved.
The rate of trained workers and salaried
workers increased; the rate of workers in AFF
decreased significantly; workers’ income was
improved while the unemployment rate
remained low.
Quarterly Labour Market Update Newsletter, Volume 24, Quarter 4/2019
1
2. The population aged from 15 and
labour force
In quarter 4/2019, the population aged from
15 and older was 73.83 million people, going
up by 1.6% compared to quarter 4/2018; the
number of female increased by 2.45%;
population in urban area increased by 4.25%.
The labour force aged from 15 and older
was 56.12 million, growing by 0.87%
compared to quarter 4/2018; the number of
female increased by 1.05%; urban areas had an
increase of 2.57%.
The labour force in working age was 49.37
million, increasing by 0.87% compared to
quarter 4/2018.
Table 2. The size and participation rate in
labour force of population aged from 15 and
older
2018
2019
Q4
Q1
Q2
Q3
Q4
1. Population aged from 15 and older (Million ppl)
Aggregate
72.67 72.93 73.31 73.64 73.83
Male
35.76 35.55 35.73 35.91 36.02
Female
36.91 37.37 37.58 37.73 37.81
Urban
26.78 27.00 27.42 27.51 27.92
Rural
45.89 45.92 45.90 46.13 45.91
2. Labour force aged from 15 and older (Million ppl)
Aggregate
55.64
55.43 55.46 55.67 56.12
Male
29.10
29.00 29.05 29.08 29.30
Female
26.54
26.44 26.41 26.59 26.82
Urban
18.40
18.48 18.50 18.57 18.87
Rural
37.24
36.95 36.96 37.10 37.25
3. Labour force participation rate* (%)
77.21
76.58 76.21 76.14 76.60
4. Labour force in working age (Million ppl)
48.94
48.85 48.89 49.11 49.37
Source: GSO (2018, 2019), Quarterly labour force survey.
* Only those who are currently working in Vietnam
In quarter 4/2019, the labour force
participation rate of population aged from 15
and older was 76.6%, which was the highest rate
in 4 quarters of 2019 but decreasing compared to
quarter 4/2018.
Regarding occupational and technical
qualifications
The labour force aged from 15 and older
having diploma/certificate with term from 3
months and higher in quarter 4/2019 was 13.29
million people, increasing by 930 thousand
people (equivalent to an increased of 7.52%)
compared to quarter 4/2018.
The rate of trained workers having
diploma/certificate was 23.68% of the labour
force aged from 15 and older, increasing by
1.47% compared to quarter 4/2018 and 0.79%
compared to quarter 3/2019. In which, university
degree holders accounted for 11.39%, college:
3.8*%; intermediate-level vocational training:
4.70% and elementary-level vocational training:
3.71% in total labour force aged from 15 and
older.
Figure 1. The rate of trained workers having
diploma/certificate in labour force aged from
15 and older and the labour force in working
age, Q4/2018, Q3/2019 and Q4/2019
Unit: %
Source: GSO (2018, 2019), Quarterly labour force survey.
The trained labour force in working age
having diploma/certificate with term from 3
months or higher of quarter 4/2019 was 12.69
million people, going up by nearly 1 million
people compared to quarter 4/2018 (8.51%) and
nearly 490 thousand people compared to quarter
3/2019 (3.98%). The rate of trained workers
having diploma/certificate in labour force in
working age was 25.7%, increasing by 1.81%
compared to quarter 4/2018 and 0.85%
compared to quarter 3/2019.
Figure 2. The labour force aged from 15 and
older by occupational and technical
qualifications, Q4/2018 and Q4/2019
Unit: million people
Source: GSO (2018, 2019), Quarterly labour force survey.
Quarterly Labour Market Update Newsletter, Volume 24, Quarter 4/2019
2
3. Employment
The number of workers aged from 15 and
older in quarter 4/2019 were 55.01 million
people, increasing by 479.66 thousand people
(0.88%) compared to quarter 4/2018.
The rate of female having jobs was 47.80%,
going up by 0.19% compared to quarter 4/2018;
urban area accounted for 33.30% of total
number of working people, increasing by 0.55%
compared to quarter 4/2018.
In quarter 4/2019, Vietnam had 26.6 million
salaried workers (accounting for 48.35% of total
number of working people), a growth of 740.7
thousand people (2.86%) compared to previous
quarter and 198.3 thousand people (8.05%)
compared to quarter 4/2018.
Figure 3. Labour fluctuation in some
industries in quarter 4/2019 compared to
quarter 3/2019 and 4/2018
Unit: million ppl
Table 3. The quantity and structure of
employed people
2018
2019
Q4
Q1
Q2
Q3
Q4
1 Quantity (million people)
54.30 54.53 54.32 54.36 55.01
2. Structure
100.00 100.00 100.00 100.00 100.00
(%)
a. Gender
Male
52.39 52.25 52.41 52.29 52.20
Female
47.61 47.75 47.59 47.71 47.80
b. Urban/Rural
Urban
32.75
32.02 33.03 33.04 33.30
Rural
67.25
66.98 66.97 66.96 66.70
c. Economic sector
AFF
36.53
35.53 35.09 34.44 33.79
Industry27.76
28.58 29.23 29.85 29.92
Construction
Service
35.71
35.89 35.68 35.71 36.28
d. Job position
Owner
2.12
2.07
3.08
2.62
2.62
Self-employed
38.91
38.15 35.44 36.24 35.63
Family worker
15.15
14.64 15.14 13.75 13.39
Salaried
43.81
45.14 46.31 47.39 48.35
worker
Cooperative
0.01
0.01
0.02
0.01
0.01
members &
unclassifiable
Source: GSO (2018, 2019), Quarterly labour force survey.
The AFF sector continued to have decrease in
terms of both number and rate of workers
working in this sector. In quarter 4/2019, there
were 18.59 million workers in this sector,
decreasing by 198 thousand people compared to
quarter 3/2019 and 1.33 million people
compared to quarter 4/2018. The rate of workers
in AFF sector accounted for 33.79%, declining
by 0.65% compared to quarter 3/2019 and
2.74% compared to quarter 4/2018.
Source: GSO (2018, 2019), Quarterly labour force survey.
Four industries with the highest increase in the
number of workers in comparison to quarter 3/2019
and quarter 4/2018 were: “Construction”,
“Transportation, warehouse”, “Other services” and
“Wholesale and retail; repair of automobiles,
motorbikes and other motor vehicles”. Two
industries with the highest decrease in the number
of workers in both comparison quarters were
“AFF” and “health and social assistance activities”;
two industries that had decline in the number of
workers compared to the previous quarter but still
increasing compared to quarter 4//2018 were
“manufacturing and processing industry” and
“construction”.
4. Income of salaried workers
In quarter 4/2019, income of salaried workers
from their main jobs was VND 6.71
million/month on average, increasing by 130,000
dong (1.98%) compared to previous quarter and
830,000 dong 914.12%) compared to quarter
4/2018.
Compared to the previous quarter and quarter
4/2018, average income from the main jobs went
up in almost all groups, excepting for workers in
Cooperative area decreasing by 440,000 dong
compared to quarter 3/2019.
Quarterly Labour Market Update Newsletter, Volume 24, Quarter 4/2019
3
Table 4. Average monthly income of salaried
workers from main jobs
Unit: million dong
2018
Q4
5.88
6.18
5.47
6.85
5.18
2019
Q2
Q3
6.46 6.58
6.60 6.75
5.80 5.91
6.89 7.05
5.59 5.68
Q4
6.71
7.07
6.25
7.83
5.87
5.42
5.74
7.10
6.61
6.75
8.50
7.74
6.90
7.24
9.28
5.16
5.41
5.69
8.51
8.34
7.04
6.96
5.25
9.07
8.73
7.52
7.38
Q1
Aggregate
6.82
Male
6.87
Female
6.09
Urban
7.29
Rural
5.74
No skill occupational
5.04 4.26 5.33
qualification
Elementary-level
6.58 8.02 7.28
Intermediate-level
6.08 6.52 6.46
College
6.35 6.84 6.67
University & higher
8.27 8.93 8.32
Household/
4.94 4.92 5.06
individual
Cooperative
4.22 4.78 5.15
100% State capital
9.26 8.13
7.631
2
State-owned
9.27 8.3
Non-State
6.68 7.40 6.90
FDI
6.62 7.83 6.93
Source: GSO (2018, 2019), Quarterly labour force survey.
In quarter 4/2019, the average monthly
income from all jobs of salaried workers reached
VND 6.79 million, an increase of 130,000 dong
compared to quarter 3/2019 (1.95%).
Figure 4. Total average monthly income of
salaried workers from all jobs, quarter,
quarter 4/20193
Source: GSO (2019), Quarterly labour force survey
1
The 2018 data did not separate 100% State capital with
other State-owned enterprises
2
Enterprises with State capital proportion less than 100%
3
In Quarter 4/2019, 4.95% of salaried workers have
income generated from 2 jobs or more
5. Unemployment and underemployment
a. Unemployment
The unemployment number and rate
remained low. In quarter 4/2019, Vietnam had
over 1.06 unemployed people in working age,
decreasing by 0.37 thousand people compared to
the previous quarter but increasing by 1.4
thousand people compared to quarter 4/2018.
The unemployment rate of people in working
age was 2.15%, which was lower than the
previous quarter and quarter 4/2018.
Table 5. The quantity and rate of unemployed
people in working age by genders,
urban/rural and age groups
2018
2019
Q4
Q1
Q2
Q3
Q4
I. Quantity (thousand ppl)
Nationwide 1,062.4 1,059.1 1,054.3 1.064.1 1,063.8
Male
507.0 591.5 545.9 538.5
579.3
Female
555.3 467.7 508.4 525.6
484.5
Urban
524.2 525.9 526.2 530.5
540.9
Rural
538.2 533.2 528.1 533.6
522.9
Youth
391.7 449.9 443.3 440.4
431.0
(15-24)
Adult (≥25)
670.7 609.3 621.0 623.7
632.8
II. Unemployment rate of people in working age (%)
Nationwide
2.17
2.17
2.16
2.17
2.15
Male
1.90
2.22
2.04
2.01
2.15
Female
2.49
2.10
2.29
2.35
2.16
Urban
3.10
3.10
3.10
3.11
3.10
Rural
1.68
1.67
1.65
1.66
1.64
Youth (15-24) 5.62
6.29
6.47
6.53
6.38
Adult (≥25)
1.60
1.46
1.47
1.47
1.48
Source: GSO (2018, 2019), Quarterly labour force survey.
Unemployed youth: in quarter 4/2019,
Vietnam had 431 thousand unemployed youth
(accounting for 40.5% of total number of
unemployed), decreasing by 9.45 thousand
people compared to quarter 3/2019 but
increasing by 39.31 thousand people compared
to quarter 4/2018. The unemloyment youth rate
in quarter 4/2019 was 6.38%, which was 0.15%
lower than quarter 3/2019 by 0.76% higher than
quarter 4/2018.
The unemployment in the group of college
and university degree holders or higher: in
quarter 4/2019, the number of unemployed
people qualified college were 92.5 thousand
people (an increase of 13.5 thousand people
compared to quarter 3/2019 and over 11
thousand people compared to quarter 4/2018),
the number of unemployed people qualified
Quarterly Labour Market Update Newsletter, Volume 24, Quarter 4/2019
4
university or higher was 200.2 thousand people
(an increase of 13.4 thousand people compared
to quarter 3/2019 and 64.39 thousand people
compared
to
quarter
4/2018).
The
unemployment rate of college degree holders
was 4.42% and 3.2% for those qualified
university or higher.
Figure 5. The unemployment rate of people in
working age by occupational and technical
qualification
Unit %
6. Labour supply and demand connection
The need on recruitment and job seeking from
the employment portal of the MOLISA in quarter
4/2019 shows that:
- Recruitment need:
There were 89,500 vacancies posted by
enterprises, decreasing by 30,900 vacancies
(25.7%) compared to quarter 3/2019.
The need for female workers accounted for
63.1%, an increase of 9.5% compared to quarter
3/2019. The recruitment need of Non-state owned
enterrprises accounted for 73.4%, FDI accounted
for 14.6%; State-owned enterprises accounted for
10.3% of total recruitment need.
Figure 7. Recruitment need by types of
ownership
Source: GSO (2018, 2019), Quarterly labour force survey.
b. Underemployment
In quarter 4/2019, Vietnam had 598.8
thousand people in working age who were
underemployed4, a decline of 64.3 thousand
people compared to quarter 3/2019. The
underemployment rate of workers in working
age was 1.24%, which was lower than quarter
3/2019 but 0.11% higher than quarter 4/2018. In
which, the underemployment rate in rural area
was 1.67%, urban area was 0.45%.
Among total number of underemployed
people, 87.4% were rural workers; 80.3%
working in AFF.
Figure 6. The underemployment number and rate
of workers in working age
Source: ILSSA synthesized from MOLISA’s web portal.
- Job seeking need:
The number of job seekers were 30,100
people, nearly 1.2 times of quarter 3/2019. In
which, female job seekers were 13,100 people
(accounting for 43.4%), an increase of 2,000
people, which was 1.5 times of quarter 3/2019.
Table 6. Job seeking need from employment web
portal
Unit: %
2018
2019
Q4
Q1
Q2
Q3
Q4
100.0 100.0 100.0 100.0 100.0
Source: GSO (2018, 2019), Quarterly labour force survey
4
Underemployed people are those who have working time
fewer than 35 hours in the surveyed week with desire and
readiness to work
Total
By gender
Male
54.0
Female
46.0
By technical qualification
Without certificate
19.8
Elementary-level
7.9
Intermediate
30.2
College
23.0
57.1
42.9
57.0
43.0
56.3
43.7
56.6
43.4
19.7
8.5
30.5
24.8
21.0
8.0
30.3
23.6
20.7
9.6
27.8
24.8
18.6
10.4
29.0
25.4
University
and higher
19.0 16.5 17.1 17.0 16.6
Source: ILSSA synthesized from MOLISA’s web portal
Quarterly Labour Market Update Newsletter, Volume 24, Quarter 4/2019
5
By occupational and technical qualifications,
8,700 job seekers were qualifed intermediatelevel vocational training (accounting for 29.0%),
an increase of 1,600 people compared to quarter
3/2019; 7,600 job seekers were qualified college
(accounting for 25.4%), an increase of 1,300
people; 5,000 job seekers were qualified
university or higher (accounting for 16.6%), an
increase of 700 people; 5,600 job seekers had no
qualification (accounting for 18.6%), an increase
of 300 people compared to quarter 3/2019.
By occupations, the number of people
seeking for jobs in “electricity-electronics” and
“accounting – auditing” increased compared to
quarter 3/2019 (1,200 and 700 people
respectively); “human resource” had a decrease
in the number of job seekers compared to
quarter 3/2019 (200 people). The group of
“unskilled workers” also had an increase in the
number of job seekers compared to quarter
3/2019 (500 people).
PART 2. RESULTS OF IMPLEMENTING SOME LABOUR MARKET POLICIES
In 2019, there were nearly 2.34 million people were enrolled to
vocational education system; in which, about 568,000 people (accounting
for 24.29%) enrolled to college level and intermediate level; about 1.77
million people (75.91%) enrolled to elementary level and other vocational
training programs.
Vocational
education
For high-quality training: (i) pilot training according to 12 programs
transferred from Australia (by 8/2019, 41 classes were held with the total
number of students of 731); (ii) Cooperate with the HWK Leipzig,
Germany to implement pilot training according to 22 programs
transferred from Germany (by 11/2019, 66 classes in 45 schools
participating in the pilot were opened).
Job
recommendation
through
Employment
Service Centers
(ESCs) of Labour –
Invalids and Social
Affairs sector
Sending workers to
work overseas
under contract
In quarter 4/2019, ESCs organized 343 job trading sessions, an
increase of 27 sessions compared to the previous quarter and 2 sessions
compared to quarter 4/2018; employment consultation and
recommendation was provided to 783,600 turns of people (increasing by
29,280 turns compared to quarter 3/2019 and 796 turns compared to
quarter 4/2018), in which, 261,367 turns of people were employed
(increasing by 6,840 turns of people comapred to quarter 3/2019 and
10,598 turns of people compared to quarter 4/2018).
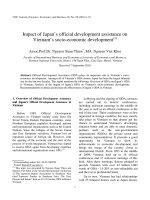
The number of enterprises licensed to send workers to work abroad by
the end of quarter 4/2019 were 421 enterprises (including 15 State-owned
enterprises).
The total number of workers working overseas in quarter 4/2019 were
47,915 people (39.4% female). In which: Japan: 29,039 people (60.6%),
Taiwan: 13,306 people (27.7%), Romania: 2,375 people (5%), Korea:
1,307 people (2.7%) and 4% in other markets.
In 2019, the total number of Vietnamese workers working overseas
were 152,530 people (35.9% female). In which, Japan: 82,703 people
(54.2%), Taiwan: 54,480 people (35.7%), Korea: 7,215 people (4.7%),
Romania: 3,478 people (2.3%) and 3.1% in other markets.
Quarterly Labour Market Update Newsletter, Volume 24, Quarter 4/2019
6
In quarter 4/2019, there were 177,895 applicants for requesting
unemployment benefits, a decrease of 65,163 people (15.4%) compared to
quarter 3/2019, but increasing by 11,776 people (7.08%) compared to quarter
4/2018.
Reasons for unemployment: 25.3% expiring labour contract, working
contracts or bilateral termination of contracts; 36.9% unilateral termination
Unemployment
of contracts before the expire date; 6.6% illegaly unilateral termination of
insurance
contracts;
3.7%
enterprises/organizations
dissolved,
bankrupted,
restructured; 1.2% due to be disciplined or fired and 26.3% due to other
reasons
In quarter 4/2019, the number of people receiving decision for
unemployment allowance were 195,087 people, a decline of 60,693 people
(23.7%) compared to quarter 3/2019 and a rise of 12,233 people (6.7%)
compared to quarter 4/2018. The rate of female having decision for monthly
unemployment allowance accounted for 57.1%. The rate of people aged
between 25-40 years old having decision for unemployment allowance was
still high (male: 68.1%; female: 69.2%).
In quarter 4/2019, the number of people receiving job consultation and
recommendation were 407,396 people; in which, the number of people who
were recommended jobs were 40,957 people (accounting for 23.0% of total
number of applicants for unemployment benefits), an increase of 445 people
(1.7%) compared to quarter 4/2018; the number of unemployed receiving
decision on vocational training support were 9,911 people (accounting for
5.1% of total number of people having decision on unemployment benefits),
an increase of 174 people (1.8%) compared to quarter 4/2018; the number of
people who were not entitled to unemployment benfits so were received
vocational training support were 14 people.
Table 7. The implementation of unemployment insurance
Unit: ppl
Criteria
Number of applicants for unemployment benefits
Number of people having decision to receive
monthly unemployment allowance
Number of people transferring to receive
unemployment allowance
Number of unemployed people receiving job
consultation, recommendation
In which: number of people receiving job
recommendation
Number of unemployed people supported for
vocational training
2018
Q4
166.119
182.804
Q1
141.432
120.666
2019
Q2
Q3
287.314 243.058
264.389
255.780
1.265
1.105
1.368
1.752
1.250
346.965
279.784
472.229
498.366
407.396
40.552
32.425
57.284
57.987
40.957
9.737
7.798
11.388
12.861
9.911
Q4
177.895
195.087
Source: Department of Employment (2018, 2019)
Social Insurance
Participation status: By 31/12/2019, the total number of social
insurance participants were 15.736 million people, an increase of 1.102
thousand people (6.87%) compared to 2018. In which, the number of
compulsory SI participants were 15.185 million people (accounting for
96.5%), an increase of 732 thousand people (5.06%) compared to 2018;
the number of voluntary SI participants were 551 thousand people
(accounting for 3.5%), increasing by 280 thousand people (103.3%)
compared to 2018.
Quarterly Labour Market Update Newsletter, Volume 24, Quarter 4/2019
7
The SI participation rate to labour force in working age was 31.87%.
The settlement of SI benefits: by the end of 2019, there were about
3.1 million turns of people who were receiving pension and monthly SI
benefits. In 2019, there were 840,302 turns of people receiving lumpsum allowance; 10.737 million turns of people receiving benefits for
illness, maternity, health recovery.
By 31/12/2019, the estimated spending for SI was VND 198,496
billion, in which: from State budget: VND 40,780 billion, and from SI
Fund: VND 157,716 billion.
Table 8. Status of participation in SI
Criteria
Total number of participants
Participation rate to labour force
Structure by:
Compulsory
Participation rate to labour force
Unit
Thousand ppl
%
Thousand ppl
Thousand ppl
2018
14.724
30,14
2019
15.736
31,87
14.453
271
15.185
551
Source: VSS (2018, 2019).
PART 3. LABOUR MARKET POTENTIAL
The world economic downturn, the sharp
drop in crude oil prices, the ongoing USChina trade war and especially the new
Corona virus (Covid-19) booming globally,
etc. have a strong impact on domestic
production and business activities. It is
expected that GDP in quarter 1/2020 increases
by about 3.82%; in which, the AFF sector
increases by 0.08% (contributing 0.2% to the
aggregate growth); the industry and
construction sector increases by 5.15% and
the service sector increases by 3.27%
(contributing 41.4%).
The decline in economic growth may result
in job loss or reduced working hours in many
industries. Some industries are estimated to
sharply decrease in quarter 1/2020 compared
to quarter 4/2019 including: AFF with a
decrease of about 322,000 people; hospitality
with a decrease of about 17,000 people;
wholesale and retail with a decrease of
289,000 people; education and training with a
decrease of 63,000 people; real estate business
with a decrease of 13,000 people. On the
contrary, some industries will remain the
employment such as: Professional, scientific
and technological activities increases about
10,000 people; finance, banking and insurance
sector increases about 8,000 people, Health
and social assistance activities increase about
34,000 people.
The newsletter is compiled with the cooperation of the General Statistics Office and the participation of some units of the
Ministry of Labour-Invalids and Social Affairs: Institute of Labour Science and Social Affairs, Department of Social
Insurance; Department of Employment, Department of Overseas Labour, Department of Labour Relations and Wage,
General Directorate of Vocational Education, Center for Information.
For more information, please contact:
EDITORIAL BOARD OF LABOUR MARKET UPDATE NEWSLETTER
MINISTRY OF LABOUR – INVALIDS AND SOCIAL AFFAIRS
Tel: 024.39361807
Email:
Website:
Quarterly Labour Market Update Newsletter, Volume 24, Quarter 4/2019
8