Effects of stocking density on growth and survival of tilapia cultured in biofloc technology system in brackish water
Bạn đang xem bản rút gọn của tài liệu. Xem và tải ngay bản đầy đủ của tài liệu tại đây (703.92 KB, 10 trang )
Vietnam Journal of Marine Science and Technology; Vol. 20, No. 2; 2020: 221–230
DOI: /> />
Effects of stocking density on growth and survival of tilapia cultured in
biofloc technology system in brackish water
Nguyen Xuan Thanh1,2,*, Le Duc Cong3, Le Minh Hiep1, Dao Thi Anh Tuyet1,2
1
Institute of Marine Environment and Resources, VAST, Vietnam
Graduate University of Science and Technology, VAST, Vietnam
3
Fisheries and Technical Economic College, MARD, Vietnam
*
E-mail:
2
Received: 19 Febuary 2020; Accepted: 21 April 2020
©2020 Vietnam Academy of Science and Technology (VAST)
Abstract
This study examined the effect of stocking density on growth and survival of tilapia cultured in biofloc
technology system. Three different stocking densities cultured in biofloc technology were 6 fish/m3, 8
fish/m3 and 10 fish/m3 for 86 days in triplicate for each treatment. The stocking density of the control lot was
3 fish/m3 cultured without biofloc technology. Initial stocking weight ranged from 2–3 g/fish. The water
quality parameters were monitored and regulated in the suitable ranges for biofloc technology and for the
growth and development of tilapia. The results showed that specific growth rate of fish cultured at a density
of 6 fish/m3 was higher than that in the treatments of 8 fish/m3 and 10 fish/m3 with the average values of
5.72%; 5.62% and 5.43%, respectively, and the specific growth rate of fish in the control treatment was
5.71%. Daily growth rate of fish cultured at a density of 6 fish/m3 was higher than that cultured at densities
of 8 fish/m3 and 10 fish/m3 with average values of 3.19 g/day, 2.98 g/day, and 2.55 g/day, respectively; and
the daily growth rate of the control treatment was 3.27 g/day. Survival rate of tilapia cultured at densities of
6 fish/m3 and 8 fish/m3 was 100%, whereas survival rate of tilapia cultured at a density of 10 fish/m3 was
95.75%, and it was 88.9% for the control lot. The research results provide a scientific basis to propose tilapia
culture technique in biofloc technology in brackish water, with the density of 6–8 fish/m3.
Keywords: Stocking density, tilapia, biofloc technology (BFT), brackish water.
Citation: Nguyen Xuan Thanh, Le Duc Cong, Le Minh Hiep, Dao Thi Anh Tuyet, 2020. Effects of stocking density on
growth and survival of tilapia cultured in biofloc technology system in brackish water. Vietnam Journal of Marine
Science and Technology, 20(2), 221–230.
221
Nguyen Xuan Thanh et al.
INTRODUCTION
Biofloc technology (BFT) is a new
biotechnology
solution
in
sustainable
development, biosafety and environmentalfriendly aquaculture production [1, 2]. The feed
conversion rate is reduced by applying BFT as
the aquatic animals are fed with suspended
biofloc particles formed by the combination of
a cheap source of carbohydrate food and
heterotrophic
microbiota.
Heterotrophic
bacteria in suspended biofloc can assimilate the
waste ammonium for new biomass production.
Hence, ammonia can be maintained at a low
and non‐toxic concentration, therefore water
replacement is no longer required [2–4].
The technical process of intensive culture
of tilapia in brackish water is now being
applied at an average stocking density of 3
fish/m3. It does not use continuous aeration
system, so it cannot be cultured at a higher
density. The water is replaced regularly from
the 3rd month of culture, once a week on
average volume of 1/3 the amount in the pond
to ensure the water quality. Aeration operates at
night or on a cloudy day at the end of the
second month of culture. However, BFT
requires the operation of a continuous aeration
system to form and maintain biofloc. It is
necessary to determine the appropriate density
to avoid wasting energy, reduce production
costs and gain production efficiency.
The research provides the necessary
information on fluctuations of environmental
factors, growth rates and survival rates of
tilapia cultured with BFT at different densities.
Then, the most appropriate tilapia stocking
density in biofloc system is determined to
achieve the highest efficiency.
MATERIAL AND METHODS
Time and experimental site
Time: from May 2, 2019 to July 30, 2019.
Experimental site: The experiment was
conducted at a hatchery belonging to Hoang
Huong Fisheries Development Co. Ltd. that is
located in Tan Thanh ward of Duong Kinh
district, Hai Phong city.
Experimental design
The experiment was carried out with
three different density treatments with BFT
222
and the control without BFT (under current
water exchange technology with the density
of this technology). Each treatment was
conducted in triplicate.
The experiments were set up completely
randomly in tanks of 4 m3. The initial salinity
of cultured water was 7‰ with biofloc. Nonexperimental factors such as environmental
conditions (temperature, salinity, DO,…) and
food of each experiment were similar. To make
biofloc, we used molasses, fish feed, soybean
powder mixed together with a ratio of 3:1:3 in
weight, then composted with probiotics
containing Bacillus spp. strain (CP-Bioflus 30
g/m3). The incubation process was carried out
under aeration conditions at 25–28oC, stirring
for 48 hours to ferment, then putting into the
pond continuously for 3 days, once a day at 9–
10 am. When the clarity of cultured water
reached 30–40 cm, a probiotic supplement with
the main ingredient of Bacillus spp. was
conducted continuously for 3 days at 10 am,
with the amount of inoculants 0.15 g/m3/day
until the biofloc appeared in the pond. The
determination of biofloc in the pond was based
on the floc volume index (FVI), calculated
from the floc volume after 30 minutes of
sedimentation in an Imhoff cone [5], with a
hopper reaching 0.1–0.2 ml/l, then the creation
of biofloc was stopped.
Experiment was cultured with BFT systems,
three stocking densities as I: 6 fish/m3; II: 8
fish/m3; III: 10 fish/m3; IV (control treatment
without BFT, common cultured technique,
periodical water replacement): 3 fish/m3.
The tilapia fingerlings used in the
experiment were the male unisexual tilapia
(Oreochromis sp.). Fingerlings acclimate to
salinity, its length ranged from 4–6 cm and its
weight ranged from 2–3 g/fish.
Biofloc was maintained in ponds weekly
with the addition of carbohydrates and
probiotics (CP-Bioflus) containing mainly
Bacillus spp., with bacterial density higher than
107 CFU/g. The amount of CP-Bioflus was 0.15
g/m3/time. The carbon source was from
molasses containing 50% carbohydrate (C).
The amount of carbohydrate was determined
Effects of stocking density on growth and survival
according to Avnimelech, 2007 [6] and
calculated quickly by the following formula:
X = [C/N (% protein × %Nprotein) –
%Cfeed]/%Cmolasses
In which X was the amount of molasses added
to achieve the desired C/N ratio; C/N was the
ratio of C/N reached; %Nprotein was the nitrogen
content contained in 1 g of protein; %Cfeed was
the percentage of carbon in the feed
component; %Cmolasses was the carbon content
in the molasses.
According to the guidance of Avnimelech,
2012 [1] and the research results of the authors
(not published), the appropriate C/N ratio in the
BFT system of brackish tilapia culture was
15/1.
Molasses
contained
50%
of
carbohydrates, the amount of molasses was
supplemented from 30–40% of the feed for
fish, calculated from the previous molasses
addition, depending on the protein in the feed,
supplemented once a week. During stocking,
water was added flexibly due to evaporation
and maintained biofloc.
Environmental factors such as temperature,
pH, DO, salinity, and alkalinity were monitored
daily to timely adjust in the pond.
TAN, TSS, NO2, NO3, were monitored
once a week.
The growth of fish was checked every 15
days.
Daily feed intake was monitored in the
experimental tanks.
The criteria of experimental evaluation
include:
Survival rate (S - %).
Weight growth (WG).
Specific growth rate (SGR - %/day).
Daily growth rate (DGR - gr/day).
Dry feed intake (DFI) (g/fish).
Feed efficiency: feed conversion ratio
(FCR); protein efficiency ratio (PER) (g/g).
Parameter analysis
Environmental factors including water
temperature, pH, DO, salinity parameters
were measured by a quick tester or the SERA
test kit: Water temperature, DO (portable DO
meter YSI 55 - USA), pH (portable DO meter
pH315i/set - Germany), salinity ( ATAGO Japan).
The samples of nutrient factors including
total ammonia nitrogen (TAN), nitrite ((NO2),
nitrate (NO3-) were collected, analyzed and
processed for each parameter according to the
guidance of the APHA, 1998 “Standard
methods for the examination of the water and
wastewater (22nd ed.) [7].
Method of evaluating the growth of fish
and feed coefficient:
Weight growth (WG) (g) = Mean final weight
(Wf (g)) – Mean initial weight (Wi (g))
Specific growth rates (SGR - %/day) is
calculated by the formula:
SGR %.day 1
lnW
f
ln Wi
t
100
Daily growth rates (DGR – g/day) is:
DGR g.day 1
W
f
Wi
t
Where: Wi, Wf: Initial weight and final weight
respectively; t: days of experiment.
Determination of survival rate (%) and
productivity of fish after finishing the
experiment.
Survival rate (%) = (Total number of fish
surviving/total number of fish stocked) × 100
Feed conversion ratio (FCR):
FCR = Total weight of feed given/Total weight
of fish gain
Dry feed intake (DFI):
DFI (g/fish) = Daily feed intake (g)/Total fish
Protein efficiency ratio (PER):
PER = Net weight gain/Protein consumed (g)
Data analyses
Microsoft Office Excel 2010 was used to
analyze, calculate, process data and diagram.
ANOVA was used to verify the significant
differences in environmental parameters and
the fish growth rate.
223
Nguyen Xuan Thanh et al.
RESULTS
Fluctuation of environmental factors during
the experiment
The environmental factors
The environmental factors including
temperature, pH, DO and salinity of the
stocking densities were monitored and adjusted
to ensure the similarity between these
treatments. The ratio C:N was monitored and
analyzed to suit the experiments.
Table 1. Fluctuation of the environmental factors during the experiments
Environmental factors
Morning
Temperature (oC )
Afternoon
Morning
pH (1-14)
Afternoon
Morning
DO (mg/l)
Afternoon
Morning
Salinity (‰)
Afternoon
I
29.8 ± 0.4
(27.8–30.6)
30.7 ± 0.6
(28.6–31.8)
7.7 ± 0.3
(7.4–8.5)
7.9 ± 0.4
(7.6–8.4)
6.2 ± 0.6
(5.2–6.8)
6.8 ± 0.7
(5.6–7.9)
7±1
(6–8)
7±1
(6–8)
Stocking density treatments
II
III
29.8 ± 0.4
29.8 ± 0.4
(27.8–30.6)
(27.8–30.6)
30.7 ± 0.6
30.7 ± 0.6
(28.6–31.8)
(28.6–31.8)
7.6 ± 0.5
7.5 ± 0.4
(7.3–8.4)
(7.3–8.2)
7.9 ± 0.5
8.1 ± 0.4
(7.6–8.5)
(7.7–8.6)
5.9 ± 0.4
4.8 ± 0.5
(4.8–6.5)
(4.6–6.2)
6.6 ± 0.6
5.6 ± 0.5
(5.4–7.6)
(4.8–6.8)
7±1
7±1
(6–8)
(6–8)
7±1
7±1
(6–8)
(6–8)
IV
29.8 ± 0.4
(27.8–30.6)
30.7 ± 0.6
(28.6–31.8)
7.8 ± 0.5
(7.4–8.6)
7.9 ± 0.5
(7.6–8.5)
4.5 ± 0.6
(3.8–5.4)
5.5 ±0.7
(4.6–6.9)
7±1
(6–8)
7±1
(6–8)
Notes: I, II, III with BFT included I: 6 fish/m3; II: 8 fish/m3; III: 10 fish/m3; IV (control without
BFT): 3 fish/m3.
Table 1 showed that the temperature ranged
from 29–30oC, pH ranged from 7.5–8.1, DO
ranged from 4.5–6.8 mg/l and the salinity
ranged around 7‰ in each treatment. The
environmental factors (ToC, DO, pH, S‰) in
experimental treatments with biofloc systems
(I, II and III) show no significant difference
compared to the control treatment (IV). This
environmental condition was suitable for tilapia
culture and biofloc growth [8–10].
Monitoring results of nutrient factors
Monitoring results of total ammonia
nitrogen (TAN) in table 2 showed that the
mean value of TAN in the treatment I was 0.53
mg/l, with a range from 0.16–1.55 mg/l; in the
treatment II was 0.70 mg/l with a range from
0.22–1.82 mg/l; in the treatment III was 0.83
mg/l with a range from 0.14–2.28 mg/l; in the
control treatment IV was 1.42 mg/l with a
range from 0.12–3.22 mg/l. TAN tended to rise
in the treatments, then gradually decreased,
when adding carbon and biofloc it grew rapidly
as heterotrophic bacteria had a large biomass to
absorb nitrogen to produce biofloc particles.
224
TAN value in the control treatment tended to
be higher than that in the treatments with BFT
application due to no carbon adding. The
treatments with higher density had higher TAN
value than the treatments with lower density,
but there was no statistically significant
difference (P < 0.05).
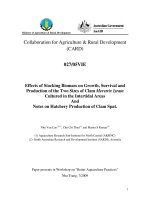
Figure 1 showed that, from the 7th week of
culture onwards, the fish food intake was
needed more along with biofloc decomposition,
because fish did not used up, it caused the
process of high N accumulation, resulting in
increasing TAN value. TAN value was the
highest in the 9th week in culture systems and
biofloc sediment needed to be removed. In the
control treatment, TAN value decreased due to
the water replacement by 20% in the 4th and 5th
weeks and by 50% in the 9th week.
These experimental results were consistent
with the results of Emerenciano et al., (2017).
Emerenciano et al., (2017) and Azim and Little
(2008) [4, 10] also recommended that the
amount of TAN is less than 1 mg/l when
applying BFT. There is no TAN limit in the
environmental regulation on tilapia culture.
Effects of stocking density on growth and survival
Table 2. Monitoring results of the nutrient factors in experiments
Nutrient factors
TAN (mg/l)
TSS (mg/l)
NO2-N (mg/l)
NO3-N (mg/l)
I
0.53 ± 0.4a
(0.16–1.55)
247.1 ± 97.3a
(57.3 – 409.0)
0.13±0.09a
(0.01–0.36)
1.98 ± 1.32a
(0.21–4.35)
Stocking density treatments
II
III
0.7 ± 0.49a
0.83 ± 0.67ab
(0.22–1.82)
(0.14–2.28)
307.5 ± 84.6a
330.9 ± 85.2a
(132.7–437.3)
(142.9–445.7)
0.16 ± 0.11a
0.20 ± 0.16a
(0.02–0.41)
(0.02–0.56)
2.39 ± 1.69a
2.7 ± 1.91ab
(0.24–05.66)
(0.22–6.27)
IV (Control)
1.42 ± 0.94cb
(0.12–3.22)
188.8 ± 82.4b
(38.7–331.3)
0.28 ± 0.21b
(0.02–0.84)
3.36 ± 2.35cb
(0.25–7.79)
Notes: Values with different lowercase letters in the same row show statistically significant
differences (P < 0.05). Values with same lowercase letters in the same row show no significant
difference (P > 0.05); I, II, III with BFT included I: 6 fish/m3; II: 8 fish/m3; III: 10 fish/m3; IV
(control without BFT): 3 fish/m3.
(control without BFT): 3 fish/m3.
Figure 1. The variation of TAN value during the experiment
The monitoring results of total suspended
solids (TSS) in table 2 showed that the mean
value of TSS in the treatment I was 274.1
mg/l with a range from 57.3–409 mg/l; in the
treatment II was 307.0 mg/l with a range
from 132–437 mg/l; in treatment III was
330.0 mg/l with a range from 142–445 mg/l;
in the control IV was 188.8 mg/l with a range
from 38.7–331 mg/l.
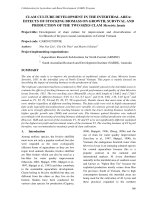
TSS was produced right after fish stocking
because the biofloc formation of TSS tended to
increase during adding more feed and biofloc
growth. TSS in the control was lower than in
other treatments because the control did not add
carbon, causing less biofloc.
In the 4th and 5th monitoring of the control
treatment, the water replacement by 20% in the
4th week and the 5th week also caused the
decrease of TSS. In the next monitoring, TSS
increased rapidly due to the more feed intake
and the biofloc decomposition, and TSS was
the highest in the 9th week. In the experimental
treatments, the biofloc sediment was then
removed and clean water was added. In the
control treatment, water was replaced by 50%
to reduce TSS, then TSS continued to rise
during feeding and adding carbon (figure 2).
The experiment result in table 2 and fig. 2
showed that the amount of TSS in the biofloc
system ranged from 16.6–560 mg/l, which was
consistent with the result of Azim and Little
(2008) [10]. TSS value in the treatments was
maintained less than 500 mg/l, which was within
the proposed limit of Emerenciano et al., [4].
225
Nguyen Xuanrise
Thanh
al. and adding carbon.
duringetfeeding
Figure 2: Variation of TSS in the experiment
Figure 2. Variation of TSS in the experiment
The experiment result showed that the amount of TSS in the biofloc system ranged from 16.6560 mg/L, which was consistent with the result of Azim and Little (2008) [10]. TSS value in the
treatments was maintained less than 500 mg/l, which was within the proposed limit of
Emerenciano et al., (2017) [4].
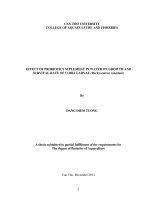
Figure 3: Variation of nitrite (mg/l) in the treatments
Figure 3. Variation of nitrite (mg/l) in the treatments
The monitoring result of nitrite (NO2-N)
(mg/l) in figure 3 showed that the nitrite ranged
from 0.01–0.84 mg/l. Nitrite tended to increase
in the very first weeks, then decreased in the 4th
week and increases in the 8th week, then
dropped and stabilized in the next weeks. The
amount of nitrite was maintained less than 1
mg/l, within the proposed limit of Emerenciano
et al., (2017) [4].
226
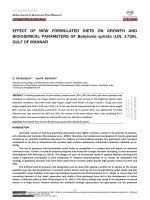
The monitoring result of nitrate (NO3-N)
(mg/l) in figure 4 indicated that the amount of
nitrate in the high density treatments was
higher than in the low density treatments. The
control treatment had higher nitrate than the
other treatments. Nitrate tended to rise in the
very first weeks, then decreased and increased
again in the 8th week, then dropped and
stabilized in the next weeks. The nitrate in the
Effects of stocking density on growth and survival
treatments ranged from 0.01–0.84 mg/l, which
was less than 20 mg/l within the proposed limit
of Emerenciano et al., (2017) [4].
Variation
nitrate (mg/l) in the treatments
Figure 4: Variation ofFigure
nitrate 4.
(mg/l)
in the of
treatments
The growth rate and the survival rate of
tilapia
The growth rate
The result in table 3 showed that, after 86
days of tilapia culture with BFT at different
densities, the average weight of tilapia in the
treatments I, II, III was 263.2 g/fish, 248.7
g/fish and 212.3 g/fish, respectively. The
growth rate of tilapia in the control treatment
with low density was higher than that in the
other treatments, the average weight of tilapia
was 269.4 g/fish.
The result in figure 5 and table 4 showed
that in the same BFT system with the
allowable environmental conditions, the
growth rate of fish in the low density
treatment was higher than that in the high
density treatment.
Table 3. The monitoring result of the growth rate of tilapia (gram)
Date of monitoring
Initial fish (2/5/2019)
1st (17/5/2019)
2nd (3/6/2019)
3rd (17/6/2019)
4th (3/7/2019)
5th ( 18/7/2019)
6th ( 26/7/2019)
I
2.22 ± 0.38a
6.3 ± 0.23a
23.1 ± 2.68a
74.1 ± 4.39ac
147.2 ± 5.54ac
194.3 ± 5.47ac
263.2 ± 4.2ac
II
2.23 ± 0.29a
6.1 ± 0.47a
22.9 ± 4.06a
72.4 ± 3.56a
144.5 ± 6.85a
191.7 ± 4.80a
248.7 ± 9.1a
III
2.25 ± 0.39a
5.9 ± 0.60a
18.3 ± 2.68a
65.3 ± 5.85b
121.3 ± 13.97b
160.4 ± 10.29b
212.3 ± 12.5b
IV
2.22 ± 0.29a
5.5 ± 0.35b
30.6 ± 7.34b
77.7 ± 9.05c
149.1 ± 8.07c
198.1 ± 9.03c
269.4 ± 5.1c
Notes: Values with different lowercase letters in the same row show statistically significant
differences (P < 0.05). Values with the same lowercase letters in the same row show no
significant difference (P > 0.05); I, II, III with BFT included I: 6 fish/m3; II: 8 fish/m3; III: 10
fish/m3; IV (control without BFT): 3 fish/m3.
227
Nguyen Xuan Thanh et al.
Figure 5. The growth of tilapia in the experiments
The result in table 4 showed that, after 86
days of tilapia culture with BFT at different
densities, the average SGR of tilapia in the
treatments I, II, III was 5.72 %.day-1, 5.62
%.day-1 and 5.43 %.day-1, respectively. The
average SGR of tilapia in the control treatment
was 5.71 %.day-1; The average DGR of tilapia
in the treatments I, II, III and IV (control
treatment ) was 3.13 g.day-1, 2.98 g.day-1, 2.55
g.day-1 and 3.27 g.day-1, respectively.
Table 4. Specific growth rate - SGR (%.day-1) and daily growth rate - DGR (g.day-1)
I
Days
14
16
15
15
15
11
TB
SGR
(%.day1)
8.69
8.66
7.77
4.58
1.85
2.76
5.72
II
DGR
(g.day-1)
0.34
1.12
3.40
4.87
3.14
6.26
3.19
SGR
(%.day-1)
8.39
8.82
7.67
4.61
1.88
2.37
5.62
DGR
(g.day-1)
0.32
1.12
3.30
4.81
3.15
5.18
2.98
III
SGR
DGR
(%.day-1)
(g.day-1)
8.03
0.30
7.55
0.83
8.48
3.13
4.13
3.73
1.86
2.61
2.55
4.72
5.43
2.55
IV
SGR
DGR
(%.day-1)
(g.day-1)
7.56
0.27
11.44
1.67
6.21
3.14
4.35
4.76
1.89
3.27
2.79
6.48
5.71
3.27
Notes: I, II, III with BFT included I: 6 fish/m3; II: 8 fish/m3; III: 10 fish/m3; IV (control without
BFT): 3 fish/m3.
The survival rate
The results showed that the survival rate of
tilapia was 100% in the treatments I, II (6
fish/m3 and 8 fish/m3) and it was 95.75% and
88.9% in the treatment III and in the control,
respectively. Tilapia cultured with BFT at 6
fish/m3 and 8 fish/m3 indicated the similar
survival rate of fish, which was higher than that
when cultured at 10 fish/m3 and without BFT
(figure 6).
228
The results in table 5 showed that after 86
days, the feed conversion ratio (FCR), daily feed
intake (DFI) and protein efficiency ratio (PER)
in treatments I and II were nearly equivalent.
FCR in the treatments I and II was less than that
in the treatment III and in the control treatment.
In the treatment I, the size of fish was more
uniform than that in the three remaining
treatments. The dry feed intake in the treatments
I, II, III, and control was 333.3 g/fish/86 days;
Effects of stocking density on growth and survival
312 g/fish/86 days; 275 g/fish/86 days and 416.7 gram fish/gram protein; 2.25 gram fish/gram
g/fish/86 days, respectively. The PER in the protein, 2.07 gram fish/gram protein; 1.83
3
at 10was
fish/m2.24
and without
BFT
(Fig. 6).
treatments I,higher
II, than
III that
andwhen
IVcultured
control
gram
fish/gram
protein, respectively.
Figure Figure
6. The6: survival
rate
tilapia
inexperiments
the experiments
The survival
rate of
of tilapia
(%)(%)
in the
Table 5. The criteria for evaluation of the stocking density after 86 days
Criteria
Initial weight (g/fish)
Final weight (g/fish)
FCR after 86 days
DFI (g/fish/86 days)
PER (g/g)
Productivity - 86 days (g/m3)
I
2.22 ± 0.38
263.2 ± 4.2
1.28
333.3
2.24
1579.2
Stocking density treatments
II
III
2.23 ± 0.29
2.25 ± 0.39
248.7 ± 9.1
212.3 ±12.5
1.27
1.38
312.5
275.0
2.25
2.07
1989.6
2016.9
IV
2.22 ± 0.29
269.4 ± 5.1
1.56
416.7
1.83
808.2
Notes: I, II, III with BFT included I: 6 fish/m3; II: 8 fish/m3; III: 10 fish/m3; IV (control without
BFT): 3 fish/m3.
CONCLUSIONS
The values of TAN, TSS, NO2, NO3 in the
treatments with high density tended to be
higher than in the treatments with low density.
The control with low density and without BFT
had TAN, NO2, NO3 higher and TSS lower than
with BFT.
The tilapia cultured with BFT in the
brackish water at treatment I (6 fish/m3) had
values of growth rate, survival rate, and PER
higher than those in the treatments II, III (8
fish/m3; 10 fish/m3). FCR of the tilapia cultured
with BFT was lower than that without BFT.
The study proposed that the density of
tilapia culture with BFT in brackish water is 6–
8 fish/m3. However, when applying BFT in the
production scale, it is necessary to find out the
appropriate farming model and improve
practical skills, monitoring and quick response
to the problem in the culture system.
Acknowledgements: The authors would like to
thank the project “Research on building an
intensive tilapia culture model in brackish
water with biofloc technology in Hai Phong
city”, Institute of Marine Resources and
Environment (IMER), Vietnam Academy of
Science and Technology (VAST) and Hai
Phong Department of Science and Technology
for the support to accomplish the research.
REFERENCES
[1] Avnimelech,
Y.,
2012.
Biofloc
Technology-A Practical Guide Book, The
World Aquaculture Society. Baton Rouge.
Louisiana. USA. 173 p.
[2] Bossier, P., and Ekasari, J., 2017. Biofloc
technology application in aquaculture to
support sustainable development goals.
Microbial Biotechnology, 10(5), 1012–
1016.
/>229
Nguyen Xuan Thanh et al.
[3] Crab, R., Defoirdt, T., Bossier, P., and
Verstraete, W., 2012. Biofloc technology
in aquaculture: beneficial effects and
future challenges. Aquaculture, 356, 351–
356. />2012.04.046.
[4] Emerenciano, M. G. C., MartínezCórdova, L. R., Martínez-Porchas, M.,
and Miranda-Baeza, A., 2017. Biofloc
technology (BFT): a tool for water quality
management in aquaculture. Water
Quality,
5,
92–109.
/>[5] De Schryver, P., Crab, R., Defoirdt, T.,
Boon, N., and Verstraete, W., 2008. The
basics of bio-flocs technology: the
added
value
for
aquaculture.
Aquaculture,
277(3–4),
125–137.
/>.02.019.
[6] Avnimelech, Y., 2007. Feeding with
microbial flocs by tilapia in minimal
discharge bio-flocs technology ponds.
230
[7]
[8]
[9]
[10]
Aquaculture,
264(1–4),
140–147.
/>.11.025.
APHA, 1998. Standard methods for the
examination of the water and wastewater
(22nd ed.), American Public Health
Association, Washington, D.C.
Hargreaves, J. A., 2013. Biofloc
production systems for aquaculture (Vol.
4503, pp. 1–11). Stoneville, MS: Southern
Regional Aquaculture Center.
QCVN 02-26: 2017/BNNPTNT National
technical regulation: Tilapia culture farm Technical requirement for veterinary
hygiene, environmental protection and
food safety.
Azim, M. E., and Little, D. C., 2008. The
biofloc technology (BFT) in indoor tanks:
water quality, biofloc composition, and
growth and welfare of Nile tilapia
(Oreochromis niloticus). Aquaculture,
283(1–4), 29–35. />j.aquaculture.2008.06.036.