effect of probiotics suplement in water on growth and survival rate of cobia larvae (rachycentron canadum)
Bạn đang xem bản rút gọn của tài liệu. Xem và tải ngay bản đầy đủ của tài liệu tại đây (855.83 KB, 42 trang )
CAN THO UNIVERSITY
COLLEGE OF AQUACULTURE AND FISHERIES
EFFECT OF PROBIOTICS SUPLEMENT IN WATER ON GROWTH AND
SURVIVAL RATE OF COBIA LARVAE (Rachycentron canadum)
By
DANG DIEM TUONG
A thesis submitted in partial fulfillment of the requirements for
The degree of Bachelor of Aquaculture
Can Tho, December 2012
1
CAN THO UNIVERSITY
COLLEGE OF AQUACULTURE AND FISHERIES
EFFECT OF PROBIOTICS SUPLEMENT IN WATER ON GROWTH AND
SURVIVAL RATE OF COBIA LARVAE (Rachycentron canadum)
By
DANG DIEM TUONG
A thesis submitted in partial fulfillment of the requirements for
The degree of Bachelor of Aquaculture
Supervisor
Assoc. Prof. Dr. TRAN NGOC HAI
Dr. LE QUOC VIET
Can Tho, December 2012
2
Acknowledgements
First of all, I wish to give my honest thank to Rectorate Board of Can Tho University,
lecturers and instructors of CAF and Auburn University who have facilitated for my
studying during 4.5 years in Can Tho city.
By my deep gratitude I would like to give my thanks to Assoc. Prof. Dr. Tran Ngoc Hai,
Dr. Le Quoc Viet and Mr. Tran Nguyen Duy Khoa who instructed me enthusiastically to
finish the thesis research.
For other valuable help and guide, thanks are extended to all my friends in brackish water
hatchery, Nguyen Thanh Trung, Huynh The Hien, Pham Nguyen Duy, Dao Khanh Au,
Nguyen Thi Tuyet Nhung and students of the course 35.
I wish to express my sincere gratitude to my advisor, Dr. Pham Minh Duc for his constant
guidance, and thanks to all my beloved classmates in Advanced Aquaculture Program
class for all great encouragement and kind help during 4.5 years in CAF.
Finally, I thank my family and all my friends who have supported and encouraged me to
study and finish my course.
3
Abstract
This study aimed to evaluate the effects of different dosages of probiotics
supplemented in water on growth and survival rates of cobia larvae (Rachycentron
canadum). A triplicated experiment was conducted with differrent treatments of
probiotics including the control (without probiotics); 0.5 mg/m3, 1 mg/m3, 2
mg/m3.The experiment was conducted in 500-L tanks holding with 2500 fry per
tank (5 larvae/L), and supplied aeration continuously. Brackishwater of 30ppt was
used for the experiment. Rotifer enriched with DHA, vitamin C and probiotics was
used to feed the larvae on 3 day-post-hatch (dph) to 10 dph at 10inds/ mL.
Beginning on the 7dph, umbrella Artemia were suplemently fed to cobia larvae at 24 inds/ mL, and on the 11 dph, enriched artemia nauplii were fed to larvae to the end
of the experiment. In addition, Chlorella algae were also supplied into the nursing
tank system every three days. Feeding frequency was mantained three times/day at
6:00am, 12:00am, and 6:00pm. Probiotics were applied to the experimental water
every 3 days. After 3 weeks of rearing, larvae from different treatments reach to
13.86 mm to 15.11 mm in body length. There was no significant difference in length
of cobia larvae among control and treatments (p>0.05). Survival rate of fry after 3
weeks of rearing was highest (5.61 %) in treatment with 1 mg/m3 of probiotic and
lowest (3.81%) in the control which is signigicantly different from another. In
conclusion, probiotics help improve water quality, survival rates; reduced size
variation of larvae, and relatively improved the growth of larvae. It is reccommeded
from this study is to apply probiotics 1g/m3 every 3 days. Further studies on the use
of probiotics and needed.
4
Table of Contents
Acknowledgements .......................................................................................................... i
Abstract ...........................................................................................................................ii
Table of contents ........................................................................................................... iii
List of Tables ................................................................................................................... v
List of Figures ................................................................................................................ vi
List of Abbreviations ....................................................................................................vii
CHAPTER I
INTRODUCTION 10
1.1 Background of the study
1.2 Objectives of the study
1.3 Content of the study 11
10
11
CHAPTER II
LITERATURE REVIEW
12
2.1. Biological features of cobia 12
2.1.1. Classification and taxonomy ........................................................................ 12
2.1.2. Habitat and distribution ................................................................................ 12
2.1.3. Morphology of cobia .................................................................................... 12
2.1.4. Food and nutrition........................................................................................ 13
2.1.5. Reproductivity ............................................................................................. 13
2.2 Overview about the status of cobia production and study in the world 14
2.2.1 Study background of cobia .............................. Error! Bookmark not defined.
2.3 Probiotics using status and study 14
CHAPTER III
METHODOLOGY 16
3.1 Time and location for research
3.2 Study materials
16
16
3.2.1 Equipments for study .................................................................................... 16
3.2.2 Water source ................................................................................................. 16
3.2.3 Feed .............................................................................................................. 16
3.3 Research methodology
19
3.3.1 Experiment systems ...................................................................................... 19
3.3.2 Experimental design ..................................................................................... 19
3.3.3 Feeding methods ........................................................................................... 19
3.3.4 Management and data collection ................................................................... 19
3.4 Statistical analysis 21
CHAPTER IV
RESULTS AND DISCUSSIONS
22
5
4.1 Environmental factors
4.2 Growth of larvae.
24
22
4.2.1 Growth in body length of fry ......................................................................... 24
4.2.2 Growth rates. ................................................................................................ 26
4.3 Variation in body length of larvae 26
4.4 Survival rates 28
CHAPTER V
CONCLUSIONS AND RECOMMENDATIONS
5.1 Conclusions 30
5.2 Recommendations 30
References 31
30
Appendex ..................................................................................................................... 26
6
List of Tables
Table 3.1: Biochemical composition of some zooplankton ............................................... 9
Table 3.2: Artemia composition ..................................................................................... 10
Table 3.3: Water quality monitoring methods ................................................................ 12
Table 4.1: Temperature and pH values in the cobia fry to juvenile experiment .............. 15
Table 4.2: Growth rate of cobia larvae during 21 days .................................................. 17
Table 4.3: Coefficience of variance of cobia larval length after 21 days of rearing ....... 19
7
List of Figures
Figure 4.1a: Variation of temperature during the culture period ..................................... 15
Figure4.1 b: Variation of TAN concentration during culture period ............................... 16
Figure 4.1.c: Variation of Nitrite concentration during culture period ............................ 16
Figure 4.2: Growth in body length of cobia larvae from different treatments during
culture period ................................................................................................................. 17
.Figure 4.3: Distribution in body length of cobia larvae from different treatments after 21
days of culture .............................................................................................................. .20
Figure 4.4: Survival rate of cobia larvae from different treatments after 21 days of culture
...................................................................................................................................... 21
8
List of Abbreviations
dph ............................................................ Day post hatch
ppt .................................................................. Part Per Thousand
CFU/g ............................................................. Colony Former Unit
DHA ............................................................... decos
DLG ............................................................... Daily Length Gain
SGR ................................................................ Specific Growth Rate
SR................................................................... Survival Rate
LC50............................................................... Lethal Concentration of 50% dead of organisms
CV .................................................................. Coefficience of Variance
HUFA ............................................................. High unsaturated Fatty Acid
PUFA ............................................................. Polyunsaturated Fatty Acid
UV .................................................................. Ultraviolet
Initial BLi…………………………………………………….. Initial Body Length
Final BLf……………………………………………………… Final Body Length
9
CHAPTER I
INTRODUCTION
1.1 Background of the study
In recent years, marine culture is developing in many countries as well as in Viet Nam.
However, technologies of marine aquaculture species production still maintain very new
activities. Among many marine species, cobia (Rachycentron canadum) is considered a
potential species for marine aquaculture.
According to Briggs (1960), Shaffer and
Nakamura (1989), cobia distributes world-wide and occur in many areas of tropical and
subtropical seas exclude the Eastern Pacific. Like other marine species such as sea bass,
salmon, grouper, cobia (Rachycentron canadum) is a popular species and being cultured
in many countries in the world. Similar to salmon culture industry, the cobia has a
potential to become a commercially high value marine culture species. Moreover, the
cobia has high tolerance to unfavorable conditions and potentials to be cultured in cages
in the open sea.
With the advantages of a long coastline (nearly 3260km), large exclusive economic zone
(more than 1 million km2) and very large area of brackish water surface area, Viet Nam
has a great potiential for brackish water and marine aquaculture.
In recent years, marine aquaculture in Vietnam has been developing very fast and a large
number of high quality juveniles is required. In order to satisfy this demand, many
research on seed production of sea bass (Lates calcarifer), grouper (Epinephelus spp) and
Cobia (Rachycentron canadum) have been conducted to develop technology for hatchery
production...
In the Mekong Delta, cage culture of Cobia has been developed in Kien Giang Province..
However, it still relies on wild seed collected from the sea. In order to contribute to
development of technology for Cobia seed production, this study on “Effect of probiotics
supplement in water on survival and growth rate of cobia (Rachycentron canadum)
larvae” was carried out.
10
1.2 Objectives of the study
The specific objectives are to evaluate the effects of probiotics to the growth and survival
rates of cobia larvae in order to determine suitable level of probiotics.
1.3 Content of the study
Study on the effect of probiotics supplemented in water on the growth and survival rate of
cobia (Rachycentron canadum) larvae.
11
CHAPTER II
LITERATURE REVIEW
2.1. Biological f
eatures of cobia
2.1.1. Classification and taxonomy
Cobia (Rachycentron canadum) is classified as the followed (Linnaeus, 1766):
Kingdom: Animalia
Phylum: Chrodata
Class: Actinopterygii
Order: Perciforms
Family: Rachycentridae
Genus: Rachycentron
Species: Rachycentron canadum
2.1.2. Habitat and distribution
Cobia, Rachycentron canadum is the only species belong to the Rachycentridae family.
Cobia is widely found living from the Indo-Pacific to the southern Atlantic Ocean. They
usually live in many different kinds of bottom such as: mud, sand, gravel, coral bottom
and even mangrove forest. Cobia are eurysaline within the salinity range of 22-44 ppt but
can be reared at salinity as low as 5 ppt. They usually live singly or in small school
(Kaiser and Holt, 2005)
Cobia usually live in the upper layer of water and can be caught in the shallow coral reefs,
over sea with gravel bottom or sometimes in the estuaries. They hunt for preys all days
and nights around the coral reefs with many mollusk shells and sandy bottom (Do Van
Khuong, 2011)
2.1.3. Morphology of cobia
12
Rachycentron canadum has a big size, elongated body, flatten head, mouth is terminal in
position and lower jaw is longer than upper jaw, gray color of skin with two row of white
color running along the body sides. They have small scales close to the skin, many single
small spines at the dorsal fin.
2.1.4. Food and nutrition
Cobia is a carnivorous species. They feed on other fish and crustacean (crabs, shrimp) and
other invertebrates. They grow fast and can be up to 3-5 kg for 1 year of culture. Cobia
may achieve the bigger size which can be 2m in length and 61 kg in weight. They can live
for 15year in the natural environment. The females were recorded to grow faster than the
males (Kaiser and Holt, 2005)
2.1.5. Reproductivity
Cobia get maturation after 2 years old (males 1-2 years and females 2-3years) with the
sizes are about 60-65 cm for males and 80 cm for females. They are fully mature after 4
years. The mature females spawn many times per year. In the spawning season, they
gather in small groups and start spawning in sea shore or open sea. The fecundity of
female in peak of spawning season was estimated from the range 377.000- 1.980.000
(Burns et al., 1998). Diameter of the eggs was around 1.4 mm; fertilized eggs will hatch
after 24 hours (FAO, 2009).
Spawning season was mainly from April to June, and the peak of spawning is on May..
GSI is around 8.1-9.2% (Do Van Khuong, 2011).
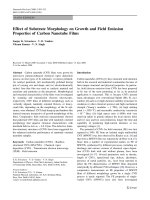
Picture 2.1.5: Cobia is cultured in tank at Brackish Water Hatchery of CAF.
13
2.2 Overview about the status of cobia production and study in the world
Cobia study was first conducted by collecting the wild cobia eggs in the off coast of North
Carolina (FAO, 1990). According to many studies, cobia is a significantly potential
species for aquaculture because of fast growth and good flesh quality. Then, many
researches about cobia grow out and reproduction was conducted from 1980-1990 in
USA. In 1997, technology to increase the survival rate of cobia larvae was developed in
Taiwan. Follow the trend of cobia culture, many countries in the world especially Asia
have started to concern and did research on juvenile production in hatchery and grow out
production in cages.
In Vietnam, studies on marine culture and hatchery are still limited, just begun from the
1990s. In 2005, the total production of marine production only achieved the number 3500
tons with some major species such as: groupers, sea bass, cobia…Comparing to the target
38 tons, it was not a very good result. In 2006, total juveniles production in hatchery just
reached 2 millions (Le Xan, 2005-2007, Nguyen Huu Dung, 2008 and Chang, 2008).
2.3 Probiotics using status and study
Elie Metchnikoff’s work at the beginning of this century is regarded as the first research
which conducted on probiotics (Fuller, 1992). Probiotics is described as microbes
ingested with the aim of promoting good health or other definition is organisms and
substances contribute to intestinal microbial balance ( Parker, 1974), and later Fuller
(1989) definition is a live microbial feed supplement which beneficially affects the host
animal by improving its intestinal microbial balance. Now, probiotis have been used in
aquaculture and the definition has also been modified. In the aquatic animal, not only the
digestive tract is important but also the surrounding water. Probiotics are defined as
microbial cells that are administered in such a way as to enter the gastrointestinal tract
and to be kept alive with the aim of improving health (Gatesoupe, 1999). In another
definition, probiotics were defined broadly by removing the restriction to the
improvement to the intestine: “a live microbial supplement which beneficially affects the
host animal by improving its microbial balance”
In aquaculture, there were many studies related to probiotics carried out. Effectiveness of
14
probiotics on aquatic animal was observed by Douillet (1993) and Douillet and Langdon
(1994) in enhancing survival and growth of Crassostrea gigas larvae. The effect of
probiotics containing lactic acid bacteria in the feed was conducted by Gildberg et al.
(1997) on the subject was Atlantic cod fry. Significant effect of Aquazyn TM-1
commercial probiotics on the water quality and growth of Cyprinus carpio was conducted
by Sharma and Bhukhar (2000). For crustaceans, study on probiotics effect on growth of
P. monodon was investigated by Otta et al., (1993) The digestive tract of fish contains a
much higher number of microorganisms than the surrounding water, as many as 108 cell
g-1 (Ringo et al., 1995). As a study of Hansen and Olafsen (1998) most important being
are Pseudomonas, Cytophaga and Flexibacter which were colonized in the
gastrointestinal tract of larvae.
Probiotics administration to fin fish growth and development as well as survival rate
positively is well documented (Gatesoupe 2008, Wang, et al., 2008). Generally, probiotics
administration during early developmental stages is the most effective (Gatessoupe,
2008). Probiotics is also well known to positively impact fish welfare (Kesarcodi- Watson
et al., 2008) by reducing the general stress response and promoting growth, as well as
increasing survival in overall.
In cobia seed production, there are many studies, among of these; studies related to
probiotics have been also conducted. Effects of dietary chitosan and Bacillus subtilis on
the growth performance, non-specific immunity and disease resistance of cobia
(Rachycentron canadum) were investigated (Xu Geng, Xiao- Hui Dong et al., 2011). The
study has shown that specific growth rate in the fish fed on dietary treatment was
significantly higher than that of the control fish (Xu Geng, Xiao- Hui Dong et al., 2011)
In Vietnam, marine species have just been studied since 1990 and is evaluated quite new
(Le Xan, 2005, 2007; Nguyen Huu Dung, 2008 and Chang, 2008). For cobia seed
production, many studies have just been carried out since 1998. Therefore, not so many
studies about probiotics are researched. However, process of cobia seed production is step
by step improved to supply seed to farmers and avoid importing seed from the foreign
countries.
15
CHAPTER III
METHODOLOGY
3.1 Time and location for research
- Time: from June to December, 2012
- Location: Brackish water hatchery, College of Aquaculture and Fisheries, Can Tho
University.
3.2 Study materials
3.2.1 Equipments for study
- Blowers, pumps, lights, microscope, petri dishes, spoons, notes, coverage, rackets,
scale, valves, pipes, air stones
- Thermometer Salinmeter, pH, NH3/NH4+, NO2/NO3+ and alkalinity test kits
- 0.5 m3 plastic tanks x 12 used for setting the experiments,
- Chemicals: Na2S2O3, EDTA, KmnO4, Chlorine, Formalin.
- Squid oil and vitamin C
3.2.2 Water source
-
Freshwater source was from the municipal tap water.
- Brine water (80-120ppt) were bought from Vinh Chau district, Soc Trang province,
then transported and stored in brackish water hatchery in College of Aquaculture and
Fisheries, Can Tho University. Chlorine was used (30 - 40 ppm) to disinfect the
brine water then aeration was applied continuously for at least 24 hours, after that
chlorine test kit was used to check excess chlorine concentration and thiosulfate
sodium was applied to neutralize before pumping through filter bag for using.
-
Brackish water was mixed from the freshwater and the brine water to achieve the
expected salinity (30‰).
3.2.3 Feed
16
-
Enriched rotifer (Brachionus plicatilis), Artermia (Vinh Chau and Thai Artermia)
and C
hlorella algae were used to feed the larvae. Biochemical composition of
rotifer and Artemia is documented as in Table 3.1 and 3.2.
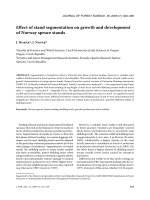
Picture 3.1: Rotifer ( Brachionus plicatilis) using in culture
Table 3.1: Biochemical composition of some zooplankton
( />
Zooplankton
Protein
Lipid
mineral
Energy
(kcal/kg)
Rotifer
64.3
20.3
9.2
8.86
Cladocera
56.5
19.3
7.7
4.8
Copepod
52.3
7.1
1.7
5.4
17
Table 3.2: Artemia composition
Composition
% Dry matter
Protein
49.6
Lipid
16.9
Carbohydrate
25.1
Ash
5.7
Fiber
2.7
- Using vitamin C products of Bayer Company.
- Probiotics (EM TAB probiotic) was used. Its composition contains bacteria and the total
bacteria count is (Bacillus subtilis, Nitrobacter sp, Nitrosomonas sp) over 1.5*109 CFU/g.
Picture 3.2: EM TAB Probiotics is used in water environmental tank
18
3.3 Research methodology
3.3.1 Experimental systems
The experiment was designed on a system of 12 plastic tanks (0.5m3), placed in an indoor hatchery and continuously aerated.
3.3.2 Experimental design
The experiment was conducted with three treatments with different dose of probiotics of
0.5mg/m3, 1mg/m3 and 2mg/m3 and one control treatment without probiotics. The
experiment was followed completely randomnized design (CRD). The experiment lasted
for 21 days.
Cobia larvae with innitial length of 3.00 -3.30 mm were stocked at density of 10 inds/L
(2500 fry/tanks). After transported from from Nam Du Island to Brackish water hatchery,
College of Aquaculture and Fisheries, Can Tho University, larvae were acclimated and
screened carefully before stocking.
3.3.3 Feeding methods
Rotifer enriched with DHA, vitamin C and probiotics, and Chlorella algae were used to
feed the larvae on 3 day-post-hatch (dph) to 10 dph at 10 inds/ mL. Beginning on the
7dph, umbrella Artemia were suplemently fed to cobia larvae at 2-4 inds/ mL, and on the
11dph, enriched artemia nauplii were fed to larvae to the end of the experiment. Feeding
frequency was maintained three times / day at 6:00am, 12:00am, and 6:00pm.
Probiotics was applied to rearing water every three days at different dosages according to
the treatments. Probiotic tablet was to grinded by a blender then soaked and aerated in the
water for 30 minutes before applying to the rearing tanks.
3.3.4 Management and data collection
During larval rearing, larval activities were observed everyday, and water was exchanged
30% every 10 days.
19
Table 3.3.4: Water quality monitoring methods
Water parameters
Sampling frequency
Equipment
pH
Once a week (7a.m and 5p.m)
Test kit
Temperature
2 times/ day (7a.m and 5p.m)
Thermometer
Nitrite
Once a week (7a.m and 5p.m)
Test kit
TAN
Once a week (7a.m and 5p.m)
Test kit
Nitrate
Once a week (7a.m and 5p.m)
Test kit
Salinity
Once a week (7a.m and 5p.m)
Salinmeter
Growth and survival rate of larvae:
Larvae samples from all rearing tanks were taken once a week (30 larvae / tank) to
measure body length and to define daily length gain (DLG) and specific growth rate in TL
(SGR) as the following formula.
DLG (mm/day) = (Lnitial – Linal)/t
SGR = (Ln Lfinal – Ln Linitial)/t x100%
For survival rates (SR), the survival rate was determined at the end of the rearing period
as the foloowing formula:
SR = (Nt ÷N0 ) * 100 %
Where L is body length, N is number of larvae, and t is culture duration (days)
20
3.4 Statistical analysis
Data collected was analized for mean value, standard deviation with excel software, and
using one -way ANOVA (DUNCAN) method with SPSS 16.0 for windows
21
CHAPTER IV
RESULTS AND DISCUSSIONS
4.1 Environmental factors
Variation of water quality parameters during the experiment was presented in Table 4.1.
The temperature fluctuated from 26.5 – 30 oC, and the average temperature was 27.44 ±
0.73 oC in the morning to 28.47 ± 0.92 oC in the afternoon for all the tanks during the
experiment. The pH was ranged from 9.03 ± 0.18 to 9.23 ± 0.10. Nitrite concentration
ranged from 1.33 ± 1.09 mg/L to 2.00 ± 1.73 mg/l, Nitrate value was from 21.67 ± 17.50
mg/L to 26.67 ± 21.79 mg/L and TAN ranged from 0.67 ± 0.25 mg/L to 0.87 ± 0.20 mg/L
. Genrally, temperature and pH values were not significantly different among the
treatments, however, the treatments applied with probiotics have lower level of Nitrite
concentration compared to the control, and the treatment with 1mg/L of probiotics gave
the lowest level which indicated the possible role of probiotics in controlling water
quality.
According to Boyd (1990), temperature ranges from 25 – 28 oC is suitable for fish, pH
should be from 6.5 to 9.0, nitrite value is from 0.1 to 1.7 mg/L and TAN is from 0.2 to 2
mg/l. Ricardo et al. (2007), reported that a high level of nitrite concentration will harm to
cobia juvenile. Suitable temperature for cobia is ranged between 29.4 to 31.8 oC (Benetti
et al., 2008). In general, environmental factors in this experiment were quite suitable for
cobia larvae. However, TAN value was high in week 3 and may affect on survival rate of
cobia larvae. Rodrigues et al., (2007) described that cobia juveniles ceased to eat at 0.62
(0.56 – 0.7 mg/L) and swimming behavior affected at higher concentration of 0.8 mg/L
NH3-N.
22
Table 4.1: Temperature and pH values in the cobia fry to juvenile experiment.
Water
Treatment
Control
0.5 mg/m3
1 mg/m3
2 mg/m3
pH (am)
9.17 ± 0.05
9.17 ± 0.10
9.03 ± 0.18
9.13 ± 0.05
pH (pm)
9.18 ± 0.04
9.23 ± 0.10
9.16 ± 0.05
9.17 ± 0.04
Nitrite (mg/l)
2.00 ± 1.73
1.72 ± 1.35
1.33 ± 1.09
1.67 ± 1.32
Nitrate (mg/l)
26.67 ± 21.79
27.22 ± 21.95
21.67 ± 17.50
23.33 ± 18.03
0.67 ± 0.25
0.76 ± 0.03
0.67 ± 0.33
0.87 ± 0.20
parameters
TAN (mg/l)
31
Temperature (degree C)
30
29
28
am
27
pm
26
25
24
23
1 2 3 4 5 6 7 8 9 10 11 12 13 14 15 16 17 18 19 20 21
Time(day)
Figure 4.1a: Variation of temperature during the culture period.
23
1.20
TAN(mg/l)
1.00
0.80
control
T1
0.60
T2
T3
0.40
0.20
0.00
7
14
21
Time(day)
Nitrite (mg/l)
Figure 4.2 b: Variation of TAN concentration during culture period
4.50
4.00
3.50
3.00
2.50
2.00
1.50
1.00
0.50
0.00
Control
T1
T2
T3
7
14
21
Time (day)
Figure 4.1 c Variation of Nitrite concentration during culture period
4.2 Growth of larvae
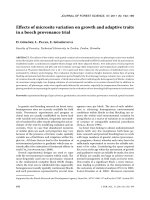
4.2.1 Growth in body length of fry
Body length of larvae increased to from 3.13 ± 0.11 to 5.56 ± 0.24 (mm) after one week
of nursing, 10.73 ± 1.15 to 11.64 ± 0.70 (mm) after 2 weeks, and 13.86 ± 1.49 to 15.11
24
± 1.70 mm after 3 weeks of experiment. The results showed that the treatments with
probiotics gave relative better results in growth of larvae compared to the control,
however, there was no significant difference in body length of larvae among the
treatments (p>0.05). In this stage of nursing, cobia fry had a fast growth and probiotics
concentration had no effect on length gain. Daniel D.Denetti et al,(2008) had studied on
intensive larval husbandry and fingerling production of cobia showed that cobia fry’s
lengths were ranged form 1.5 to 2.0 cm at 20 -22 dph. Hassler and Rainville (1975)
pointed out that growth was faster when larvae fed on wild zooplankton (mostly
copepods) compared to rotifer and Artermia sp (~ 1mm/day) in green water culture. Liao
et al., (2009) reported that cobia fry could achieve 6 cm at 20 dph when cobia fry had
been reared in fertilized pond. In this study, growth of larvae were relatively lower than
those from other studies.
18.00
a
16.00
a
a
a
Length (mm)
14.00
a a a a
12.00
Control
10.00
0.5g/m3
1g/m3
8.00
a a a a
6.00
4.00
2g/m3
a a a a
2.00
0.00
1
7
14
21
Time( day)
Figure 4.2: Growth in body length of cobia larvae from different treatments
during culture period.
25