Oil film pressure of journal bearing with oil suply hole located in the housing concerning cavitation
Bạn đang xem bản rút gọn của tài liệu. Xem và tải ngay bản đầy đủ của tài liệu tại đây (1.06 MB, 5 trang )
SCIENCE - TECHNOLOGY
P-ISSN 1859-3585 E-ISSN 2615-9619
OIL FILM PRESSURE OF JOURNAL BEARING WITH OIL SUPLY
HOLE LOCATED IN THE HOUSING CONCERNING CAVITATION
ÁP SUẤT MÀNG DẦU Ổ TRƯỢT VỚI ĐƯỜNG CẤP DẦU TRÊN BẠC CÓ TÍNH ĐẾN SỰ XÂM THỰC
Tran Thi Thanh Hai*,
Le Anh Dung, Dang Vu Vinh
ABSTRACT
During the operating, the lubricated oil film pressure of hydrodynamic
bearing is varied under the load apply and under the rotation speed. This
pressure is one important characteristic when studying the lubrication problem
for the bearing. An experimental device and the journal bearing are used to
determine the pressure and the temperature of the lubricated oil film. The load is
applied on the housing bearing. The journal bearing is subjected to different
applied load at different velocities. Lubricant oil is circulatingly supplied via oil
supply hole in the housing. The oil film pressure is calculated by numerical
modelization with Reynolds condition taking into account cavitation and also
experimental measured by the pressure sensor with the same applied load. The
calculated pressure and measured pressure of the oil film are agreement with
the applied load. The calculated oil film pressure is corresponded to the
measured pressure; however, the two types of results have a difference in value.
As the load increase, the difference between the numerical modelization results
and experimental results of maximum pressure increase significantly. When the
rotation speed increases, the maximum pressure decreases, the minimum
pressure in calculating increases and minimum pressure in experimenting is
slightly varied.
Keywords: Journal bearing, oil film pressure, cavitation, oil supply hole.
TÓM TẮT
Trong quá trình làm việc, áp suất màng dầu bôi trơn của ổ thuỷ động thay
đổi dưới tác dụng của tải trọng và tốc độ quay. Áp suất này là đặc tính quan trọng
khi nghiên bài toán bôi trơn cho ổ. Một thiết bị thực nghiệm với một ổ đỡ thuỷ
động được sử dụng để xác định áp suất và nhiệt độ màng dầu bôi trơn. Ổ đỡ chịu
tải tác dụng và vận tốc khác nhau. Dầu bôi trơn được cấp tuần hoàn thông qua lỗ
cấp dầu đặt trên bạc. Áp suất màng dầu tính toán mô phỏng với điều kiện biên
Reynolds có tính đến sự xâm thực và thực nghiệm đo thông qua cảm biến áp suất
với cùng tải tác dụng. Áp suất màng dầu tính toán tương đồng với áp suất thực
nghiệm nhưng khác nhau về giá trị. Khi tăng tải, sự sai khác giữa áp suất lớn nhất
tính toán và áp suất lớn nhất thực nghiệm tăng nhiều. Khi tốc độ quay tăng, áp
suất lớn nhất giảm, áp suất nhỏ nhất khi tính mô phỏng giảm còn áp suất nhỏ
nhất khi thực nghiệm thay đổi ít.
Từ khóa: Ổ trượt, áp suất màng dầu, xâm thực, lỗ cấp dầu.
School of Mechanical Engineering, Hanoi University of Science and Technology
*
Email:
Received: 10 May 2020
Revised: 20 June 2020
Accepted: 24 June 2020
Website:
1. INTRODUCTION
The lubricated oil film pressure of hydrodynamic bearing
is varied during the operating under the static or dynamic
load. Hydrodynamic journal bearing based on hydrodynamic
lubrication, which can be described as the load-carrying
surfaces of the bearing are absolutely separated by a thin
film of lubricant in order to prevent metal-to-metal contact.
In 1991, Pai and Majumdar [1] analyzed the stability
characteristics of submerged plain journal bearings under a
unidirectional constant load and variable rotating load. In
1999, Raghunandana and Majumdar [2] analyzed the effects
of non-Newtonian lubricant on the stability of oil film journal
bearings under a unidirectional constant load. In 2000,
Kakoty and Majumdar [3] analyzed the stability of journal
bearings under the effects of fluid Inertia, the next year, Jack
and Stephen [4] reviewed the theory of finite element
applied on elasto-hydrodynamic lubrication. In 2012, Salmial
et al. studied the experimental pressure distribution around
the circumference of a journal bearing and experimental
fluid frictional force of the bearing cause by shearing action.
The results were compared to predicted values from
established Raimondi and Boyd charts. The maximum
pressure value is higher than the theoretical maximum
pressure value. Fiction coefficients of oil lubricant decrease
when the load increases. In 2019, Tran Thi Thanh Hai [6]
presented a solution for measuring the oil film pressure of
the connecting-rod big end bearing. The housing carries the
pressure sensor and can rotate 15 degrees to measure the oil
film pressure at the 24 different positons of bearing with the
crank angle. 2020, Le Anh Dung et al. [7] simulated the
equilibrium position of hydrodynamic bearing by using finite
element method to solve Reynold equation in static load
condition. The results show that, the more loads applied, the
distance from the calculated equilibrium position to the
journal center gets farther. Within the increase of the
Sommerfeld number values, the equilibrium position moves
closer to the y-axis. The faster journal rotation speed makes
the balance point closer to the journal center.
In this study, we present the numerical modelization and
experimenting of oil film pressure in the journal bearing at
the different working regimes. The oil film pressure is
determined by numerical modelization with Reynolds
Vol. 56 - No. 3 (June 2020) ● Journal of SCIENCE & TECHNOLOGY 63
KHOA HỌC CÔNG NGHỆ
P-ISSN 1859-3585 E-ISSN 2615-9619
condition taking into account cavitation and also measured
by the pressure sensors with the same applied load.
2. NUMERICAL MODELIZATION
2.1. Journal bearing and the equations
The lubrication problem of the hydrodynamic bearing is
solved based on solving the Reynolds equation, the oil film
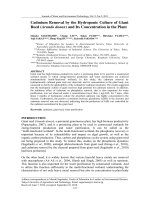
thickness equation at the dynamic regime. Fig. 1 is the
middle section according to the length of the bearing. The
load W is applied on the housing bearing. Oil supply hole is
located on the housing and at the angle 45o respected to
the load direction. At the symmetric position is the oil
return hole. The diameter of these holes is 5mm.
With the dimensionless parameters:
x
z
h
p
θ = ; = ; H = ;P =
R
R
C
R
6μω C
where: R is the radius of bearing, C is the radial
clearance, is the angular velocity.
We obtained the dimensionless Reynolds equation:
+
=
(2)
The film thickness equation:
H θ ' 1 ε x cos θ ε y sinθ ; is the eccentricity ratio. (3)
The forces acting on the oil film is represented by the
following formula:
Fx ( x , y )
f
Fy ( x , y )
P. cosθdθdζ
wx
w
P.sinθdθdζ wy
(4)
with u ( x , y ) is the vector (ɛx, ɛy), f is the vector of the
hydrodynamic force, w is the vector of the external force,
Fx, Fy, wx and wy are respectively the hydrodynamic force
and external force along x and y axis.
2.2. Discretization of the Reynolds Equation
The film is discretized by quadrangular elements with
four nodes (Figure 3).
The pressure at the point in the element is calculated:
Figure 1. Plane section of bearing
The Reynolds equation is [8]:
h
+
h
= 6μv
n
T
P PN
i i P Ni
(1)
where: p is the oil film pressure, h is the oil film
thickness, v is the velocity of journal, is the dynamic
viscosity of lubricated oil, x and z are circumference and
bearing length direction.
The boundary conditions used to solve the Reynolds
equation are based on the separation of the active zone
and inactive zone (cavitation zone) o. In the active zone,
the pressure is established and equilibrated with the
applied load. In the inactive zone, the pressure (pcav) is
lower than the atmospheric pressure. The Figure 2 presents
the active zone and inactive zone in the film domain.
- Active zone: p > pcav
- Inactive zone: p = pcav ; pcav < 0
(5)
i1
with N is the shape function.
Figure 3. Solid surface mesh
Thus Pe Ni Pi and the left side of the (2) is written
as:
VT
Me
Ni
θ
Se
3
H
e
Se
3
He
Ni
θ
Ni Ni
ζ
ζ
P dθdζ
i
P dθdζ
i
where “e” is representative for each element.
The right side of the (2) is:
VP Be Ni .
Figure 2. The active zone and the inactive zone in the film domain
64 Tạp chí KHOA HỌC VÀ CÔNG NGHỆ ● Tập 56 - Số 3 (6/2020)
Se
He
dSe
θ
Website:
SCIENCE - TECHNOLOGY
P-ISSN 1859-3585 E-ISSN 2615-9619
Assemble the elements we obtain the equation for the
whole mesh:
M.P = -B
(6)
where M is stiffness matrix and B is the “load vector”.
By solving (3), we obtain the pressure for the oil film.
(k 1)
u
(k )
(k )
u Ju1f (u) f (u ) w
(13)
3. EXPERIMENTAL MEASURMENT OF OIL FILM PRESSURE
3.1. Experimental device
2.3. Discretization of the Equilibrium of the Charge
Substitution (5) into the left-side of (4), we have:
T
P N. cos θdθdζ
f
F ( x , y )
P N. sinθdθdζ
F ( x , y )
x
(7)
T
y
In the formula (7), we take:
S
N. cosθdθdζ;R N.sinθdθdζ
(8)
Jacobian matrix of the force vector:
F ( x , y )
x
J f (u)
F ( x , y )
x
x
u
y
Fx ( x , y )
F ( x , y )
y
y
(9)
y
where x and y are the coordinate axis located on journal
center according to Figure 1.
Replace (8) into (9), we get:
T
where Px
T
S P
T
S
Ju f (u) T Px
R
x
S Py
R P
R Py
Py
T
T
x
P
P
;Py
x
y
Rewrite (3) as:
M( x , y )P B( x , y )
(10)
Derivative (9) respect to the components x, y we
obtain:
M Px , Py Mx P B x , My P By
where M x
M
x
M
,My
y
;B x
(11)
B
x
;By
B
y
B
B
x N sinθdθdζ, y N cos θdθdζ
M
N N N N
H cos θ
(12)
dθdζ
θ θ ζ ζ
x
M
N N N N
H sinθ
d θ d ζ
y
θ θ ζ ζ
Solving the system of (11), we get the vector ( Px , Py ).
i
i
i
i
ij
2
j
i
j
i
ij
2
i
j
i
j
Substitute it into (9) to obtain the Jacobi matrix Ju f (u) .
Then the vector u ( x , y ) is calculated from the
interpolation steps according to the following formula:
Website:
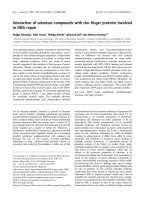
Figure 4. Functional scheme and photography of experimental device
The experimental device used in this study respects the
kinematics of bearing, including a shaft and a housing. The
photography and functional scheme of the experimental
device are presented on Figure 4. An electric motor (2) with
transmits motion to the shaft (3) through the belt (4). The
shaft is supported by two pillow blocks (5). The shaft, the
housing bearing (6) and the oil film created when the shaft
rotates together form the journal bearing in this study. The
pressure sensors (12) are attached on the bearing to
capture the real pressure in time at the different positions
along the perimeter of the middle section of the bearing.
The oil feed hydraulic system which consists of the oil tank
(7), the oil pump (8), the directional controlling valve (9),
the flow control valve (10), the pressure gauge (11), oil feed
pipe and oil return pipe. However, the housing bearing can
slightly rotate within rotating direction of the journal.
This experimental device is used to research lubricated
condition of hydrodynamic bearing at different operating
regimes. Electric motor power is 0.55kW, rotational speed is
1390rpm and driven by an inverter. Belt transmission ratio
is 1/2, so that rotation speed range of studied bearing is
from 0 to 695rpm. Position of two pulleys are
interchangeable to make the ratio becomes 2, which
means the rotation speed range is 0 to 2780rpm. Load is
apply on the housing by hanging weights.
The dimensions of the bearing as follows: length of the
bearing L= 50mm, diameter of the bearing D = 70mm,
precision of the shaft surface is up to 8 level, precision of
the housing up to 6 level, the radial clearance C = 0.05mm;
lubricated oil with viscosity = 0.015Pa.s; the density
= 850kg/m3.
The Figure 5 shows the studied journal bearing. The part
of the shaft, which its diameter D and length L, play the role
as the journal of the journal bearing. During operation, the
journal center is supposed to be unmoved and the housing
Vol. 56 - No. 3 (June 2020) ● Journal of SCIENCE & TECHNOLOGY 65
KHOA HỌC CÔNG NGHỆ
P-ISSN 1859-3585 E-ISSN 2615-9619
center position is changed which makes the distance
between these two centers varies depend on the value of
applied load. The lubricated oil film pressure is measured at
five different positions A1, A2 A3, A4, A5 on the middle crosssection in the middle of the bearing according to the
perimeter by five pressure sensors (Fig.6) [9].
170
200
300
9.16
42.37
73.66
77.1
13.36
400
8.42
41.62
71.50
74.31
14.57
600
7.51
39. 34
72.08
70.16
15.32
300
12.41
47.19
88.17
85.50
16.79
400
11.08
52.51
82.50
84.62
18.22
600
9.54
54.03
85.58
82.90
19.39
Fig. 7 shows the numerical modelization pressures at
the middle cross-section in the middle of the bearing
according to the perimeter, the load of 200N and the
velocities of 300rpm, 400rpm and 600rpm. It shows that,
the pressure is positive in the charge zone, from 0o to 210o
of the housing bearing. When the rotation speed increases,
the maximum value pressure is decreases and the zone
pressure is larger. It can be explained that the minimum
film thickness increases when the velocities increase.
Figure 5. Journal bearing study
Figure 6. Pressure sensor location
3.2. Experimental method
The pressure of the oil film is measured at different
working regimes with the loads 140N, 170N, 200N and
velocities 200rpm, 400rpm, 600rpm. After starting the
experimental device for 10 minutes, the first measurement
is read, and after that the break time between
measurements is 15 minutes. For each load level or
velocity, the measurements were recorded eight times. The
measurement results were analysed by using technique for
analysis of experimental data by Minitab software.
4. THE RESULTS
With the algorithm presented in part 2, we program on
Fortran software. The lubricated oil film pressure of the
journal bearing is calculated and also measured with the
same applied load. The table 1 presents the oil film
measurement pressure at different loads and at different
rotational frequencies. These pressure values are obtained
by the experimental data process. Five pressure value p1,
p2, p3, p4, p5 are the oil film pressure at five positions A1, A2,
A3, A4, A5.
Table 1. Measured oil film pressure at different load and at different velocities
Load Velocity Oil film pressure at positions A1, A2 A3, A4, A5 (KPa)
(N)
(rpm)
p1
p2
p3
P4
P5
140
300
7.58
41.13
64.69
63.05
15.5
400
8.12
43.41
61.53
61.93
17.2
600
6.98
40.02
57.74
58.78
16.61
66 Tạp chí KHOA HỌC VÀ CÔNG NGHỆ ● Tập 56 - Số 3 (6/2020)
Figure 7. Calculated pressure (MR) at the different rotation speeds, load
W = 200N
Figure 8. Comparision the oil film pressurebetween the calculated results
(MR) and measured results (ER) at the load W = 140N, 300rpm
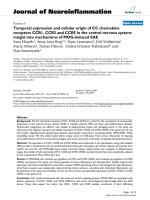
Figure 8 represents a comparison between numerical
modelization pressure and measured in experiments at the
load of 140N and velocity of 300rpm. When the bearing
works, the bearing housing rotates an angle from the original.
It means, the sensor positions also rotate an angle with the
housing bearing. We note, the good agreement on the film
pressure. However, the maximum pressure in the calculated is
66.5kPa at 117o of boring, the maximum in experiment is
64.69kPa at the 105o. That can be explained, the maximum
pressure position of oil film is not the same as the position of
Website:
SCIENCE - TECHNOLOGY
P-ISSN 1859-3585 E-ISSN 2615-9619
pressure sensor. It means, the pressure reaches the maximum
value at a position in the range from A3 to A4. The real
maximum value of pressure is not measured.
Figure 9. Comparision oil film pressure between the calculated results (MR)
and measured results (ER) at the different load applied, 300rpm
Figure 10. Comparision the oil film pressure between the calculated results
(MR) and measured results (ER) at the load W = 200N,300rpm
Fig. 9 shows a comparison of oil film pressure in
calculation and in experiment at different applied loads
and journal speed of 300rpm. It shows that, the more load
applied, the greater difference in in maximum value
between the of calculated pressure and measured pressure.
At the loads of 140N, 170N and 200N, the maximum
pressure of experiment is corresponding to 64.69kPa,
77.1kPa, 88.17kPa and the numerical result is 65.5kPa,
83.25kPa, 96.03kPa. Thus, it remains to suppose that the
experimental device has an imperfection of operation
which is not considered the numerical simulation. The
minimum pressure is slightly varied.
Fig. 10 represents a comparison between the oil film
pressure in numerical simulation and measured at the
different rotational frequencies for the load applied of
200N. The maximum pressure values decrease when the
velocity increases. However, the decrease in maximum
calculated pressure value is less than the decrease in
experimental value. At the rotational frequencies of
300rpm, 400rpm, 600rpm, the maximum calculated
pressures are corresponding to 98.63kPa, 97.2kPa, 96.01kPa
and the experimental results are 88,17kPa, 84.62 KPa, 85.58
KPa respectively. The minimum pressure is slightly varied.
Website:
5. CONCLUSION
This research presents the numerical modelization
pressure and the experimental pressure of the lubricated
oil film for the journal bearings with circulating oils.
Lubricant oil is supplied via oil supply hole in the housing.
The pressure is calculated based on solving the Reynolds
equation taking into account cavitation condition and the
oil film thickness equation, and the equilibrium of the
charge equation which are discretized by a finite element
mesh and are solved by using Newton-Raphson iterations.
The measured pressure of the oil film is determined at five
different positions on the cross-section in the middle of the
bearing according to the perimeter by pressure sensors.
The results show the good agreement on the film
pressures. The pressure is positive in the charge zone, from
0o to around 210o of the housing bearing. However, the
more load applied, the greater difference in value between
the maximum of calculated pressure and measured
pressure. Thus, it remains to suppose that the experimental
device has an imperfection of operation which is not
considered in the numerical simulation. The minimum
pressure is slightly varied.
The maximum pressures decrease when the velocity
increases and the pressure zone is larger. However, the
decrease in experimental pressure is more than the
decrease in calculated pressure. The minimum pressure is
slightly varied.
REFERENCES
[1]. Pai R., B.C. Majumdar, 1991. Stability analysis of flexible supported rough
submerged oil journal bearings. Tribol. T., 40(3), 437-444.
[2]. Raghunandana K., Majumdar B. C., 1999. Stability of Journal Bearing
Systems Using Non-Newtonian Lubricants: A Non-Linear Transient Analysis. Tribol.
Int., 32, pp. 179-184.
[3]. Kakoty S.K., B.C. Majumdar, 2000. Effect of fluid inertia on stability of oil
journal bearings. ASME J. Tribol., 122, 741-745.
[4]. Salmiah K, Mohamad Ali Ahmad, Rob-Dwyer Joyce, Che Faridah Mat
Taib, 2012. Preliminary study of Pressure Profile in Hydrodynamic Lubrication.
Journal Bearing. Procedia Engineering 41 (2012), 1743-1749.
[5]. Tran Thi Thanh Hai, 2018. A solution for measuring the oil film pressure of
the connecting-rod big end bearing in the experimental device. Journal of Science
and Technology-The University of Danang, No. 11(132).2018, Vol. 1, pp 22-25.
[6]. Le Anh Dung, Tran Thi Thanh Hai, Luu Trong Thuan, 2020. Numerical
modelization for equilibrium position of a static loaded hydrodynamic bearing.
Journal of Science and Technology Technical university, No.141 (2020), pp 28-33.
[7]. Bonneau D., Fatu A., Shouchet D., 2014. Hydrodynamic Bearings. ISTE,
London and John Wiley & Sons, New York.
[8]. Pham Trung Thien, Tran Thi Thanh Hai, 2016. Development a supervise
system of pressure and temperature for journal bearing. Master thesis, Hanoi
University of Science and Technology.
THÔNG TIN TÁC GIẢ
Trần Thị Thanh Hải, Lê Anh Dũng, Đặng Vũ Vinh
Viện Cơ khí, Trường Đại học Bách khoa Hà Nội
Vol. 56 - No. 3 (June 2020) ● Journal of SCIENCE & TECHNOLOGY 67