Risk of second primary Cancer among bladder Cancer patients: A populationbased cohort study in Korea
Bạn đang xem bản rút gọn của tài liệu. Xem và tải ngay bản đầy đủ của tài liệu tại đây (705.43 KB, 9 trang )
Kwon et al. BMC Cancer (2018) 18:617
/>
RESEARCH ARTICLE
Open Access
Risk of second primary Cancer among
bladder Cancer patients: a populationbased cohort study in Korea
Whi-An Kwon1†, Jae Young Joung1†, Jiwon Lim2, Chang-Mo Oh2, Kyu-Won Jung2, Sung Han Kim1, Ho Kyung Seo1,
Weon Seo Park1, Jinsoo Chung1, Kang Hyun Lee1 and Young-Joo Won2*
Abstract
Background: For the expanding population of bladder cancer survivors in Korea, the development of subsequent
cancers is a significant concern. Here, we provide the second primary cancer incidence rates and types in Korean
patients with bladder cancer.
Methods: Using population-based data from the Korea Central Cancer Registry from 1993 to 2013, we studied the
standardized incidence ratios among 48,875 individuals with an initial diagnosis of bladder cancer. Standardized
incidence ratios for second primary cancers were evaluated according to age at diagnosis, latency, diagnostic year,
and treatment.
Results: Over the same period, the overall risk of a second primary cancer was reduced by 6% in patients with
bladder cancer compared with the development of a new malignancy in the general population (standardized
incidence ratio = 0.94; 95% CI, 0.91–0.97, p < 0.05). For specific cancers, the standardized incidence ratios for
stomach, colon, liver, and non-Hodgkin lymphoma were significantly lower in patients with bladder cancer.
However, the risk of prostate and kidney cancer in patients with bladder cancer were significantly increased. The
risk of lung squamous cell carcinoma and lung adenocarcinoma as second primary cancers was significantly
elevated in patients with bladder cancer.
Conclusion: Korean patients with bladder cancer have a 6% lower risk of developing a second primary cancer.
However, they have a higher risk of developing subsequent prostate and kidney cancers, lung squamous cell
carcinoma, and lung adenocarcinoma, suggesting the need for continual intensive cancer surveillance among
bladder cancer survivors.
Keywords: Bladder cancer, Second primary cancer, Prognosis, Incidence, Survival
Background
Bladder cancer (BC) is the 9th most frequent cancer
worldwide [1] and the number of BC cases increased
from 2180 in 1999 to 3549 in 2011, with 37,950 total
cases during this period in Korea [2]. Moreover, according
to the Korea Central Cancer Registry (KCCR) report, 3949
new BC cases were diagnosed in 2014, with 7.8 cases per
100,000 person-years [3].
* Correspondence:
†
Whi-An Kwon and Jae Young Joung contributed equally to this work.
2
Cancer Registration and Statistics Branch, National Cancer Center, Goyang,
Korea
Full list of author information is available at the end of the article
There is a long-term survival concern in patients with
BC, especially those with second primary cancer (SPC).
For Western patients, compared with the general population, BC survivors are more likely to develop SPCs,
which frequently occur in the lungs or neck [4, 5].
However, to our knowledge, no studies have evaluated
SPC among Asian patients with BC. Although, we have
previously detailed the overall risk of SPC development
in Korean patients with prostate cancer and kidney
cancer [6, 7]. Therefore, we were also interested in
studying SPC in patients with primary BC.
The purpose of this population-based cohort study
was to calculate the incidence of SPC in Korean patients
© The Author(s). 2018 Open Access This article is distributed under the terms of the Creative Commons Attribution 4.0
International License ( which permits unrestricted use, distribution, and
reproduction in any medium, provided you give appropriate credit to the original author(s) and the source, provide a link to
the Creative Commons license, and indicate if changes were made. The Creative Commons Public Domain Dedication waiver
( applies to the data made available in this article, unless otherwise stated.
Kwon et al. BMC Cancer (2018) 18:617
with BC and to estimate the effect of SPC on survival
using a nationwide population-based cancer registry.
The primary goal was to produce useful data for managing patients with BC.
Methods
Study population and data collection
A total of 48,875 patients diagnosed with BC were evaluated between 1993 and 2013 as documented in the KCCR.
The KCCR gathers information on ~ 80–90% of cancer
cases across 180 hospitals across South Korea. In 1999,
the scope of the KCCR was expanded to cover the entire
South Korean population using the Population-Based
Cancer Registry Program [8].
To ensure that SPC remains distinct from primary BC
recurrences and metastases, the KCCR uses coding rules
based on the histological or topographical classifications
of the International Classification of Diseases for
Oncology 3rd edition [9] and the International Agency
for Research on Cancer (IARC) rules for multiple
primary cancer in 2004 [10]. The IARC classifies cancer
as an SPC when a primary tumor has a different histological type or anatomical site from the indexed cancer.
KCCR data includes patient information (age at the time
of diagnosis and sex), cancer information (diagnosis
date, tumor site, histology, and surveillance, epidemiology, and end results [SEER] summary stage), and
primary treatment information (surgery, chemotherapy,
or radiotherapy).
The first primary BC included patients with a single
primary BC and the first BC in patients with multiple
primary cancers. We excluded the following first
primary BC cases: 1) age at diagnosis, unknown; and 2)
BC reported at death. In addition, because SPCs diagnosed within two months of the first primary cancer
diagnosis are considered synchronous, these cases were
excluded to reduce the misclassification of undetected
synchronous cancers and metastases.
Ethical approval for the research protocol was provided by the institutional review board of the National
Cancer Center (NCC2017–0182).
Statistical analyses
Standardized incidence ratios (SIR) were used to compare the relative risk of the SPC incidence rates with
those of the general population at baseline. We estimated cancer incidence for each cancer type according
to age at diagnosis, latency, and diagnostic year, which
was multiplied by the cumulative number of years at risk
to calculate the number of cancer outbreaks expected
for each stratum. SIR was estimated by dividing the
observed number of SPCs in patients with BC by the
number of patients at risk of developing a new malignancy in the general population. The 95% confidence
Page 2 of 9
intervals for the SIRs were estimated using Byar’s exact
approximation to the accurate Poisson distribution of
the observed number. The person-years at risk were
calculated from two months after the initial BC diagnosis until death, the date of last known survival, or the
study completion date (December 31st, 2013).
Results were classified based on age at the time of initial diagnosis with BC (0–39, 40–59, or ≥ 60 years), year
of first BC diagnosis (1993–2000 or 2001–2013), latency
time among first BC diagnosis and subsequent primary
cancer (< 12 months, 12–59 months, 60–119 months,
or ≥ 120 months), and treatment type (surgery vs.
non-surgery, chemotherapy vs. non-chemotherapy, and
radiotherapy [RT] vs. non-RT).
Survival curves using the Kaplan-Meier method were
calculated for BC patients with or without a subsequent
cancer. The log-rank test was employed to verify the
difference between groups of survival curves. All of the
statistical tests were determined statistically significant
at P-value < 0.05, and were two-sided. The SIR and 95%
CI calculations were performed using SEER*Stat
(seer.cancer.gov/seerstat, version 8.3.4). Survival analyses and log-rank tests were performed using STATA
(StataCorp LP, version 12.1).
Results
We obtained data from 48,875 patients, including 39,351
men (80.5%) and 9524 women (19.5%), with a median
age at diagnosis of 67 years. The cohort characteristics
are shown in Table 1. The overall SPC risk decreased by
6% in patients with previous BC compared with that in
the general population over the same period (SIR = 0.94;
95% CI, 0.91–0.97). Patients examined within one year
of BC diagnosis exhibited an increased risk of all subsequent cancers (SIR = 1.21). Patients who were followed
up for 1–5 years showed a SIR risk reduction of 0.89.
Finally, after a ≥ 10-year follow-up, the SIR decreased to
0.86. Patients aged < 40 years at BC diagnosis were more
likely to have all SPC types (SIR = 1.50); whereas, those
aged 40–59 or ≥ 60 years at diagnosis exhibited a reduced SPC incidence (SIR = 1.04 and 0.90, respectively).
Two periods were analyzed (1993–2000 and 2001–2013)
to evaluate the potential impact of changes in diagnosis
and treatment. SPC incidence differed between these
two periods (SIR = 0.85 and 0.99, respectively; Table 2).
Significantly lower SIRs were observed for cancers of the
tongue (SIR = 0.37; 95% CI 0.10–0.94), tonsil (SIR = 0.27;
95% CI 0.03–0.99), stomach (SIR = 0.79; 95% CI 0.73–0.86),
colon (SIR = 0.84; 95% CI 0.74–0.95), and liver (SIR = 0.79;
95% CI 0.69–0.90), and for non-Hodgkin lymphoma
(SIR = 0.69; 95% CI 0.50–0.91). However, the risks of
prostate cancer and kidney cancer in patients with BC increased significantly (SIR = 1.46; 95% CI 1.33–1.59, and
SIR = 1.47; 95% CI 1.20–1.79, respectively) (Table 2).
Kwon et al. BMC Cancer (2018) 18:617
Page 3 of 9
Table 1 Characteristics of patients with primary BC, 1993–2013
Total
Men
Women
n
%
n
%
n
%
48,875
100
39,351
100
9524
100
1993–1997
6892
14.10
5592
14.21
1300
13.65
1998–2002
10,484
21.45
8377
21.29
2107
22.12
2003–2007
13,585
27.80
10,942
27.81
2643
27.75
Patients with BC
Period of BC diagnosis
17,914
36.65
14,440
36.70
3474
36.48
Average age at diagnosis with BC (years; mean, SD)
2008–2013
65.39
12.46
64.81
12.20
67.80
13.22
Median age at diagnosis with BC (years; median, range)
67
105 (1–106)
66
100 (1–101)
70
105 (1–106)
Age at primary BC diagnosis (years)
0–39
1608
3.29
1259
3.20
349
3.66
40–59
12,489
25.55
10,601
26.94
1888
19.82
≥60
34,778
71.16
27,491
69.86
7287
76.51
Surgery
42,448
86.85
34,653
88.06
7795
81.85
Radiation
1298
2.66
1004
2.55
294
3.09
Chemotherapy
Percentage of primary treatment status
6161
12.61
5045
12.82
1116
11.72
Average follow-up after BC diagnosis (years; mean, SD)
5.65
5.09
5.70
5.06
5.46
5.21
Median follow-up after BC diagnosis (years; median, range)
4.13
20.80(0–20.80)
4.21
20.80(0–20.80)
3.67
20.80(0–20.80)
Number of patients who developed a SPC
3495
7.15
3116
7.92
379
3.98
Average age at SPC diagnosis (years; mean, SD)
70.57
9.28
70.71
8.94
69.40
11.67
Median age at SPC diagnosis (years; median, range)
Average interval between primary cancer and SPC
(years; mean, SD)
71(10–95)
5.23
Median interval between primary cancer and SPC
(years; median, range)
4.30
71.5(10–95)
5.18
4.17(0.17–0.67)
4.29
71(12–93)
5.75
4.08(0.17–20.67)
4.39
4.75(0.17–19.08)
Number of patients by latency between primary cancer and SPC (years)
1
556
15.91
469
12.95
47
16.19
1–4
1409
40.31
1176
39.67
144
40.61
5–9
1000
28.61
813
29.20
106
28.07
≥10
530
15.16
438
18.18
66
15.12
0–39
13
0.37
8
0.26
5
1.32
40–59
396
11.33
327
10.49
69
18.21
≥60
3086
88.30
2781
89.25
305
80.47
Number of patients by age at SPC diagnosis (years)
Average follow-up after SPC diagnosis, (years; mean, SD)
2.55
2.91
2.48
2.82
3.10
3.52
Median follow-up after SPC diagnosis (years; median, range)
1.42
20.00(0–20.00)
1.42
20.00(0–20.00)
1.67
19.50(0–19.50)
1
3259
6.67
2896
7.36
363
3.81
2
217
0.44
203
0.52
14
0.15
≥3
19
0.04
17
0.04
2
0.02
Number of subsequent primary cancers
BC: bladder cancer, SD: standard deviation, SPC: second primary cancer
Notably, SIR did not increase significantly for total lung
cancers. However, a subgroup analysis based on lung cancer histology revealed that the SPC risks of lung squamous
cell carcinoma and adenocarcinoma were significantly elevated (SIR = 1.15; 95% CI 1.02–1.29, and SIR = 1.20; 95%
CI 1.05–1.37, respectively). By contrast, other lung cancer
Kwon et al. BMC Cancer (2018) 18:617
Page 4 of 9
Table 2 Risk of SPC after BC diagnosis by follow-up, age, and period (1993–2013)
Total
SIR
latency (months)
O/E
CI
Age (years)
Period
< 12
12–59 60–119 ≥120 0–39
40–59 ≥ 60
1993–2000 2001–2013
SIR
SIR
SIR
SIR
SIR
SIR
SIR
SIR
SIR
All SPCs
0.94# (3821/4086.59) (0.91–0.97)
1.21# 0.89#
0.92#
0.86# 1.50#
1.04
0.90# 0.85#
0.99
All SPCs excluding BC, KC,
pelvic and ureteral cancer
0.96# (3751/3921.87) (0.93–0.99)
1.20# 0.91#
0.95
0.90# 1.36
1.06
0.92# 0.87#
1.01
Buccal cavity, pharynx
0.79
Tongue
0.37# (4/10.95)
(53/67.09)
(0.59–1.03)
0.23# 1.09
0.62
0.76
0
1.03
0.71# 0.68
0.87
(0.10–0.94)
0
0.32
0.57
0
0.67
0.26# 0.22
0.47
0.43
Salivary gland
0.92
(6/6.51)
(0.34–2.01)
0
1.10
1.58
0
0
1.17
0.85
0.76
1.03
Tonsil
0.27# (2/7.32)
(0.03–0.99)
0
0.66
0
0
0
0.40
0.21
0
0.44
Hypopharynx
1.19
(0.72–1.86)
0.49
1.33
0.86
2.01
0
1.69
1.05
1.48
Digestive system
0.85# (1833/2160.13) (0.81–0.89)
0.96
0.82# 1.41
0.95
0.81# 0.79#
(19/15.94)
(94/97.04)
0.81# 0.79#
Esophagus
0.97
(0.78–1.19)
0.96
Stomach
0.79# (632/796.08)
(0.73–0.86)
0.73# 0.73#
Small intestine
1.43
(0.87–2.20)
2.31
1.55
Colon
0.84# (271/321.74)
(0.74–0.95)
0.95
0.87
(20/14.02)
0.96
1.07
0.80
0
1.05
0.95
0.87#
0.87
1.47
0.92
0.75# 0.73#
0.83
1.22
0.84
0
0.86
0.70# 1.72
0.98
0.89#
1.08
0.84#
1.33
1.47
2.13#
0.95
0.90
0.82# 0.77#
0.88
Rectum, rectosigmoid junction 0.91
(233/255.77)
(0.80–1.04)
1.15
0.75#
1.02
0.95
1.59
0.88
0.91
0.82
0.96
Anus, anal canal
(5/5.15)
(0.32–2.27)
1.51
0.46
1.34
1.20
0
2.12
0.72
0.89
1.03
0.97
Liver
0.79# (240/304.17)
(0.69–0.90)
0.63# 0.74#
0.94
0.79
1.09
0.95
0.71# 0.77#
0.80#
Gallbladder
0.77
(43/55.52)
(0.56–1.04)
1.18
0.86
0.83
0
0.92
0.75
0.82
0.57#
0.71
Bile ducts, other biliary
0.92
(166/180.66)
(0.78–1.07)
0.55# 0.92
1.18
0.73
2.04
0.95
0.91
0.92
0.92
Pancreas
0.98
(122/124.96)
(0.81–1.17)
0.67
1.19
0.82
2.2
1.27
0.90
0.81
1.08
Respiratory system
1.05
(848/807.86)
(0.98–1.12)
1.06
1.07
1.01
1.05
0
1.27#
1.01
0.93
1.13#
Nose, nasal cavity, ear
1.07
(8/7.51)
(0.46–2.10)
2.06
1.57
0.46
0
0
0
1.41
0.62
1.39
0.98
Larynx
1.20
(58/48.45)
(0.91–1.55)
2.18# 1.09
0.87
1.26
0
1.18
1.21
1.1
1.27
Lung, bronchus
1.05
(782/748.26)
(0.97–1.12)
0.98
1.03
1.06
0
1.30#
1
0.93
1.13#
Female breast
1.12
(34/30.38)
(0.78–1.56)
1.35
0.72
1.11
1.91
0.90
1.19
1.09
1.70#
0.78
Female genital system
1.10
(33/29.98)
(0.76–1.55)
1.71
1.16
0.59
1.33
2.75
0.97
1.07
1.27
0.96
1.07
Male genital system
1.45# (513/353.32)
(1.33–1.58)
4.04# 1.30#
1.04
0.95
5.18
1.66#
1.41# 1.30#
1.53#
Prostate
1.46# (505/346.97)
(1.33–1.59)
4.08# 1.31#
1.03
0.95
7.54
1.66#
1.41# 1.32#
1.53#
4.61
0
0
0.42#
0.37# 6.63#
Testis
3.95
Urinary system
0.73# (170/232.70)
(3/0.76)
(0.62–0.85)
(0.82–11.55) 0
Urinary bladder
0.45# (63/139.70)
(0.35–0.58)
1.63# 0.49#
0.12#
0.08# 12.41# 0.46#
0.41# 0.33#
0.54#
Kidney parenchyma
1.47# (100/67.98)
(1.20–1.79)
3.23# 1.44#
1.04
1.08
1.44# 1.32
1.56#
6.05
2.03# 0.72#
4.54#
4.17
4.76
0.89
0.65# 0.61#
1.40
0
6.83#
0.81#
Renal pelvis, other urinary
0.28# (7/25.02)
(0.11–0.58)
1.03
0.10#
0.40
0.00# 0
0.90
0.15# 0.43
0.19#
Brain, central nervous system
0.76
(16/21.09)
(0.43–1.23)
0.38
0.91
0.97
0.28
0.56
0.85
0.79
Thyroid
1.21
(107/88.29)
(0.99–1.46)
2.24# 1.29
0.97
0.83
1.08
1.35#
1.09
1.04
1.28#
Lymphatic, hematopoietic
0.75# (98/130.52)
(0.61–0.92)
1.08
0.73
0.83
0.63
0.57#
0.81
0.69#
0.79
Hodgkin lymphoma
0.77
Non-Hodgkin lymphoma
0.69# (47/68.39)
(2/2.58)
0.64#
0
0.72
(0.09–2.80)
3.11
0.92
0
0
0
0
1.15
0.99
0.64
(0.50–0.91)
1.21
0.75
0.35#
0.75
1.17
0.43#
0.76
0.64
0.71
Myeloma
0.82
(19/23.27)
(0.49–1.28)
1.09
0.64
0.87
0.95
0
0.79
0.83
0.70
0.89
Leukemia
0.82
(32/38.93)
(0.56–1.16)
0.84
0.44#
1.31
0.90
0
0.68
0.88
0.78
0.85
SIR: standardized incidence ratio, CI: confidence interval, BC: bladder cancer, SPC: second primary cancer, KC: kidney cancer, O/E: Observed/Expected,
# significant at alpha = 0.05
Kwon et al. BMC Cancer (2018) 18:617
Page 5 of 9
histologies (including small cell carcinoma: SIR = 1.06;
95% CI 0.86–1.28) were not associated with an increased
SPC risk. Moreover, although not significant, the SIR
increased after one year. SIRs for specific lung cancer
types are shown in Table 3.
To estimate the effect of primary BC treatment on
SPC risk, we calculated the SIR of the RT, surgery, and
chemotherapy groups. For all treatment modalities
except RT, the SPC risk was lower than that in comparable
patients with BC. Effects of treatment on SPC risk are
summarized in Table 4.
At 21 years follow-up, 22,036 of the 48,875 BC
patients had died. The 10-year overall survival (OS) rates
were 46.2 and 52.6% in the SPC and non-SPC groups,
respectively (p = 0.000). The 5- and 15-year OS rates for
the SPC group were 72.3 and 28.3%, respectively,
whereas those for the non-SPC group were 64.8 and
43.8%, respectively.
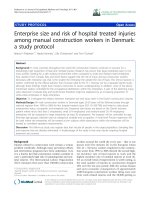
The survival curves crossed over time. The SPC group
had higher OS rates compared with the non-SPC group
for the first 8 years, but the OS of the SPC group
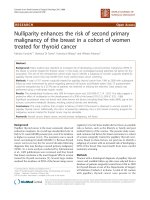
declined thereafter (Fig. 1). After the onset of SPC,
women had higher OS rates compared with men (Fig. 2).
We conducted a subgroup analysis of the patients
treated between 2006 and 2013 to analyze any correlations between the SPC incidence and OS according to
the SEER stage which were collected since 2006. After
BC diagnosis, the OS curves of patients with SPC and
non-SPC group crossed at 2.5 years (Additional file 1:
Figure S1). Moreover, distant staging in SPC and
non-SPC groups was estimated at 2.32 and 4.04% of
cases, respectively. For patients with a follow-up of
< 2.5 years, the proportion of distant staging was
5.31% at diagnosis, whereas that in those
followed-up for ≥2.5 years it was 0.8% (p = 0.000).
Before 2.5 years, the presence of SPC accounted for
5.38% of distant stage cases in the non-SPC group,
and 3.45% of cases in the SPC group (p = 0.183).
Afterwards, the proportions of distant staging were 0.48%
in SPC and 0.82% in non-SPC group (p = 0.719)
(Additional file 2: Figure S2).
Discussion
SIRs for cancers that developed after primary BC were
calculated using KCCR data. Analysis of the data revealed that, in the present cohort, BC survivors had a
6% lower risk of developing a new malignancy compared
with the general population. Cancers of the tongue, tonsils, digestive system (e.g., stomach, colon, and liver) and
non-Hodgkin lymphoma were less likely to occur as
SPCs in patients with BC. However, these findings were
incongruent with those reported previously [4, 5, 11].
While the reasons for reduced SPC risk in the BC
patients are unclear, they might be related to smoking
cessation and lifestyle modification after a BC diagnosis.
Additionally, these results might, in part, be due to
shared etiologies (genetic background and environment)
and treatment-related factors [12].
A previous study that evaluated Korean patients with
prostate cancer and kidney cancer using similar methods
revealed SPC SIRs of 0.75 and 1.13, respectively [6, 7].
In the present study, the incidences of prostate cancer
and kidney cancer were greater. This increased incidence
might be due to shared etiological, environmental, and
genetic factors between the first and second malignancies
[13]. Moreover, a surveillance effect might contribute to
increased risk immediately after diagnosis and might
explain the elevated prostate cancer and kidney cancer
risk after primary BC.
In a study examining associations between urinary
tract cancers, Kinoshita et al. demonstrated that BC
and prostate cancer share similar traits such as DNA
repair and N-acetyl transferase polymorphism [14].
Kellen et al. reported that prostate cancer risk increases in patients < 70 years old within one year of
BC diagnosis [15]. Lococo et al. also reported a significant increase in the relative risk of kidney cancer
following BC [16].
In this study, we interestingly found that the risk for
tongue and tonsil cancer significantly decreased in patients
with BC, and the result for tongue cancer is significantly
lower in those over 60 compared to those aged 40–59.
Chemical factors like tobacco and alcohol, biological factors
Table 3 Risk of SPC by lung cancer histology after BC diagnosis (1993–2013)
Latency (months)
< 12
12–59
60–119
≥120
SIR (O/E)
95% CI
SIR (O/E)
SIR (O/E)
SIR (O/E)
SIR (O/E)
Lung, bronchus
1.05 (782/748.26)
(0.97–1.12)
0.98 (90/91.90)
1.07 (331/309.19)
1.03 (227/220.22)
1.06 (134/126.96)
Squamous cell carcinoma
1.15# (280/243.85)
(1.02–1.29)
0.94 (29/30.71)
1.18 (121/102.47)
1.08 (77/71.04)
1.34# (53/39.63)
Total
Adenocarcinoma
1.20# (221/183.65)
(1.05–1.37)
1.39 (30/21.61)
1.27# (94/74.26)
1.15 (63/54.55)
1.02 (34/33.23)
Small cell carcinoma
1.06 (99/93.82)
(0.86–1.28)
0.69 (8/11.64)
1.10 (43/39.13)
1.13 (31/27.46)
1.09 (17/15.58)
Other and unspecified
0.80# (182/226.95)
(0.69–0.93)
0.82 (23/27.95)
0.78# (73/93.32)
0.83 (56/67.16)
0.78 (30/38.51)
SPC: second primary cancer, BC: bladder cancer, SIR: standardized incidence ratio, CI: confidence interval, O/E: Observed/Expected
# significant at alpha = 0.05
Kwon et al. BMC Cancer (2018) 18:617
Page 6 of 9
Table 4 Risk of SPC according to treatment for primary BC (1993–2013)
All SPCs
RT
Non-RT
Surgery
Non-Surgery
Chemotherapy
Non-chemotherapy
SIR
SIR
SIR
SIR
SIR
SIR
1.01
0.93#
0.94#
0.85#
0.94
0.93#
All SPCs excluding BC, KC, pelvic and ureteral cancers
1.04
0.96#
0.97#
0.86#
0.94
0.96#
Buccal cavity, pharynx
0
0.80
0.83
0.35
0.56
0.82
Tongue
0
0.37#
0.40
0
0.86
0.31#
Salivary gland
0
0.94
1.01
0
0
1.03
Tonsil
0
0.28
0.30
0
0
0.31
Hypopharynx
0
1.21
1.30
0
0.59
1.26
Digestive system
0.88
0.85#
0.87#
0.66#
0.78#
0.86#
Esophagus
0.60
0.98
0.97
0.95
0.86
0.98
Stomach
0.59
0.80#
0.81#
0.64#
0.71#
0.80#
Small intestine
4.18
1.38
1.49
0.79
0.68
1.51
Colon
1.35
0.83#
0.89#
0.39#
1.04
0.82#
Rectum, rectosigmoid junction
1.20
0.91
0.91
0.90
0.87
0.92
Anus, anal canal
0
0.99
0.86
1.98
1.86
0.87
Liver
0.98
0.79#
0.80#
0.70
0.73
0.80#
Gallbladder
0
0.79
0.78
0.74
0.17#
0.84
Bile ducts, other biliary
0.64
0.92
0.96
0.53
0.91
0.92
Pancreas
1.4
0.97
1.01
0.69
0.62
1.02
Respiratory system
1.16
1.05
1.05
1.01
0.98
1.06
Nose, nasal cavity, ear
7.75
0.95
1.17
0
1.25
1.04
Larynx
0
1.22
1.13
1.90
0.95
1.23
Lung, bronchus
1.18
1.04
1.05
0.97
0.98
1.05
Female breast
0
1.14
1.20
0.34
0.62
1.18
Female genital system
1.50
1.09
1.12
0.93
1.86
1.01
Male genital system
2.23#
1.44#
1.43#
1.74#
1.85#
1.41#
Prostate
2.28#
1.44#
1.43#
1.70#
1.83#
1.41#
Testis
0
4.02
4.32
0
12.33
2.95
Urinary system
1.03
0.73#
0.69#
1.1
1.28
0.67#
Urinary bladder
0
0.46#
0.43#
0.61
1.03
0.38#
Kidney parenchyma
2.81
1.45#
1.40#
2.29#
1.98#
1.41#
Renal pelvis, other urinary
2.43
0.24#
0.22#
0.90
0.78
0.22#
Brain, central nervous system
0
0.77
0.78
0.54
0
0.85
Thyroid
0
1.23#
1.23#
1
1.65
1.16
Lymphatic, hematopoietic
0.46
0.76#
0.76#
0.61
0.52
0.78#
Hodgkin lymphoma
0
0.79
0.84
0
3.65
0.43
Non-Hodgkin lymphoma
0
0.70#
0.71#
0.50
0.42
0.72#
Myeloma
0
0.83
0.80
1.01
1.66
0.72
Leukemia
1.53
0.81
0.85
0.58
0.00#
0.92
SIR, standardized incidence ratio, RT: radiotherapy, BC: bladder cancer, SPC: second primary cancer,
KC: kidney cancer, # significant at alpha = 0.05
like human papillomavirus (HPV), syphilis, oro-dental factors, dietary deficiencies, chronic candidiasis and viruses
have been known to be significantly associated with oral
cancer [17]. The mechanism of the declined risk of
tongue and tonsil cancer is still unclear. However, we
speculated that life style modification (smoking cessation, diet, and so on) may reduce chance of developing
tongue and tonsil cancer.
Kwon et al. BMC Cancer (2018) 18:617
Page 7 of 9
Fig. 1 Kaplan-Meier curve: survival after bladder cancer according to the incidence of second primary cancer (SPC) in all patients
Smoking is a well-known risk factor for BC, kidney,
lung, mouth, and pharynx cancers [18] and has been estimated to cause half of all BC cases in Western countries [19]. In contrast to our hypothesis, the present
study did not show an increase in the number of subsequent respiratory system malignancies. Therefore, a sub
analysis according to histological lung cancer type was
performed, showing a significant increase in the incidence of lung squamous cell carcinoma and adenocarcinoma as SPCs. Possible reasons include potential
etiological or genetic background differences between
the Western and Asian patients, decreased smoking contribution compared with the West, and the possibility
that the other cancers were smoking-related and occurred before the BC diagnosis.
The risk of cancer caused by radiation follows the individual exposed to radiation and continues to increase
throughout the individual’s lifetime [20]. Studies evaluating the risk of secondary cancers after radiation therapy
for prostate cancer have shown mixed results [21–23].
Recent meta-analyses have shown that patients who
received prostate cancer radiotherapy are more likely to
have a second malignancy of the bladder, colon and
rectum than patients who have not received radiotherapy [24]. To our knowledge, although no studies have
reported the risk of secondary cancer after radiation
Fig. 2 Kaplan-Meier curve: survival after second cancer according to sex in patients with second cancers
Kwon et al. BMC Cancer (2018) 18:617
therapy for bladder cancer, our study showed that
secondary cancers were more common in the digestive
organs, such as the small intestine, colon, rectum, and
female/male genital systems than patients who do not
received radiotherapy. We assume that this result is
related to the radiation field and is similar to the results
of the meta-analysis mentioned above [24]. However, the
lack of information such as the specific type of radiation
treatment and dose of radiation is another limitation of
this study.
To our knowledge, this is the first study to evaluate
the histological subtypes of lung cancers as an SPC.
Cigarette smoking is an established risk factor for lung
cancer, but the severity of its association with other
histologic types is unclear. Khuder [25, 26] reported that
all histologic lung cancer types were significantly associated with cigarette smoking, and the association was
stronger for squamous cell and small cell carcinomas
compared with large cell cancer and adenocarcinoma. In
the present study, squamous cell carcinoma and adenocarcinoma exhibited a significantly elevated risk of
occurring as an SPC. Although not significant, small cell
lung cancer risk also increased over an extended
follow-up period. If smoking is a shared risk factor for
BC and secondary lung cancer, the influence of smoking
on each histologic type of secondary lung cancer in BC
patients might be presumed to be different to that for
primary lung cancer.
Cumulative survival curves of patients with or without
SPC were estimated to investigate whether SPC affects the
survival rate of patients who have BC. In particular, for
the first 8 years, the SPC group had superior survival rates
compared with the non-SPC group. Overall, this study
demonstrated that patients in the non-SPC group had significantly more advanced BC at the time of diagnosis.
Therefore, the survival rate of the non-SPC group was
lower than that of the SPC group for the first 2.5 years
after diagnosis of BC. Conversely, after 2.5 years the
reverse was noted with survival in the SPC group being
inferior to that in the non-SPC group. These findings suggested that the SPC group would require more attentive
and systemic surveillance after 2.5 years of follow-up.
The present study has several limitations. First, information concerning several potential confounding variables including smoking, alcohol consumption, obesity,
and familial cancer history were not available. Second,
there was limited data available concerning genetic
factors and specific cancer stages among the patients,
making it impossible to evaluate the correlation between
disease severity and SPC incidence. Third, the higher incidence of SPC might be associated with close surveillance or misclassifications because BC, prostate cancer,
and kidney cancer often develop synchronously [15, 16].
Fourth, the median follow-up period was 4.13 years,
Page 8 of 9
which was not relatively long duration. Further studies
with long follow-up periods will be needed to estimate
the precise risk of developing SPC and to overcome surveillance bias. Fifth, it was impossible to divide into
non-muscle invasive cancer and muscle invasive cancer
in our study. The survival of patients with bladder
cancer may be affected by degree of muscle invasion.
Conclusion
The risk is lower among Korean survivors of BC compared
to the expected risk of developing SPC in the general population. However, patients with BC remain at increased risk
of some cancers, particularly prostate and kidney, lung
squamous cell carcinoma, and lung adenocarcinoma.
Therefore, longer and closer surveillance could be recommended for the early detection of SPC.
Additional files
Additional file 1: Figure S1. Kaplan-Meier curve: survival after bladder
cancer (BC) according to the incidence of a second primary cancer (SPC)
in all patients (2006–2013). (TIF 1011 kb)
Additional file 2: Figure S2. Stage distributions by bladder cancer
occurrence and follow-up years. (JPG 184 kb)
Abbreviations
BC: Bladder cancer; CI: Confidence interval; KCCR: Korea Central Cancer
Registry; RT: Radiotherapy; SD: Standard deviation; SEER: Surveillance
epidemiology and end results; SIR: Standardized incidence ratio; SPC: Second
primary cancer
Funding
This work was supported by a research grant from the National Cancer
Center (No. 1610201), Republic of Korea. The National Cancer Center had no
role in the design of the study, or the collection, analysis, and interpretation
of data, or the manuscript preparation.
Availability of data and materials
All data generated or analyzed during this study are included in this
published article.
Authors’ contributions
Conception and design: YJW, WAK, JYJ. Acquisition of data: YJW, CMO, KWJ.
Analysis of data: JL, YJW. Drafting of the manuscript: WAK, JYJ, JL, YJW.
Critical revision and final approval of the manuscript: All authors read and
approved the final manuscript.
Ethics approval and consent to participate
Ethical approval for the research protocol was provided by the institutional
review board of the National Cancer Center (NCC2017–-0182).
Information was de-identified prior to analysis. The authorization for data
processing was obtained from the National Cancer Act.
Competing interests
The authors declare that they have no competing interests.
Publisher’s Note
Springer Nature remains neutral with regard to jurisdictional claims in
published maps and institutional affiliations.
Author details
1
Center for Prostate Cancer, National Cancer Center, Goyang, Korea. 2Cancer
Registration and Statistics Branch, National Cancer Center, Goyang, Korea.
Kwon et al. BMC Cancer (2018) 18:617
Received: 28 September 2017 Accepted: 18 May 2018
References
1. Antoni S, Ferlay J, Soerjomataram I, Znaor A, Jemal A, Bray F. Bladder cancer
incidence and mortality: a global overview and recent trends. Eur Urol.
2017;71:96–108.
2. Song W, Jeon HG. Incidence of kidney, bladder, and prostate cancers in
Korea: an update. Korean J Urol. 2015;56:422–8.
3. Jung KW, Won YJ, Oh CM, Kong HJ, Lee DH, Lee KH. Cancer statistics in
Korea: incidence, mortality, survival, and prevalence in 2014. Cancer Res
Treat. 2017;49:292–305.
4. Wilson RT, Silverman DT, Fraumeni Jr JF, Curtis RE. New malignancies
following cancer of the urinary tract. In: Curtis RE, Freedman DM, Ron E,
LAG R, Hacker DG, Edwards BK, et al., editors. New malignancies among
cancer survivors: SEER cancer registries. Bethesda MD: National Cancer
Institute; 1973. p. 285–312.
5. Jegu J, Colonna M, Daubisse-Marliac L, Tretarre B, Ganry O, Guizard AV, et al.
The effect of patient characteristics on second primary cancer risk in France.
BMC Cancer. 2014;14:94.
6. Joung JY, Lim J, Oh CM, Jung KW, Cho H, Kim SH, et al. Risk of second
primary cancer among prostate cancer patients in Korea: a populationbased cohort study. PLoS One. 2015;10:e0140693.
7. Joung JY, Kwon WA, Lim J, Oh CM, Jung KW, Kim SH, et al. Second primary
cancer risk among kidney cancer patients in Korea: a population-based
cohort study. Cancer Res Treat. 2018;50:293–301.
8. Shin HR, Won YJ, Jung KW, Kong HJ, Yim SH, Lee JK, et al. Nationwide
cancer incidence in Korea, 1999~2001; first result using the national cancer
incidence database. Cancer Res Treat. 2005;37:325–31.
9. Fritz A, Percy C, Jack A, Shanmugaratnam K, Sobin L, Parkin DM, Whelan S.
International classification of diseases for oncology. Lyon, France: World
Health Organization; 2000.
10. Curado MP, Okamoto N, Ries L, Sriplung H, Young J, Carli P-M, et al.
International rules for multiple primary cancers (ICD-0 third edition). Eur J
Cancer Prev. 2005;14(4):307–8
11. Muller J, Grosclaude P, Lapotre-Ledoux B, Woronoff AS, Guizard AV, Bara S, et
al. Trends in the risk of second primary cancer among bladder cancer
survivors: a population-based cohort of 10 047 patients. BJU Int. 2016;118:53–9.
12. Wood ME, Vogel V, Ng A, Foxhall L, Goodwin P, Travis LB. Second malignant
neoplasms: assessment and strategies for risk reduction. J Clin Oncol. 2012;
30:3734–45.
13. Boice JD Jr, Storm HH, Curtis RE, Jensen OM, Kleinerman RA, Jensen HS, et
al. Introduction to the study of multiple primary cancers. Natl Cancer Inst
Monogr. 1985;68:3–9.
14. Kinoshita Y, Singh A, Rovito PM Jr, Wang CY, Haas GP. Double primary
cancers of the prostate and bladder: a literature review. Clin Prostate
Cancer. 2004;3:83–6.
15. Kellen E, Zeegers MP, Dirx M, Houterman S, Droste J, Lawrence G, et al. Occurrence
of both bladder and prostate cancer in five cancer registries in Belgium, the
Netherlands and the United Kingdom. Eur J Cancer. 2007;43:1694–700.
16. Lococo F, Galeone C, Sacchettini C, Leuzzi G, Cesario A, Paci M, et al.
Second malignancy risk in patients with bronchopulmonary carcinoids:
epidemiological results from Italian network of Cancer registries. Tumori.
2017;103:e15–20.
17. Ram H, Sarkar J, Kumar H, Konwar R, Bhatt ML, Mohammad S. Oral cancer: risk
factors and molecular pathogenesis. J Maxillofac Oral Surg. 2011;10:132–7.
18. Dreyer L, Winther JF, Pukkala E, Andersen A. Avoidable cancers in the
Nordic countries. Tobacco smoking APMIS Suppl. 1997;76:9–47.
19. Brennan P, Bogillot O, Cordier S, Greiser E, Schill W, Vineis P, et al. Cigarette
smoking and bladder cancer in men: a pooled analysis of 11 case-control
studies. Int J Cancer. 2000;86:289–94.
20. Preston DL, Ron E, Tokuoka S, Funamoto S, Nishi N, Soda M, et al. Solid cancer
incidence in atomic bomb survivors: 1958-1998. Radiat Res. 2007;168:1–64.
21. Berrington de Gonzalez A, Curtis RE, Kry SF, Gilbert E, Lamart S, Berg CD, et
al. Proportion of second cancers attributable to radiotherapy treatment in
adults: a cohort study in the US SEER cancer registries. Lancet Oncol. 2011;
12:353–60.
22. Brenner DJ, Curtis RE, Hall EJ, Ron E. Second malignancies in prostate
carcinoma patients after radiotherapy compared with surgery. Cancer. 2000;
88:398–406.
Page 9 of 9
23. Zelefsky MJ, Pei X, Teslova T, Kuk D, Magsanoc JM, Kollmeier M, et al.
Secondary cancers after intensity-modulated radiotherapy, brachytherapy
and radical prostatectomy for the treatment of prostate cancer: incidence
and cause-specific survival outcomes according to the initial treatment
intervention. BJU Int. 2012;110:1696–701.
24. Wallis CJ, Mahar AL, Choo R, Herschorn S, Kodama RT, Shah PS, et al.
Second malignancies after radiotherapy for prostate cancer: systematic
review and meta-analysis. BMJ. 2016;352:i851.
25. Khuder SA. Effect of cigarette smoking on major histological types of lung
cancer: a meta-analysis. Lung Cancer. 2001;31:139–48.
26. Khuder SA, Dayal HH, Mutgi AB, Willey JC, Dayal G. Effect of cigarette
smoking on major histological types of lung cancer in men. Lung Cancer.
1998;22:15–21.