Incidence of breast and colorectal cancer among immigrants in Ontario, Canada: A retrospective cohort study from 2004-2014
Bạn đang xem bản rút gọn của tài liệu. Xem và tải ngay bản đầy đủ của tài liệu tại đây (632.43 KB, 10 trang )
Shuldiner et al. BMC Cancer (2018) 18:537
/>
RESEARCH ARTICLE
Open Access
Incidence of breast and colorectal cancer
among immigrants in Ontario, Canada:
a retrospective cohort study from 2004-2014
Jennifer Shuldiner1*, Ying Liu2 and Aisha Lofters3
Abstract
Background: Studies have shown that morbidity and mortality rates due to cancer among recent immigrants are
lower than those among the native-born population. The objectives of this study were to describe the incidence of
colorectal and breast cancer among immigrants from major regions of the world compared to Canadian-born
residents of the province of Ontario and to examine the role of length of stay and neighborhood income.
Methods: Retrospective cohort study including all individuals 18 years and over residing in Ontario from 2004 to
2014. Age-standardized incidence rates (ASIR) were calculated for immigrants from each world region versus
Canadian-born residents and stratified by neighborhood income quintile and length of stay. Binomial regression
analysis was used to determine the association of neighbourhood income, length of stay, and location of birth with
colorectal and breast cancer incidence.
Results: Canadian immigrants born in South Asia had the lowest colorectal and breast cancer incidence (colorectal:
women: ASIR = 0.14; men: ASIR = 0.18; breast: ASIR = 1.00) compared to long-term residents during the study period
(colorectal: women: ASIR = .57; men: ASIR = .72; breast cancer ASIR = 1.61). In multivariate analyses, neighboorhood
income did not consistently play a significant role in colorectal cancer incidence; however higher neighbourhood
income was a risk factor for breast cancer among immigrant women (adjusted relative risk for highest
neighboorhood income quintile versus lowest income quintile =1.21, 95% CI = 1.18–1.24). Increased length of stay
was associated with higher risk of cancer. After adjusting for age, neighborhood income, and length of stay, those
born in Europe and Central Asia had the highest risk of colorectal cancer compared to those born in East Asia and
Pacific and those born in the Middle East had the greatest additional risk of breast cancer.
Conclusions: After correcting for age, breast and colorectal cancer incidence rates among immigrants differ
according to their region of birth and recent immigrants to Ontario have lower colorectal and breast cancer
incidence rates than their native-born peers. However, those advantages diminish over time. These findings call for
Ontario to generate tools and interventions to maintain the health of the immigrant population, particularly for
those groups with a higher incidence of cancer.
Keywords: Immigrant, Cancer incidence, Standardized incidence ratio, Breast cancer, Colorectal cancer
* Correspondence:
1
University of Toronto, 155 College Street, Toronto, ON M5T 1P8, Canada
Full list of author information is available at the end of the article
© The Author(s). 2018 Open Access This article is distributed under the terms of the Creative Commons Attribution 4.0
International License ( which permits unrestricted use, distribution, and
reproduction in any medium, provided you give appropriate credit to the original author(s) and the source, provide a link to
the Creative Commons license, and indicate if changes were made. The Creative Commons Public Domain Dedication waiver
( applies to the data made available in this article, unless otherwise stated.
Shuldiner et al. BMC Cancer (2018) 18:537
Page 2 of 10
Background
Immigrants represent a large, increasing and vital
segment of the Canadian population. Most Canadian
studies have shown that morbidity and mortality rates of
chronic disease among recent immigrants are lower than
those among the general Canadian population suggesting that immigrants enjoy the “healthy immigrant effect”
whereby they are in better physical condition on arrival
than host country inhabitants as a result of selective
migration [1–4].
Ontario, the largest province in Canada, has a large
and diverse immigrant population and approximately
one-third of the population in Ontario is foreign-born
[5]. Ontario also has a provincial cancer registry that
includes data on all residents diagnosed with cancer
and universal public health care coverage, thus making it an ideal location to explore cancer incidence
among immigrants at the population level. However,
there has been little recent research examining cancer
incidence in the immigrant population [6].
Colorectal cancer is the third most common cancer
diagnosed in men and women with 26,800 cases per
year in Ontario. Breast cancer is the most common
cancer among women with 26,300 cases a year in
Ontario [7]. Also, colorectal and breast cancer have
clear provincial screening guidelines and are often
used as indicators for population health [8]. Therefore, the overall objective of this study was to examine how the incidence of colorectal and breast cancer
among immigrants from major regions of the world
compare to Canadian-born residents of Ontario. We
also explored the roles of age, gender, socioeconomic
status and time in Canada.
1985). The IRCC database was also used to identify
country of birth, and countries were further collapsed into eight regions, broadly defined according
to the World Bank classification (1, Caribbean and
Latin America; 2, East Asia and Pacific; 3, Eastern
Europe and Central Asia; 4, Middle East and North
Africa; 5, South Asia; 6, Sub- Saharan Africa; 7,
USA, Australia, and New Zealand; and 8, Western
Europe). Third, we identified incident breast and
colorectal cancer cases by linking the cohort to the
Ontario Cancer Registry from 2004 to 2014. The
Ontario Cancer Registry is a passive surveillance patient registry that links data from hospitals, cancer
centers and pathology laboratories; incidence data
has been previously assessed as having approximately
92% completeness [10]. The Canadian Census was
used for calculating the Canadian population
standard.
Methods
The following datasets were linked using unique
encoded identifiers and analyzed at the Institute for
Clinical Evaluative Sciences (ICES). The Registered
Persons Database was used to identify people aged
18 years and over in the province of Ontario eligible
for health care. The Registered Persons Database
contains basic demographic information for those
who have ever received an Ontario health card number for the province’s universal health care system
(overall linkage rate = 96.5%). All citizens and permanent residents are eligible for health care. The
second database was the Immigration Refugee and
Citizenship Canada (IRCC) Database [9] which includes individuals who have landed immigrant or
permanent resident status at any time from 1985 to
2014. Immigrants were defined as those identified in
the IRCC Database, and long-term residents were
defined as those not on the IRCC database
(Canadian-born and immigrants who arrived before
Analysis
Covariates
Using the postal-code conversion file [11], ecologicallevel measures of income status were estimated using
data from the 1996, 2001 and 2006 Canadian census and
applied to individual cases according to the dissemination area where the individual resided. Dissemination
areas are the smallest geographic census unit for which
census data are available, and are uniform in population
size, which is targeted from 400 to 700 persons. Individuals were then grouped into income quintiles ranging
from 1 (20% lowest income) to 5 (20% highest income).
Length of stay was measured by calculating the time
since immigration until December 31, 2014 or cancer
incidence.
The age-standardized annual incidence rates (ASIR)
were calculated using the 2010 Canadian population
as standard, for long-term residents, for immigrants,
and then by world region of origin for immigrants.
To assess the effect of neighboorhood income and
length of stay in Canada, ASIR were stratified by time
since immigration 0–5 years, 6–10 years and 11+
years) and by neighborhood income quintile (1
through 5).
Predictors of breast and colorectal cancer incidence
among all residents in Ontario, 2004–2014 were
assessed by two binomial regression models, one
among the entire cohort and one among only immigrants. Among the entire cohort, predictors entered
into the model included age, place of birth and
neighborhood income quintile. The second model calculated among only immigrants assessed the effect of
age, neighborhood income quintile, length of stay and
region of birth. The analyses produced adjusted rate
Shuldiner et al. BMC Cancer (2018) 18:537
Page 3 of 10
ratios (RR) with corresponding confidence intervals
(CI). Statistical significance was determined at the 0.
05 level. All analyses were conducted using SAS statistical software, version 9.4. This study was approved
by the institutional review board at Sunnybrook
Health Sciences Centre, Toronto, Canada.
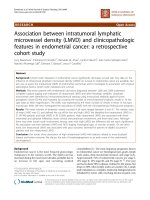
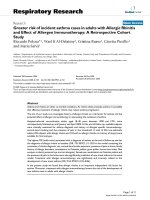
Central Asia for men (ASIR = 0.65) and females
(ASIR = 0.51) (Fig. 1). Among women born outside
of Canada, the highest ASIR for breast cancer was
among those from Middle East and North Africa
(ASIR = 1.49, Fig. 1).
Length of stay and income
Results
Demographic characteristics of the study population
are shown in Table 1. Immigrants were younger
than long-term residents on average: mean age
ranged from 40.2 ± 13.7 for Sub-Saharan Africa to
44.7 ± 15.8 for East Asia and Pacific, whereas longterm residents’ mean age was 47.5 ± 2. Those that
were born in the Middle East and North Africa had
spent the least amount of time in Canada on average (10.7 ± 6.0 years), and those born in Europe and
Central Asia had spent the longest amount of time
(14.2 ± 6.9). Sub-Saharan Africa, followed by Latin
America and the Caribbean, had the greatest percentage of immigrants living in the lowest income
quintile (Table 1).
Place of birth
Age-standardized incidence rates varied by region,
with long-term residents consistently having the
highest rates and South Asian immigrants consistently having the lowest rates of colorectal and breast
cancer (Fig. 1). Among immigrants, incidence of
colorectal cancer was highest among Europe and
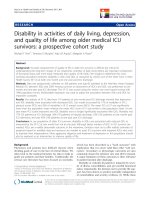
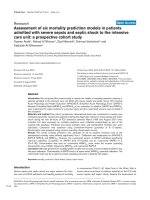
ASIR were also examined based on length of stay and
neighborhood income quintile. We found that the
ASIR were not associated with neighborhood income
quintile for females and males with colorectal cancer
(Fig. 2a and Fig. 2b). Standardized incidence rates of
breast cancer increased for higher neighborhood income quintiles for those born in Europe and Central
Asia, South Asia, Sub-Saharan Africa, and New Zealand, Australia and the United States, but did not
show trends for the remaining regions (Fig. 2c). There
were no clear patterns seen for length of stay for
both colorectal and breast cancer in the descriptive
analysis and advantages enjoyed by immigrants appeared to disappear after spending over 10 years in
Canada for both colorectal and breast cancer incidence (not shown).
In the binomial regression analysis among both
long-term residents and immigrants we found that,
after controlling for age and neighborhood income,
immigrants enjoyed a healthy immigrant effect and
were at lower risk of breast and colorectal cancer
compared to long-term residents (Table 2). For colorectal cancer, those in the highest neighborhood
Table 1 Demographic characteristics of long-term residents and immigrants in the study population
Characteristic
Long-term
residents
East Asia
and Pacific
Europe and
Central Asia
Latin America and Middle East and South Asia
the Caribbean
North Africa
Sub-Saharan
Africa
US, New Zealand
and Australia
N = 94,136,709 N = 5,235,458 N = 3,789,083 N = 2,718,788
N = 1,844,075
N = 4,613,474 N = 1,141,050 N = 380,564
48.8
44.9
49.3
47.8
53.1
50.5
49.9
52.0
47.5 ± 3
44.7 ± 15.8
43.1 ± 15.0
42.1 ± 14.8
40.8 ± 14.8
42.0 ± 15.1
40.2 ± 13.7
42.3 ± 15.1
Sex (%)
Male
Age (years)
Mean (SD)
Neighborhood income quintile (%)
1 (lowest)
17.9
25.1
22.4
33.5
25.7
31.9
43.2
15.3
2
19.5
24.9
19.4
24.7
18.7
24.8
19.6
16.8
3
19.8
19.9
19.5
19.9
19.5
21.5
14.9
18.0
4
21.1
17.5
21.6
13.7
20.5
14.6
12.8
20.2
5 (highest)
21.8
12.4
16.9
7.92
15.2
7.0
9.2
29.4
12.2 ± 6.4
13.9 ± 6.6
14.2 ± 6.9
11.5 ± 6.4
10.7 ± 6.0
12.4 ± 6.6
12.6 ± 7.0
0–5
16.3
11.4
12.9
19.4
20.4
17.0
18.3
6–10
60.3
68.9
67.0
55.2
49.9
60.3
59.6
11+
23.4
19.7
17.2
25.4
29.7
22.7
22.1
Length of stay
(years) (%)
Mean (SD)
Shuldiner et al. BMC Cancer (2018) 18:537
Page 4 of 10
additional risk of colorectal cancer compared to
long-term residents. Those born in South Asia had
the lowest rates of breast and colorectal cancer compared to long-term residents (Table 2).
In binomial regression analysis among immigrants
only, when controlling for age, neighborhood income, and place of birth, we found that the risk of
colorectal and breast cancer increased for each additional five years that immigrants lived in Canada
(Table 3). Length of stay had the greatest effect on
risk of breast cancer where risk increased 7% for
each additional five years in Canada (p < 0.0001).
After adjusting for age, neighborhood income, and
length of stay, those born in Europe and Central
Asia had the greatest additional risk of colorectal
cancer compared to the reference group for this analysis of those born in East Asia and the Pacific.
Those born in South Asia had the lowest risk for
income quintile had a lower risk of incident cancer
compared to those in the lowest neighborhood income quintile for both men (RR = 0.96, 95% CI = 0.
93–0.99) and women (RR = 0.95, 95% CI = 0.92–0.99).
Also, a significant (p < 0.01) trend was found for income for colorectal cancer where risk was higher
among those in lower income neighborhoods. The
effect of neighborhood income on the risk of breast
cancer for women was in the opposite direction with
each neighborhood income quintile conferring additional risk of breast cancer (RR = 1.21 for Q5 versus
Q1, CI = 1.18–1.24), and this relationship was significant as a trend as well (p < 0.0001). After adjusting
for age and neighborhood income, those born in
Europe and Central Asia had the greatest additional
risk of colorectal cancer compared to long-term residents. Regarding breast cancer, those born in the
Middle East and North Africa had the greatest
a
Age standardized incidence rates per 1000 for females with colorectal cancer, 2004-2014
US, NZ and Australia
Sub-Saharan Africa
South Asia
Middle East and North Africa
Latin America and the Caribbean
Europe and Central Asia
East Asia and Pacific
Long-term resident
0.00
0.27
0.24
0.14
0.31
0.32
0.51
0.37
0.57
0.10
0.20
0.30
0.40
0.50
0.60
Age standardized incidence rate
b
Age standardized incidence rates per 1000 for males with colorectal cancer, 2004-2014
US, NZ and Australia
Sub-Saharan Africa
South Asia
Middle East and North Africa
Latin America and the Caribbean
Europe and Central Asia
East Asia and Pacific
Long-term resident
0.00
0.34
0.41
0.18
0.38
0.30
0.65
0.44
0.72
0.10
0.20
0.30
0.40
0.50
0.60
0.70
0.80
Age standardized incidence rate
c
Age standardized incidence rates per 1000 for females with breast cancer, 2004-2014
US, NZ and Australia
Sub-Saharan Africa
South Asia
Middle East and North Africa
Latin America and the Caribbean
Europe and Central Asia
East Asia and Pacific
Long-term resident
0.00
1.30
1.14
1.00
1.49
1.09
1.35
1.07
1.61
0.20
0.40
0.60
0.80
1.00
1.20
1.40
1.60
1.80
Age standardized incidence rate
Figure 1 a: Age standardized incidence rates per 1000 for females with colorectal cancer, 2004–2014. b: Age standardized incidence rates per
1000 for males with colorectal cancer, 2004–2014. c: Age standardized incidence rates per 1000 for females with breast cancer, 2004–2014
Shuldiner et al. BMC Cancer (2018) 18:537
Page 5 of 10
a
Age standardized incidence rates
Age standardized incidence rates per neighborhood income quintilefor females with
colorectal cancer, 2004-2014
2.5
2
1.5
1
0.5
0
1
2
3
Income quintile
East Asia and Pacific
Middle East and North Africa
US, NZ and Australia
4
Europe and Central Asia
South Asia
5
Latin America and the Caribbean
Sub-Saharan Africa
b
Age standardized incidence rates perneighborhoodincome quintilefor males with
colorectal cancer, 2004-2014
Age standardized incidence rates
0.8
0.7
0.6
0.5
0.4
0.3
0.2
0.1
0
1
2
3
Income quintile
4
5
East Asia and Pacific
Europe and Central Asia
Latin America and the Caribbean
Middle East and North Africa
South Asia
Sub-Saharan Africa
US, NZ and Australia
c
Age standardized incidence rates
Age standardized incidence rates per neighborhood income quintilefor females with
breast cancer, 2004-2014
1.8
1.6
1.4
1.2
1
0.8
0.6
0.4
0.2
0
1
2
3
4
5
Income quintile
East Asia and Pacific
Middle East and North Africa
US, NZ and Australia
Europe and Central Asia
South Asia
Latin America and the Caribbean
Sub-Saharan Africa
Figure 2 a: Age- standardized incidence rates per neighborhood income quintile for female colorectal cancer, 2004–2014. b: Age- standardized
incidence rates per neighborhood income quintile for male colorectal cancer, 2004–2014. c: Age- standardized incidence rates per neighborhood
income quintile for female breast cancer, 2004–2014
colorectal cancer among males and females and of
breast cancer compared to those born in East Asia
and the Pacific (Table 3).
Discussion
Our results demonstrate several important findings
regarding immigrant health and cancer incidence in
Ontario. First, our multivariate regression analyses
showed that the healthy immigrant effect exists for
recent immigrant arrivals for breast and colorectal
cancer incidence but that it dissipated with time
and each year in Canada is associated with a 5–7%
increase in risk. Second, our study demonstrated
that place of birth was an important predictor, with
Shuldiner et al. BMC Cancer (2018) 18:537
Page 6 of 10
Table 2 Multivariate model for entire cohort by cancer site. Variables included in the model are age, sex (for colorectal cancer),
income and region of birth
Cancer
Colorectal Cancer
Sex
Male
Covariate
b
Age
RR (95% CI)a
p-value
1.41 (1.40, 1.41)
<.0001
Income
1 (lowest)
1.00
2
1.04 (1.01, 1.08)
0.0062*
3
1.03 (1.00, 1.06)
0.08
4
1.02 (0.99, 1.05)
0.22
5 (highest)
0.96 (0.93, 0.99)
0.0107
Place of birth
Colorectal Cancer
Female
Long term resident
1.00
East Asia and Pacific
0.57 (0.53, 0.61)
<.0001
Europe and Central Asia
0.87 (0.80, 0.93)
<.0001
Latin America and the Caribbean
0.42 (0.36, 0.47)
<.0001
Middle East and North
0.52 (0.46, 0.59)
<.0001
South Asia
0.26 (0.23, 0.29)
<.0001
Sub-Saharan Africa
0.52 (0.43, 0.63)
<.0001
USANZ
0.47 (0.34, 0.64)
<.0001
1.40 (1.35, 1.36)
<.0001
b
Age
Income
1
1.00
2
1.01 (0.98, 1.05)
0.40 *
3
1.00 (0.96, 1.04)
0.97
4
0.98 (0.95, 1.01)
0.34
5
0.95 (0.92, 0.99)
0.0059
Place of birth
Breast Cancer
Female
Long term resident
1.00
East Asia and Pacific
0.64 (0.60, 0.69)
<.0001
Europe and Central Asia
0.86 (0.79, 0.92)
<.0001
Latin America and the
0.58 (0.52, 0.65)
<.0001
Middle East and North
0.57 (0.48, 0.66)
<.0001
South Asia
0.27(0.23, 0.30)
<.0001
Sub-Saharan Africa
0.44 (0.35, 0.6)
<.0001
USANZ
0.56 (0.41, 0.75)
0.0001
1.21 (1.21, 1.21)
<.0001
b
Age
Income
1
1.00
2
1.07 (1.04, 1.09)
<.0001 *
3
1.12 (1.09, 1.14)
<.0001
4
1.17 (1.14, 1.19)
<.0001
5
1.21 (1.18, 1.24)
<.0001
Place of birth
Long term resident
1.00
East Asia and Pacific
0.74 (0.71, 0.77)
<.0001
Europe and Central Asia
0.90 (0.86, 0.94)
<.0001
Shuldiner et al. BMC Cancer (2018) 18:537
Page 7 of 10
Table 2 Multivariate model for entire cohort by cancer site. Variables included in the model are age, sex (for colorectal cancer),
income and region of birth (Continued)
Cancer
Sex
RR (95% CI)a
Covariate
p-value
Latin America and the
0.74 (0.70, 0.79)
<.0001
Middle East and North
0.96 (0.90, 1.03)
0.25
South Asia
0.64 (0.60, 0.67)
<.0001
Sub-Saharan Africa
0.73 (0.66, 0.80)
<.0001
USANZ
0.86 (0.75, 0.97)
0.018
a
Binomial regression model
b
per 5 years
*
P value of trend p < 0.005
Bold values are <0.05
those from Europe and Central Asia being at highest risk among immigrants of developing colorectal
cancer (incidence among men = .65 and females =0.
51) and those from South Asia having the lowest
rates (females = 0.14 and males = 0.18). Those from
the Middle East and North Africa were at highest
risk among immigrant women to develop breast cancer (incidence = 1.49) and those from South Asia were
the lowest (incidence- = 1.00). Third, we saw that
neighborhood income did not play a role in colorectal
cancer incidence but that higher neighborhood income was a risk factor for breast cancer incidence
among immigrant women (RR = 1.21 95% CI = 1.18, 1.
24).
Upon examining place of birth, we saw large differences (49–264% difference) in age standardized
rates between places of birth. In comparison to
long-term residents the largest differences were for
those born in South Asia who had the lowest rates
for colorectal and breast cancer. These differences
are most likely attributed to differences in their
home countries where South Asia has among the
lowest incidence rates compared to other regions for
breast and colorectal cancer [12]. Age-standardized
incidence rates for United States, New Zealand and
Australia were lower for breast and colorectal cancer compared to long-term immigrants. This was surprising, as
Canada is considered to be a historically high-risk area for
colorectal and breast cancer, similar New Zealand, United
States and Canada, reflecting similar dietary and lifestyle
factors [13].
Neighborhood income did not play a significant
role in colorectal cancer incidence. Those in the
highest neighborhood income quintile had slightly
lower rates of colorectal cancer in the regression
model including all Ontario residents; however, no
effect was seen when examining rates among only
immigrants. In contrast, we saw that higher neighborhood income was a risk factor for breast cancer
incidence, both unadjusted and in regression models.
Similarly, Canadian and American data have shown
that women in neighborhoods with higher neighborhood incomes have a higher risk of developing
breast cancer [14, 15].
An important dimension of the healthy immigrant
effect is that the immigrant advantage we found appeared to disappear after spending over 10 years in
Canada for both colorectal and breast cancer incidence. In addition, in the regression model limited
to immigrants we saw that risk of cancer increases
(5–7%) for each additional five years in Canada for
both colorectal and breast cancer. Similarly, researchers have previously found that among Ontarian immigrants, despite the original advantage with
immigration, there is a steady decline in survival,
and cancer-specific survival, over time [16]. Analysis of Statistics Canada’s Longitudinal Survey of
Immigrants to Canada showed a decline in selfassessed health, physical health, and mental health
among immigrants as little as two years after arrival
[17]. Some researchers believe that convergence in
health outcomes may stem from the process of acculturation where immigrants begin to take on
Canadian habits such as smoking, alcohol consumption and diet [18]. However, Canadian longitudinal
data from representative surveys have shown that
immigrants did not show higher rates of daily
smoking initiation, however, they were much more
likely than the Canadian-born population to have
had a substantial weight gain since immigrating
[19]. Though these habits may be influential, it is
unlikely that they are responsible for changes in incidence occurring over the short time observed in
this study.
Others maintain that worsening of health status is
due to barriers to health services including lack of
familiarity with the Canadian health system and language or cultural differences [20] that may lead to
the underuse of preventative health screening and
treatment of health problems. To that effect,
Shuldiner et al. BMC Cancer (2018) 18:537
Page 8 of 10
Table 3 Multivariate model for immigrant cohort by cancer site. Variables included in the model are age, sex (for colorectal cancer),
income, region of birth and length of stay
Cancer
Colorectal Cancer
Sex
Male
Covariate
a
Age
RR (95% CI)b
p-value
1.38 (1.36, 1.39)
<.0001
Income
1
1.00
2
0.98 (0.88, 1.10)
0.76
3
1.06 (0.95, 1.19)
0.29
4
1.01 (0.90, 1.14)
0.86
5
1.00 (0.88, 1.14)
0.98
Place of birth
East Asia and Pacific
1.00
Europe and Central Asia
1.45 (1.32, 1.60)
<.0001
Latin America and the Caribbean
0.70 (0.61, 0.80)
<.0001
Middle East and North Africa
0.90 (0.78, 1.03)
0.12
South Asia
0.45 (0.40, 0.51)
<.0001
Sub-Saharan Africa
0.88 (0.72, 1.06)
0.17
US, Australia and New Zealand
Colorectal Cancer
Female
0.80 (0.58, 1.09)
0.16
Length of staya
1.05 (1.02, 1.08)
0.0025
Agea
1.35 (1.33, 1.36)
<.0001
Income
1
1.00
2
0.92 (0.82, 1.03)
0.15
3
0.93 (0.82, 1.04)
0.21
4
1.02 (0.90, 1.15)
0.81
5
0.93 (0.81, 1.06)
0.27
Place of birth
East Asia and Pacific
1.00
Europe and Central Asia
1.31 (1.19, 1.45)
Latin America and the Caribbean
0.89 (0.78, 1.01)
0.062
Middle East and North Africa
0.88 (0.74, 1.04)
0.12
South Asia
0.42 (0.36, 0.49)
<.0001
Sub-Saharan Africa
0.67 (0.54, 0.85)
0.0008
US, Australia and New Zealand
Breast Cancer
Female
<.0001
0.86 (0.63, 1.16)
0.31
Length of staya
1.05 (1.01, 1.08)
0.0046
Agea
1.19 (1.18, 1.19)
<.0001
Income
1 (lowest)
1.00
2
1.00 (0.94, 1.06)
0.99 *
3
1.10 (1.03, 1.16)
0.0021
4
1.13 (1.06, 1.19)
0.0001
5 (highest)
1.13 (1.06, 1.20)
0.0004
Place of birth
East Asia and Pacific
1.00
Europe and Central Asia
1.19 (1.12, 1.25)
<.0001
Latin America and the Caribbean
0.96 (0.90, 1.03)
0.22
Shuldiner et al. BMC Cancer (2018) 18:537
Page 9 of 10
Table 3 Multivariate model for immigrant cohort by cancer site. Variables included in the model are age, sex (for colorectal cancer),
income, region of birth and length of stay (Continued)
Cancer
Sex
RR (95% CI)b
p-value
Middle East and North Africa
1.29 (1.20, 1.39)
<.0001
South Asia
0.86 (0.81, 0.91)
<.0001
Sub-Saharan Africa
0.95 (0.86, 1.05)
0.35
US, Australia and New Zealand
1.14 (0.99, 1.30)
0.06
1.07 (1.05, 1.08)
<.0001
Covariate
a
Length of stay
a
per 5 years
b
binomial regression models
*P value of trend p < 0.005
Bold values are <0.05
disparities in cervical and breast cancer screening for
foreign-born women have long been documented in
Ontario and Canada [21–26]. Similarly, research has
shown that cancer incidence may increase in the
first decade after immigration and it reaches the
population level in the host country in 1–2 generations [27, 28].
This large cohort study has examined cancer incidence among immigrants in Canada which has not
been examined since the 1990s [6]. Due to accurate
databases, universal health care and excellent linkage we could consider the effects of region of birth,
neighborhood income and length of stay. However,
there are several limitations that should be noted.
We were not able to determine if this was a cohort
effect where those that immigrated more recently
were healthier than those who immigrated over ten
years ago. Our analyses used the world-region-ofbirth; this method of grouping could be problematic
as countries within any region are not homogeneous. Given the absence of individual-level
income-related information, we linked residential
postal codes to neighborhood -level income which
may have misclassification errors in geocoding [11]
in rural areas, however, according to our data 99%
of all immigrants to Canada settle in urban areas.
Additionally, immigrants may have lived in other
countries other than their country of birth before
they came to Canada, thus possibly reducing the
significance of birthplace as a determinant. Finally,
our analysis was not able to account for risk factors
such as behaviour (i.e. smoking and alcohol) and
stress for cancer.
Conclusions
Our analysis showed breast and colorectal cancer incidence rates among immigrants to Ontario, Canada
are lower than residents and these rates differ according to region of birth, however, those advantages
diminish after arrival. Results from this hypothesisgenerating research initiative hold significant immigration and health policy implications, and add further
intricacy to the study of the social determinants of
health. The results call for Ontario to generate tools
and interventions to maintain the health of immigrant
population.
Abbreviations
ASIR: age-standardized incidence rates; CI: Confidence Intervals; RR: Rate ratios
Funding
This study is supported by the Institute for Clinical Evaluative Sciences, which
is funded by an annual grant from the Ontario Ministry of Health and LongTerm Care. The opinions, results, and conclusions reported in this paper are
those of the authors and are independent from the funding sources. No
endorsement by the Institute for Clinical Evaluative Sciences or the Ontario
Ministry of Health and Long-Term Care is intended or should be inferred.
Parts of this material are based on data and information provided by Cancer
Care Ontario (CCO). The opinions, results, views, and conclusions reported in
this paper are those of the authors and do not necessarily reflect those of
CCO. No endorsement by CCO is intended or should be inferred. All
inferences, opinions, and conclusions drawn in this paper are those of the
authors, and do not reflect the opinions or policies of the data stewards.
Immigration data was obtained from the Immigration, Refugees and
Citizenship Canada database held at the Institute for Clinical Evaluative
Sciences. Aisha Lofters is supported by a New Investigator Award from the
Canadian Institutes of Health Research and as a Clinician Scientist by the
University of Toronto Department of Family & Community Medicine. This
study was funded by a Career Development Award in Cancer Prevention
from the Canadian Cancer Society Research Institute (Aisha Lofters).
Availability of data and materials
The data that support the findings of this study are available from the
Institute for Clinical Evaluative Sciences of but restrictions apply to the
availability of these data, which were used under license for the current
study, and so are not publicly available. Data are however available from the
authors upon reasonable request and with permission of Institute for Clinical
Evaluative Sciences.
Authors’ contributions
J.S: Conceptualization of study, data interpretation and preparation of
manuscript. A.L: Conceptualization of study, data interpretation and
manuscript review. L.Y.: Statistical analysis and manuscript review. All authors
read and approved the final manuscript.
Shuldiner et al. BMC Cancer (2018) 18:537
Ethics approval and consent to participate
This study was approved by the institutional review board at Sunnybrook
Health Sciences Centre, Toronto, Canada. It contains deidentified data, and
therefore consent was waived by the institutional review board.
Competing interests
The authors declare that they have no completing interest.
Publisher’s Note
Springer Nature remains neutral with regard to jurisdictional claims in
published maps and institutional affiliations.
Author details
1
University of Toronto, 155 College Street, Toronto, ON M5T 1P8, Canada.
2
Institute for Clinical Evaluative Sciences, 2075 Bayview Ave, Toronto, ON
M4N 3M5, Canada. 3Li Ka Shing Knowledge Institute, 209 Victoria St, Toronto,
ON M5B 1T8, Canada.
Received: 9 February 2018 Accepted: 26 April 2018
References
1. Chen J, Ng E, Wilkins R. The health of Canada's immigrants in 1994-95.
Health Re. 1996;7:33–46.
2. Cormier RA, Dell CA, Poole N. Women’s health surveillance report. A multidimensional look at the health of Canadian women. Ottawa: Canadian
Institute for Health Information; 2003.
3. Singh GK, Miller BA. Health, life expectancy, and mortality patterns
among immigrant populations in the United States. Can J Public
Health. 2004;95(3):14–21.
4. De Maio FG. Immigration as pathogenic: a systematic review of the health
of immigrants to Canada. Int J Equity Health. 2010;9(1):27.
5. Statistics Canada. 2011 National Household Survey. Statistics Canada
Catalogue no. 99-004-XWE. Ottawa. 2013. (Accessed 3 May 2018).
6. McDermott S, DesMeules M, Lewis R, Gold J, Payne J, Lafrance B, Vissandjée B,
Kliewer E, Mao Y. Cancer incidence among Canadian immigrants, 1980–1998:
results from a national cohort study. J Immigr Minor Health. 2011;13(1):15–26.
7. Canadian Cancer Statistics 2017. Canadian Cancer Society’s advisory
committee on Cancer statistics. Toronto: Canadian Cancer Society; 2017.
8. Papanicolas I, Smith P. Health system performance comparison: an agenda
for policy, information and research: an agenda for policy, information and
research. McGraw-Hill Education (UK); 2013.
9. Chiu M, Lebenbaum M, Lam K, Chong N, Azimaee M, Iron K, Manuel D,
Guttmann A. Describing the linkages of the immigration, refugees and
citizenship Canada permanent resident data and vital statistics death
registry to Ontario’s administrative health database. BMC Med Inform Dec
Making. 2016;16(1):135.
10. Robles SC, Marrett LD, Clarke EA, Risch HA. An application of capture-recapture
methods to the estimation of completeness of cancer registration. J Clin
Epidemiol. 1988;41(5):495–501.
11. Statistics Canada. Postal CodeOM Conversion File Plus (PCCF+) Version 6B,
Reference Guide. November 2014 Postal Codes. Statistics Canada Catalogue
no. 82-E0086-XDB. Ottawa: Minister of Industry; 2015.
12. Global Burden of Disease Cancer C. Global, regional, and national cancer
incidence, mortality, years of life lost, years lived with disability, and disabilityadjusted life-years for 32 cancer groups, 1990 to 2015: a systematic analysis for
the global burden of disease study. JAMA Oncol. 2017;3(4):524–48.
13. Jemal A, Center MM, DeSantis C, Ward EM. Global patterns of cancer
incidence and mortality rates and trends. Cancer Epidemiol Prev Biomark.
2010;19(8):1893–907.
14. Borugian MJ, Spinelli JJ, Abanto Z, Xu CL, Wilkins R. Breast cancer incidence
and neighbourhood income. Health Rep. 2011;22(2):7.
15. Robert SA, Trentham-Dietz A, Hampton JM, McElroy JA, Newcomb PA,
Remington PL. Socioeconomic risk factors for breast cancer: distinguishing
individual-and community-level effects. Epidemiology. 2004;15(4):442–50.
16. Cheung MC, Earle CC, Fischer HD, Camacho X, Liu N, Saskin R, Shah BR,
Austin PC, Singh S. Impact of Immigration Status on Cancer Outcomes in
Ontario, Canada. J Oncol Pract. 2017:JOP. 2016;13(7):e602–12.
17. Newbold B. The short-term health of Canada's new immigrant arrivals:
evidence from LSIC. Ethn Health. 2009;14(3):315–36.
Page 10 of 10
18. Hyman I. Immigration and health. In: Health policy working paper 01–05.
Ottawa: Health Canada; 2001.
19. Ng E, Wilkins R, Gendron F, Berthelot JM. Dynamics of Immigrants' Health in
Canada: Evidence from the National Population Health Survey. Ottawa:
Statistics Canada; 2005.
20. Leclere FB, Jensen L, Biddlecom AE. Health care utilization, family context,
and adaptation among immigrants to the United States. J Health Soc
Behav. 1994:370–84.
21. Lofters AK, Moineddin R, Hwang SW, Glazier RH. Predictors of low cervical
cancer screening among immigrant women in Ontario, Canada. BMC
Womens Health. 2011;11(1):20.
22. Lofters A, Glazier RH, Agha MM, Creatore MI, Moineddin R. Inadequacy of
cervical cancer screening among urban recent immigrants: a populationbased study of physician and laboratory claims in Toronto, Canada. Prev
Med. 2007;44(6):536–42.
23. Sun Z, Xiong H, Kearney A, Zhang J, Liu W, Huang G, Wang PP. Breast
cancer screening among Asian immigrant women in Canada. Cancer
Epidemiol. 2010;34(1):73–8.
24. Vahabi M, Lofters A, Kumar M, Glazier RH. Breast cancer screening disparities
among urban immigrants: a population-based study in Ontario, Canada.
BMC Public Health. 2015;15(1):679.
25. Wilkins K, Shields M. Colorectal cancer testing in Canada-2008. Health Rep.
2009;20(3):21.
26. Shields M, Wilkins K. An update on mammography use in Canada. Health
Rep. 2009;20(3):7.
27. Thomas DB, Karagas MR. Cancer in first and second generation Americans.
Cancer Res. 1987;47(21):5771–6.
28. Ziegler RG, Hoover RN, Pike MC, Hildesheim A, Nomura AM, West DW, WuWilliams AH, Kolonel LN, Horn-Ross PL, Rosenthal JF. Migration patterns and
breast cancer risk in Asian-American women. J Natl Cancer Inst. 1993;85(22):
1819–27.