Association studies in yield and grain quality traits in aromatic and non aromatic families of rice
Bạn đang xem bản rút gọn của tài liệu. Xem và tải ngay bản đầy đủ của tài liệu tại đây (382.55 KB, 8 trang )
Int.J.Curr.Microbiol.App.Sci (2020) 9(5): 2940-2947
International Journal of Current Microbiology and Applied Sciences
ISSN: 2319-7706 Volume 9 Number 5 (2020)
Journal homepage:
Original Research Article
/>
Association Studies in Yield and Grain Quality Traits in Aromatic and
Non Aromatic Families of Rice
A. R. Priyanka1*, P. Jeyaprakash1, K. Baghyalakshmi2 and Ramchander2
1
Department of Plant Breeding and Genetics,
Agricultural College and Research Institute, Madurai – 625 104, Tamil Nadu, India
1
Department of Rice, Centre for Plant Breeding and Genetics,
TNAU, Coimbatore – 641 003, Tamil Nadu, India
2
ICAR- Central Institute for Cotton Research (RS), Coimbatore, India
2
ICRISAT, Patencheru, Hyderabad, India
*Corresponding author
ABSTRACT
Keywords
Correlation, Yield,
Grain quality, Rice,
Elongation ratio
Article Info
Accepted:
23 April 2020
Available Online:
10 May 2020
The exploitation of yield potential through inter sub specific (inter-racial) hybridization
become a challenging task for rice breeders. Grain yield improvement is considered to be
prime objective of any breeding programme, quality traits are yet another important
consideration of rice breeding in India. Association of yield and yield components and
among grain quality traits thus assumes a unique prominence as the basis for selecting
desirable high yielding genotypes with good grain quality characters. Correlation analysis
is basic and foremost effort to find out strategies for plant selection. Hundred grain weight
showed significant and negative correlation with grain yield per plant. Linear elongation
ratio showed significant and positive correlation with kernel breadth, kernel breadth before
cooking, kernel length after cooking, and LB ratio after cooking and hence selection of
these traits will serve in improvement of LER. Direct effect of number of productive tillers
per plant was found to be high on single plant yield.
Introduction
Rice is one of the pivotal stable food and
primary food source for most of the world
population. Breed a variety with high yield
and good grain quality characters is an
important goal of breeders. The international
rice market is highly segmented because
consumer preference is highly heterogeneous,
not only across countries but also within
countries. The rice grain quality traits
generally include milling quality, appearance
quality, and nutritional quality in terms of
cooking and eating quality which are most
important for the consumers. Hence selection
for improved milling, cooking, eating and
processing qualities is crucial to meet
consumers’ preference and industry standards.
2940
Int.J.Curr.Microbiol.App.Sci (2020) 9(5): 2940-2947
Rice grain quality is important not only from
the consumer's point of view, but also for rice
farmers. Development of plant breeding
strategy mainly depends on the nature of
association of major quantitative traits with
yield, quality or any other economic trait.
Correlation coefficient ensures the degree of
association,
genetic
or
non-genetic
relationship between two or more characters
which forms the basis for selection. The
degree of correlation between the traits is a
key factor especially in complex and
economic trait such as yield. Path analysis
simply splits the correlation coefficient into
the measures of direct and indirect effect of a
set of independent variables on the dependent
variables.
Milling percentage
Materials and Methods
Kernel length
The experimental material comprised of 437
F3 families of CB 08504 X Improved Pusa
Basmati 1. All the 437 families were raised.
All the agronomical practices were done.
Based on grain type 50 single plants were
selected. Yield contributing traits viz., days to
50 per cent flowering (days), plant height
(cm), number of tillers per plant, number of
productive tillers per plant, panicle length
(cm), hundred grain weight, grain yield per
plant and fifteen grain quality characters viz.,
hulling percentage, milling percentage, head
rice recovery, kernel length, kernel breadth,
length / breadth ratio, kernel length before
cooking, kernel breadth before cooking,
kernel length after cooking, kernel breadth
after cooking, LB ratio after cooking, linear
elongation ratio, breadth wise expansion ratio,
gelatinization temperature, gel consistency
and amylose content were recorded for 50
single plants.
Length of ten unbroken brown rice was
measured using graph sheet and the mean was
expressed in millimeter (mm)
Hulling percentage
Head rice recovery (HRR)
Head rice recovery or milling recovery is the
estimate of head rice (milled rice with more
than two third size) and expressed in
percentage
Kernel breadth
Breadth of ten unbroken rice was measured
using a graph sheet and the mean was
expressed in mm.
Linear elongation ratio (LER)
The ratio of mean length of cooked rice to
mean length of milled rice was computed as
linear elongation ratio (Juliano and Perez,
1984).
Gelatinization
temperature
(GT)
was
estimated based on alkali spreading score
(ASV) of milled rice. The method developed
by Little et al., (1958) was used to score alkali
spreading value. Gel consistency (GC)was
analyzed based on the method described by
Cagampang et al., (1973).Statistical analysis
were done using TNAUSTAT. Correlation
figure was done using Graph Pad Prism
software.
2941
Int.J.Curr.Microbiol.App.Sci (2020) 9(5): 2940-2947
In path analysis, grain yield per plant and
linear elongation ratio was considered as
dependent characters for yield characters and
grain quality characters respectively.
Results and Discussion
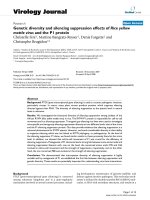
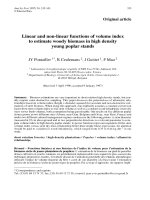
Grain yield per plant showed significant and
negative correlation with hundred grain
weight. Plant height showed significant
positive correlation with number of tillers per
plant, days to fifty percent flowering showed
significant positive correlation with plant
height, plant height showed significant
positive correlation with number of
productive tillers per plant, number of tillers
per plant showed significant positive
correlation with number of productive tillers
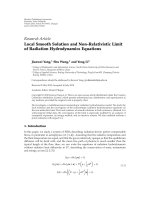
per plant. In grain quality characters, linear
elongation ratio showed significant and
positive correlation with kernel breadth,
kernel breadth before cooking, kernel length
after cooking, LB ratio after cooking and
significant negative association with head rice
recovery, kernel length, LB ratio, kernel
length before cooking and breadth wise
expansion ratio. Krishnaveni and Rani (2006),
Mahalingam (2008) reported that kernel
breadth, kernel length after cooking showed
positive association with linear elongation
ratio. Asish et al., (2007) reported that kernel
length showed negative association with
linear elongation ratio. Chauhan et al., (1995),
Arulmozhi and Muthuswamy (2013) reported
that LB ratio showed negative association
with LER. Hence selection of these traits viz.,
kernel breadth, kernel breadth before cooking,
kernel length after cooking, LB ratio after
cooking will serve in improvement of LER
(Fig. 1 and 2; Table 1–4).
Inter correlation
character
among
the
quality
Kernel length showed positive association
with LB ratio, kernel length before cooking,
kernel length after cooking, breadth wise
expansion ratio and negative association with
kernel breadth, kernel breadth before cooking.
Santhipriya et al., (2017) and Venkanna et al.,
(2014) reported that kernel length positive
association with LB ratio. Kernel breadth
exhibited positive association with kernel
breadth before cooking and significant and
negative association with LB ratio, kernel
length before cooking and breadth wise
expansion ratio. LB ratio exhibited significant
positive association with kernel length before
cooking, breadth wise expansion ratio and
significant negative association with kernel
breadth before cooking. Kernel length before
cooking
showed
significant
positive
association with kernel length after cooking,
breadth wise expansion ratio and significant
negative association with kernel breadth
before cooking.
Kernel breadth before cooking showed
significant negative association with breadth
wise expansion ratio. Kernel length after
cooking
showed
significant
positive
association with LB ratio after cooking.
Kernel breadth after cooking showed
significant positive association with breadth
wise expansion ratio and significant
association with LB ratio after cooking.
Path analysis
characters
for
yield
attributing
Days to 50 % flowering, plant height and
number of productive tillers per plant
exhibited positive direct effect on grain yield
per plant. Direct effect of number of
productive tillers per plant was found to be
high. AshutoshSawarkar and Senapati (2014)
reported that days to fifty per cent flowering
showed low positive direct effects on grain
yield per plant and Nandan et al., (2010),
Ashim and Ghosh (2012) reported that plant
height showed low direct effects on grain
yield/plant. Selection based on number of
2942
Int.J.Curr.Microbiol.App.Sci (2020) 9(5): 2940-2947
productive tillers per plant is very effective.
Table.1 Correlation analysis for morphological traits
Character DFF
1
DFF
PH
NT/P
NPT/P
PL
HGW
GY/P
PH
0.301*
1
NT/P
0.184
0.391**
1
NPT/P
0.189
0.434**
0.979**
1
PL
0.056
0.200
0.070
0.092
1
HGW
-0.210
-0.116
0.049
0.041
-0.094
1
GY/P
0.279
0.266
0.013
0.072
0.075
-0.343*
1
Table.2 Path coefficient analysis of morphological traits
Character
DFF
PH
NT/P
NP/P
PL
HGW
GY/P
DFF
0.1775
0.0450
-0.2150
0.2137
-0.0007
0.0583
0.2788
PH
0.0533
0.1498
-0.4578
0.4908
-0.0026
0.0322
0.2658
NT/P
0.0326
0.0586
-1.1698
1.1062
-0.0009
-0.0137
0.0131
NPT/P
0.0335
0.0650
-1.1448
1.1304
-0.0012
-0.0114
0.0717
PL
0.0100
0.0300
-0.0822
0.1043
-0.013
0.0261
0.0753
HGW
-0.0372
-0.0173
-0.0576
0.0464
0.0012
-02782
-0.3428
Residual effect: 0.8664
Fig.1 Correlation coefficient among yield and yield contributing traits
2943
Int.J.Curr.Microbiol.App.Sci (2020) 9(5): 2940-2947
Table.3 Correlation analysis for grain quality traits
Traits
H%
M%
HRR
KL
KB
LBR
KLBC
KBBC
KLAC
KBAC
LBAC
BER
GC
GT
AC
LER
H%
1
-0.020
0.234
-0.168
0.054
-0.129
-0.146
0.085
-0.275
-0.042
-0.0249
-0.098
0.177
-0.078
-0.115
-0.093
1
0.018
0.014
-0.060
0.031
0.087
0.020
-0.039
-0.079
-0.002
-0.056
-0.059
0.001
-0.0276
-0.147
1
0.253
-0.075
0.191
0.162
-0.107
-0.176
-0.160
-0.061
-0.011
0.013
-0.098
-0.021
-0.297*
1
-0.378**
0.847**
0.913**
-0.485**
0.330**
0.220
0.178
0.549**
0.046
-0.149
-0.214
-0.487**
1
-0.808**
-0.420**
0.928**
-0.021
0.227
-0.152
-0.696**
-0.091
-0.109
0.158
0.345**
1
0.813**
-0.838**
0.205
0.018
0.178
0.754**
0.087
-0.040
-0.221
-0.512**
1
-0.499**
0.448**
0.254
0.274
0.584**
0.156
-0.140
-0.203
-0.464**
1
-0.011
0.163
-0.108
-0.806**
-0.176
0.021
0.144
0.421**
1
0.244
0.810**
0.135
-0.035
-0.037
0.055
0.520**
1
-0.360**
0.448**
0.110
-0.068
0.060
0.115
1
-0.138
-0.115
0.027
0.063
0.418**
1
0.230
-0.068
-0.093
-0.306*
1
-0.078
-0.028
-0.109
1
-0.014
0.035
1
0.189
M%
HRR
KL
KB
LBR
KLBC
KBBC
KLAC
KBAC
LBAC
BER
GC
GT
AC
1
LER
2944
Int.J.Curr.Microbiol.App.Sci (2020) 9(5): 2940-2947
Table.4 Path coefficient analysis of grain quality traits
Traits
H%
M%
HRR
KL
KB
LBR
KLBC
KBBC
KLAC
KBAC
LB(AC)
BER
GC
GT
AC
LER
H%
-0.131
-0.013
0.0001
-0.324
0.259
0.1285
0.275
-0.102
0.563
-3.682
0.726
1.206
1.822
1.841
-2.971
-0.403
M%
0.0225
0.080
0.0002
0.2034
-0.176
-0.095
-0.157
0.074
-0.243
1.938
-0.555
-0.630
-1.037
-1.017
1.766
0.1724
HRR
0.0133
0.020
0.001
0.0643
-0.059
-0.030
-0.104
0.0079
-0.299
1.3586
-0.084
-0.322
-0.453
-0.511
0.4407
0.0402
KL
0.094
0.036
0.0001
0.453
-0.340
-0.183
-0.357
0.1362
-0.692
4.625
-0.978
-1.436
-2.236
-2.278
3.568
0.4103
KB
0.093
0.038
0.0002
0.4212
-0.366
-0.177
-0.366
0.133
-0.718
4.801
-0.966
-1.489
-2.180
-2.398
3.528
0.352
LBR
0.082
0.037
0.0001
0.407
-0.319
-0.204
-0.373
0.123
-0.738
4.689
-0.871
-1.333
-2.03
-2.194
3.073
0.349
KLBC
0.078
0.027
0.0002
0.3508
-0.290
-0.164
-0.461
0.096
-0.995
5.839
-0.644
-1.496
-2.011
-2.245
2.259
0.339
KBBC
0.081
0.036
0
0.372
-0.294
-0.151
-0.268
0.165
-0.277
3.365
-1.172
-1.309
-2.080
-1.944
3.752
0.275
KLAC
0.0679
0.018
0.0003
0.287
-0.241
-0.138
-0.421
0.0421
-1.092
5.4008
-0.274
-1.226
-1.553
-1.944
1.394
0.3196
KBAC
0.0807
0.026
0.0002
0.3492
-0.293
-0.159
-0.448
0.092
-0.981
6.010
-0.629
-1.565
-2.019
-2.332
2.265
0.395
LB(AC)
0.079
0.037
0.0001
0.370
-0.295
-0.148
-0.248
0.162
-0.250
3.158
-1.197
-1.305
-2.040
-1.958
3.863
0.227
BER
0.082
0.026
0.0002
0.339
-0.284
-0.141
-0.359
0.113
-0.697
4.899
-0..813
-1.920
-2.001
-2.899
3.950
0.293
GC
0.096
0.033
0.0002
0.41
-0.323
-0.167
-0.375
0.139
-0.685
4.903
-0.987
-1.552
-2.475
-2.096
3.80
0.401
GT
0.078
0.026
0.0002
0.336
-0.285
-0.145
-0.337
0.1048
-0.690
4.554
-0.762
-1.809
-1.686
-3.077
3.937
0.244
AC
0.083
0.030
0.0001
0.3447
-0.275
-0.133
-0.222
0.1325
-0.324
2.899
-0.985
-1.615
-1.834
-2.58
4.697
0.2174
Residual effect:0.766
2945
Int.J.Curr.Microbiol.App.Sci (2020) 9(5): 2940-2947
Fig.2 Correlation coefficient among grain quality traits
Sandhya et al., (2014) reported similar results.
The indirect effect of plant height exhibited
high positive on number of productive tillers
per plant and negative through number of
tillers per plant. Number of tillers per plant
exhibited very high positive indirect effect on
number of panicle per plant. Very high
negative indirect effect was recorded by
number of productive tillers per plant through
number of tillers per plant.
Path analysis for quality character
Out of sixteen character subjected to assess
the direct effects of linear elongation ratio,
six characters viz., milling percentage, head
rice recovery, kernel length, kernel breadth
before cooking, kernel breadth after cooking,
amylose content showed positive direct effect
on linear elongation ratio. Premkumar et al.,
(2016) reported the same results. The direct
effect of kernel breadth after cooking and
amylose content were found to be very high
on LER. Hulling percentage exhibited very
high positive indirect effect on breadth wise
elongation ratio, gel consistency and
gelatinization temperature. Very high positive
indirect effect was exhibited by milling
percentage on kernel breadth after cooking
and amylose content. The indirect effect of
head rice recovery was found to be very high
on kernel breadth after cooking. Very high
positive indirect effect was observed in kernel
length on kernel breadth after cooking and
amylose content. The indirect effect of kernel
breadth was found to be on kernel breadth
after cooking, amylose content. Kernel
breadth after cooking and amylose content
was found to be very high indirect effect on
LB ratio. The indirect effect of gel
consistency was found to be very high on
kernel breadth after cooking and amylose
content. Very high indirect effect of
gelatinization temperature was observed on
kernel breadth after cooking and amylose
content
References
Arulmozhi, R. and A. Muthuswamy. 2013.
Correlation studies on grain yield and
its component traits in rice (Oryza
sativa L). Int. J. Sci. Res. 2(11): 2277 –
81709.
Ashim.C and P.D. Ghosh. 2012. Grain
dimension studies in view of kernel
2946
Int.J.Curr.Microbiol.App.Sci (2020) 9(5): 2940-2947
weight development in traditional rice
of West Bengal. Int. J. Biosci.10(2): 95102.
Ashutosh, S and B. K. Senapati.
2014.Polygenic variations and cause
effect relationship in some photoinsensitive recombinant inbred lines
(RIL’s) of Basmati derivative. Afr. J.
Biotechnol. 13(1): 112 - 118.
Asish, K., Binodh, R. Kalaiyarasi and K.
Thiyagarajan. 2007. Genetic parameter
studies on quality traits in rice. Madras
Agric. J. 94 (1-6): 109-113.
Cagampang, G.B., C.M. Perez and
B.O.Juliano. 1973. A gel consistency
test for eating quality rice. J. Sci. Food
Agric. 243: 1589- 1594.
Chauhan, J. S., V. S. Chauhan and S. B.
Lodh. 1995. Comparative analysis of
variability and correlations between
quality components in traditional
rainfed upland and low land rice. Indian
J Genet., 55 : 6-12.
Julino, B.O and C. M. Perez. 1984. Results of
collaborative test on the measurement
of grain elongation of milled rice during
cooking .J. Cereal Sci. 2: 281-292.
Krishnaveni, B and N. S. Rani. 2006.
Association of grain yield with quality
characteristics
and
other
yield
components in rice. Oryza. 43(4): 320322.
Little, R. R., G.B. Hilder and E. H. Dawson.
1958. Differential effect of dilute alkali
on 25 varieties of milled white rice.
Cereal Chemistry, 35 (2): 111–126.
Mahalingam, A. 2008.Genetic Analysis of
Yield, Grain quality and Blast
Resistance in Rice (Oryza sativa L.)
through
North
Carolina.
M.Sc
(Ag.)Thesis, TNAU, Coimbatore. India.
Nandan, R., Sweta and S.K. Singh. 2010.
Character association and path analysis
in Rice (Oryza sativaL.) genotypes.
World
Journal
of
Agricultural
Sciences.6 (2): 201-206.
Premkumar R., R. P. Gnanamalar and C. R.
Anandakumar. 2016. Correlation and
path coefficient analysis of grain quality
traits in rice (Oryza sativa L.). Indian J.
Agric. Res., 50 (1): 27-32
Sandhya, G., S. Babu and Ravikumar. 2014.
Genetic variability, interrelationship and
path analysis for yield improvement of
rice genotypes. The Bioscan. 9 (3):
1161-1164.
Santhipriyach., Y. Suneetha, D. Ratnababu
and V. Srinivasarao. 2017. Interrelationship and path analysis for yield
and quality characters in rice (Oryza
sativa L.). International journal of
science, Environment and Technology.
6(1): 381-390.
Venkanna, V., M. V. B. Rao, S. Raju, V.T.
Raoand N. Lingaiah. 2014. Association
analysis of F2 generation in Rice (Oryza
sativa. L.).Int. J. Pure App. Biosci. 2
(2): 278-283.
How to cite this article:
Priyanka, A. R., P. Jeyaprakash, K. Baghyalakshmi and Ramchander. 2020. Association
Studies in Yield and Grain Quality Traits in Aromatic and Non Aromatic Families of Rice.
Int.J.Curr.Microbiol.App.Sci. 9(05): 2940-2947. doi: />
2947