Assessment of technological gap and productivity gain in cowpea through front line demonstrations
Bạn đang xem bản rút gọn của tài liệu. Xem và tải ngay bản đầy đủ của tài liệu tại đây (224.12 KB, 7 trang )
Int.J.Curr.Microbiol.App.Sci (2020) 9(5): 2771-2777
International Journal of Current Microbiology and Applied Sciences
ISSN: 2319-7706 Volume 9 Number 5 (2020)
Journal homepage:
Original Research Article
/>
Assessment of Technological Gap and Productivity Gain in Cowpea
through Front Line Demonstrations
Shaukat Ali1*, Balbir Singh, Aditi Gupta and Ajesh Kumar
Krishi Vigyan Kendra, Chandgothi, Churu-331305 (Rajasthan), India
*Corresponding author
ABSTRACT
Keywords
Cowpea, Grain
yield, Economics,
Technology gap,
Extension gap
Article Info
Accepted:
23 April 2020
Available Online:
10 May 2020
KVK, Chandgothi, Churu (Rajasthan) conducted total 50 Front Line
Demonstrations on cowpea at farmers field in Churu District (Rajasthan)
during two consecutive kharif seasons from 2014 to 2015. The farming
situation was rainfed and soil was sandy loam low in nitrogen, medium in
phosphorus and medium to high in potash. Assessment of gap was done
and on the basis of gap assessment, improved recommended technologies
were demonstrated. On overall average basis, 19.98 % higher grain yield
was recorded under demonstrations than the farmer’s traditional practices
(Local check). The extension gap, technology gap and technology index
were 195 kg/ha, -170 kg/ha and 16.64 per cent, respectively. An additional
investments of Rs 300 per ha consist with scientific monitoring of
demonstration and non–monetary factors resulted in additional return of Rs.
6393 per ha. On two year average basis incremental benefit : cost ratio was
found 21.31.
Introduction
Pulses are the backbone of Indian agriculture
as well as pulses play important role in Indian
cropping systems. Pulse crops are primarily
grown under rainfed condition and a low
fertility neglected soil in India. It can be
grown on a variety of soil and climatic
conditions as it is tolerant to drought (Malik
et al., 2006). Pulse or ‘Daal’ are an integral
part of the average Indian meal. A large
population of the Indian population is
vegetarian and pulses form the main source of
protein. The protein content in pulses is about
18-25 per cent. This makes pulses one of the
cheapest sources of protein for human
consumption (Dayanand et al., 2014). Pulse is
the second most important groups after
cereals (Dash and Rautaray, 2017). The per
capita availability of pulses has declined from
60.55 g/day in 1951 to 41.64 g/day in 2012.
The productivity of pulses is very low in India
is 588 kg/ha, as compared to highest 2034
kg/ha in USA during 2016 (Anonymous,
2771
Int.J.Curr.Microbiol.App.Sci (2020) 9(5): 2771-2777
2018). In Rajasthan state, the total area under
cowpea cultivation is 93,619 hectares with
production of 38,152 MT. The average
productivity of cowpea in Rajasthan is 408
kg/ha. So far, as Churu district of Rajasthan is
concerned total area under cowpea cultivation
4,685 hectare with productivity of 633 kg/ha
(Anonymous 2017-18), which is much lower
than the potential.
At present the productivity of cowpea is not
sufficient due to several biotic and abiotic
stresses besides unavailability of quality seeds
of improved varieties in time and poor crop
management practices due to unawareness
and non adoption of recommended production
and plant protection technologies. To enhance
the productivity of cowpea, it is necessary to
cultivate cowpea in scientific manner and
brought the newly developed production
technologies at farmer’s field. Therefore,
Front Line Demonstration on cowpea at
farmer’s field may be helpful to establish the
technology at farming community. The basic
objective of this programme is to demonstrate
improve proven technologies of recently
released, short duration, high yielding disease
resistant varieties in compact block with INM,
IWM and IPM at farmer’s field (Table 1)
through Krishi Vigyan Kendras to enhanced
adoption of modern technologies to generate
yield data with farmers feedback. Keeping
this in view, KVK, Chandgothi, Churu
conducted 50 demonstrations on cowpea crop
at farmer’s field during kharif 2014 to kharif
2015. The objectives of this study were as
follows:
To find out the performance of recognized
and recommended high yielding
variety of cowpea with full
recommended package of practices.
To compare the yield of FLD organized by
KVK with local check (farmer’s
practices).
To collect and consider the feedback
information from farmers for further
improvement in research.
Materials and Methods
KVK, Chandgothi, Churu conducted total 50
Front Line Demonstrations on cowpea variety
RC 19 at 50 selected farmer’s field in a
compact block in Churu District (Rajasthan)
during kharif 2014 and kharif 2015. The
selection of villages was done on basis of non
adoption of improved and recommended
variety (RC 19). After the selection of
villages, most approachable side of farmer’s
field was selected, so that the performance of
demonstrated technology can be seen by other
farmers. The farming situation was rainfed
and soil was sandy loam low in nitrogen,
medium in phosphorus and medium to high in
potash. The area for demonstration was 0.4 ha
each and were conducted by using
recommended package of practices. The KVK
provided high quality seed of cowpea variety
i.e. RC 19 @ 15 kg/ha and other critical input
like DAP, micro-nutrients, bio fertilizers,
herbicide and pesticides were purchased by
the farmers and used with the guidance of
KVK during both the years. The sowing of
crops was done on the onset of monsoon,
most of time it was mid July and harvested
during first week of October. The scientist of
KVK, Chandgothi, Churu regularly visited
and monitored demonstrations on farmers
fields from sowing to harvesting. The grain
yield of demonstration and local check was
recorded and analyzed. Other parameters as
suggested by Verma et al., (2014) were used
for calculating gap analysis, cost and returns.
The details of different parameters are as
follows:
Extension gap = Demonstration yield (D1) Farmers practices yield (F1)
Technology gap = Potential yield (P1) Demonstration yield (D1)
2772
Int.J.Curr.Microbiol.App.Sci (2020) 9(5): 2771-2777
Technology index =
Potential yield (P1) - Demonstration yield (D1) x 100
Potential yield (P1)
Additional return = Demonstration return
(Dr) - Farmers practices return (Fr)
Effective gain = Additional return (Ar) –
Additional cost (Dc)
Incremental B:C ratio = Additional return (Ar)
Additional cost (Dc)
Results and Discussion
Grain yield
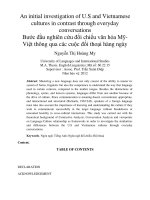
The average grain yield of cowpea under
demonstration plot was recorded 1170 kg/ha,
while, in farmer’s practices plot it was 975
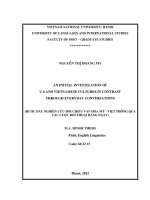
kg/ha (Table 3 & Fig. 2). The grain yield was
increased from 18.51 to 21.45 per cent over
farmer’s practices (local check) during both
the years. On average basis, 19.98 per cent
increase in yield was recorded under
demonstrations plot as compared to farmer’s
local cultivation practices of cowpea. While it
was 110.43, 350.00 and 17.00 per cent higher
as compared to state, district yield and
potential yield (Table 2 & Fig. 1).
Gap analysis
An extension gap between demonstrated
technology and farmer’s practices was ranged
from 185 kg/ha to 204 kg/ha during both the
year. On two year average basis, extension
gap of total 50 demonstrations was observed
195 kg/ha (Table 3). Such big gap might be
attributed to adoption of improved technology
in demonstration which resulted in higher
grain yield than the traditional farmer’s
practices. Wide technology gap of -184 to 155 kg/ha in yield was observed during the
demonstrations years. Average technology
gap of 50 demonstrations was -170 kg/ha.
Minus data in technology gap during both the
years indicated more feasibility of
recommended technologies during study
periods. Lower technology gap showed
(Table 3) that combination of improved
varieties with recommended package of
practices perform better than the potential
yield of varieties. Similarly, the technology
index for all the demonstrations during the
study period were in accordance with
technology gap. Technology index were
ranged from 15.63 per cent to 17.66 per cent
with an average of 16.64 per cent. Lower
technology index reflected the adequate
proven technology for transferring to farmers
and sufficient extension services for transfer
of technology.
Economics analysis
Improved variety seed, fertilizers, bio
fertilizers, herbicides and pesticides were
considered as cash inputs for the
demonstrations as well as farmers practices.
On an average additional investment of Rs
300 per hectare was made under
demonstration resulted in additional return of
Rs 6,393 per hectare. Economics returns as a
function of grain yield and selling price varied
during both the years. The total return under
demonstration plot was ranged from Rs
29,600 per hectare to Rs 46,200 per hectare
with an average of Rs 37,900 per hectare.
Higher return was obtained during year 2015
due to higher grain yield and higher selling
price. While, in farmer’s local practices plot
total return ranged from 24,975 Rs per hectare
to 38,040 Rs per hectare with an average of
31,508 Rs per hectare (Table 4). The higher
effective gain of 6,093 Rs per hectare was
obtained under demonstration. The higher
additional returns and effective gain under
demonstration could be due to improved
technology, non-monetary factors, timely
operations of crop cultivation and scientific
monitoring. The Incremental B:C ratio
2773
Int.J.Curr.Microbiol.App.Sci (2020) 9(5): 2771-2777
(IBCR) during both the years was found
between 15.42 to 27.20. On the average of
two years, IBCR was found 21.31. Higher
IBCR could be due to higher additional return
with low additional cost in demonstration.
clusterbean crops by Dayanand et al., (2014),
Dwivedi et al., (2018), Rachhoya et al.,
(2018), Rawat and Rajput (2018), Singh and
Sharma (2018), Jain et al., (2019), Ali and
Singh (2020) and Bamboriya et al., (2020).
The results confirm with the finding of Front
Line Demonstration on oilseeds, pulse and
Table.1 Comparison between technological intervention and local check and gap analysis under
FLDs on cowpea
Sr.
No.
1.
2.
Particulars
Technological Intervention
(Demonstration Practices )
Farming
Situation
Variety
Rainfed
Farmers Practices
(Local Check)
Rainfed
Technological
Gap
No Gap
Improved variety i.e. RC 19
Locally available
Full Gap (100
%)
No Gap
Full Gap (100
%)
No Gap
15 kg/ha
Rhizobium and PSB
15 kg/ha
No Seed Inoculation
5.
Seed Rate
Seed
inoculation
Sowing Method
Line Sowing (30x10 cm )
6.
Fertilizer
15 kg N, 40 kg P2O5
Line Sowing (30x10
cm )
No use of fertilizer
7.
Micro-nutrients
8.
Weed Control
9.
Plant protection
Use of micro nutrients for
balance fertilizer (75 gm/15
liters of water as foliar
spray)
Herbicide application
(Imazethapyr @ 500 ml/ha
at 15-20 DAS)
Need based spray of
Insecticides and fungicides
3.
4.
Full Gap (100
%)
Full Gap (100
%)
No use of
Micronutrients
Hand weeding at 25
DAS
No spray
No herbicide use
Full Gap (100
%)
Full Gap (100
%)
Table.2 Comparison of yields of cowpea (Average of 2014 & 2015)
Yield
(kg/ha)
% increased
State*
District*
Potential
1000
Demonstratio
n
1170
Farmers
practices
975
556
260
110.43
350.00
17.00
--
19.98
*Anonymous (2015-16)
2774
Int.J.Curr.Microbiol.App.Sci (2020) 9(5): 2771-2777
Table.3 Grain yield and gap analysis and technology index of Front Line Demonstration on cowpea at farmer’s field
Year of
demonstration
No. of Demo
Variety
Potential
Yield
(kg/ha)
Demo yield
(Kg/ha)
Farmers
practices
yield (kg/ha)
Increased
over Farmers
practices (%)
Extension
gap
(kg/ha)
Technology
gap
(kg/ha)
Technology
index
(%)
Kharif, 2014
Kharif, 2015
Average
25
25
--
RC 19
RC 19
--
1000
1000
1000
1184
1155
1170
999
951
975
18.51
21.45
19.98
185
204
195
-184
-155
-170
15.63
17.66
16.64
Table.4 Economics analysis of Front Line Demonstration on cowpea at farmer’s field
Year of
demonstration
Kharif, 2014
Kharif, 2015
Average
Cost of Cultivation (Rs/ha)
Demo
Farmers
practices
10200
9900
12200
11900
11200
10900
Additional cost
in demo
(Rs/ha)
300
300
300
Sale Price
of grain
(Rs/qt.)
2500
4000
3250
2775
Total return (Rs/ha)
Demo
Farmers
practices
29600
24975
46200
38040
37900
31508
Additional
return in demo
(Rs/ha)
4625
8160
6393
Effective
gain
(Rs/ha)
4325
7860
6093
Incremental
B:C ratio
(IBCR)
15.42
27.20
21.31
Int.J.Curr.Microbiol.App.Sci (2020) 9(5): 2771-2777
On the basis of two years of Front Line
Demonstration it can be concluded that by
adopting recommended package of practices
under demonstration can increased 19.98 per
cent yield of cowpea over farmer’s practices.
The increase was recorded with little extra
spending of Rs 300 per hectare. This amount
is not big enough that even a small and
marginal farmer can afford this. The adoption
of improved technology not affected by the
additional cost but the ignorance and
unawareness is the primary reason and it is
quite appropriate to call such yield gap as
extension gap. Moreover, extension gap can
be also be minimized by adopting such
technology under FLD. The IBCR (21.31) is
much high to motivate the farmers for
adoption of technology. Therefore, Front Line
Demonstration of cowpea was found effective
for farmers in changing mind sate, attitude,
skill and knowledge of improved practices of
cowpea cultivation including adaption.
Farmers and scientist relationship also
improved by this and built confidence
between them. Demonstrated farmers is a
good primary source of knowledge or
information on improved practices of cowpea
cultivation and also source of good quality
seed in locality and surrounding area for next
season. Front Line Demonstration helps in
speedy and wider dissemination of the
improved proven technology to the farming
community.
References
Ali, S. and Singh, B. (2020). Impact of front
line demonstration on productivity and
profitability of rainfed cluster bean in
Churu district of Rajasthan. Forage
Res., 45(4): 335-338.
Anonymous
(2015-16).
Rajasthan
Agricultural Statistics at Glance,
Commissionerate of Agriculture, Jaipur,
Rajasthan.
Anonymous
(2017-18).
Rajasthan
Agricultural Statistics at Glance,
Commissionerate of Agriculture, Jaipur,
Rajasthan.
Anonymous (2018). Agriculture Statistics at a
Glance. Directorate of Economics &
Statistics, Department of Agriculture &
Cooperation, New Delhi.
Bamboriya, S.D., Singh, G., Jat, A.S. and
2776
Int.J.Curr.Microbiol.App.Sci (2020) 9(5): 2771-2777
Singh, I. (2020). Evaluation of front line
demonstration trials on clusterbean in
Nagaur district of Rajasthan, India. Int.
J. Curr. Microbiol. App. Sci., 9(1):
1909-1913.
Dash, S. R. and Rautaray, B. K. (2017).
Growth Parameters and Yield of Green
Gram Varieties (Vigna radiata L.) in
East and South East Coastal Plain of
Odisha, India. Int. J. Curr. Microbiol.
App. Sci., 6(10): 1517-1523.
Dayanand; Verma, R. K. and Mehta, S. M.
(2014). Assessment of technology gap
and productivity gain through front line
demonstration in chickpea. Legume
Research, 37(4): 430-433.
Dwivedi1, R. K., Tiwari, B. K. and Baghel,
K. S. (2018). Role of cluster frontline
demonstration in enhancement of
blackgram production. Plant Archives,
18(1): 1088-1090.
Jain, L.K., Parewa, H.R. and Ratnoo, S.D.
(2019).
Impact
of
frontline
demonstration on productivity and
profitability analysis of cluster bean in
Barmer district of Rajasthan. Forage
Res., 44(4): 282-285.
Malik, A., Fayyaz-Ul- Hassan, A., Abdul
Wahieed, A., Qadir, G. and Asghar, R.
(2006). In reactive effects of irrigation
and Phosphorus on green gram Vigna
radiata L, Pakisthan J. Bot., 38(4):
1119- 1126.
Rachhoya, H. K., Sharma, M. and Sodh, K. R.
(2018). Evaluation of yield performance
of Mustard (Brassica juncea) through
Cluster Front Line Demonstration. Int.
J. Curr. Microbiol. App. Sci., 7 (7).
Rawat, G. S. and Rajput, R. L. (2018).
Profitability of clusterbean through
front line demonstrations. Bhartiya
Krishi Anushandhan Patrika, 33 (1):
48-50.
Singh, B. and Sharma, A.K. (2018). Impact of
front
line
demonstrations
on
productivity enhancement of cluster
bean in arid zone. Indian J. of Ext. Edu.,
54(1): 130-133.
Verma, R. K; Dayanand, Rathore, R. S.,
Mehta, S.M. and Singh, M. (2014).
Yield and gap analysis of wheat
productivity
through
frontline
demonstrations in Jhunjhunu district of
Rajasthan. Ann. Agric. Res., 35: 79-82.
How to cite this article:
Shaukat Ali, Balbir Singh, Aditi Gupta and Ajesh Kumar. 2020. Assessment of Technological
Gap and Productivity Gain in Cowpea through Front Line Demonstrations.
Int.J.Curr.Microbiol.App.Sci. 9(05): 2771-2777. doi: />
2777