Circadian disruption promotes tumor growth by anabolic host metabolism; experimental evidence in a rat model
Bạn đang xem bản rút gọn của tài liệu. Xem và tải ngay bản đầy đủ của tài liệu tại đây (1.91 MB, 13 trang )
Guerrero-Vargas et al. BMC Cancer (2017) 17:625
DOI 10.1186/s12885-017-3636-3
RESEARCH ARTICLE
Open Access
Circadian disruption promotes tumor
growth by anabolic host metabolism;
experimental evidence in a rat model
Natalí N. Guerrero-Vargas1, Raful Navarro-Espíndola1, Mara A. Guzmán-Ruíz1,4, María del Carmen Basualdo2,
Estefania Espitia-Bautista1, Ana López-Bago3, Ricardo Lascurain3, Cinthya Córdoba-Manilla1, Ruud M. Buijs2
and Carolina Escobar1*
Abstract
Background: Light at night creates a conflicting signal to the biological clock and disrupts circadian physiology. In
rodents, light at night increases the risk to develop mood disorders, overweight, disrupted energy metabolism,
immune dysfunction and cancer. We hypothesized that constant light (LL) in rats may facilitate tumor growth via
disrupted metabolism and increased inflammatory response in the host, inducing a propitious microenvironment
for tumor cells.
Methods: Male Wistar rats were exposed to LL or a regular light-dark cycle (LD) for 5 weeks. Body weight gain,
food consumption, triglycerides and glucose blood levels were evaluated; a glucose tolerance test was also
performed. Inflammation and sickness behavior were evaluated after the administration of intravenous
lipopolysaccharide. Tumors were induced by subcutaneous inoculation of glioma cells (C6). In tumor-bearing rats,
the metabolic state and immune cells infiltration to the tumor was investigated by using immunohistochemistry
and flow cytometry. The mRNA expression of genes involved metabolic, growth, angiogenes and inflammatory
pathways was measured in the tumor microenvironment by qPCR. Tumor growth was also evaluated in animals fed
with a high sugar diet.
Results: We found that LL induced overweight, high plasma triglycerides and glucose levels as well as reduced
glucose clearance. In response to an LPS challenge, LL rats responded with higher pro-inflammatory cytokines and
exacerbated sickness behavior. Tumor cell inoculation resulted in increased tumor volume in LL as compared with
LD rats, associated with high blood glucose levels and decreased triglycerides levels in the host. More macrophages
were recruited in the LL tumor and the microenvironment was characterized by upregulation of genes involved in
lipogenesis (Acaca, Fasn, and Pparγ), glucose uptake (Glut-1), and tumor growth (Vegfα, Myc, Ir) suggesting that LL
tumors rely on these processes in order to support their enhanced growth. Genes related with the inflammatory
state in the tumor microenvironment were not different between LL and LD conditions. In rats fed a high caloric
diet tumor growth was similar to LL conditions.
Conclusions: Data indicates that circadian disruption by LL provides a favorable condition for tumor growth by
promoting an anabolic metabolism in the host.
Keywords: Light at night, Circadian disruption, Tumor development, Inflammation, Metabolism and obesity
* Correspondence:
1
Departamento de Anatomía, Facultad de Medicina, UNAM, Universidad
Nacional Autónoma de México, Ciudad Universitaria, 04510 México City,
Mexico
Full list of author information is available at the end of the article
© The Author(s). 2017 Open Access This article is distributed under the terms of the Creative Commons Attribution 4.0
International License ( which permits unrestricted use, distribution, and
reproduction in any medium, provided you give appropriate credit to the original author(s) and the source, provide a link to
the Creative Commons license, and indicate if changes were made. The Creative Commons Public Domain Dedication waiver
( applies to the data made available in this article, unless otherwise stated.
Guerrero-Vargas et al. BMC Cancer (2017) 17:625
Background
The alternation of day-night cycles is necessary for entrainment of the master circadian clock to efficiently
transmit temporal signals to the organism in order to
adapt behavioral and physiological responses to the cycling conditions of the environment [1]. Modern lifestyle,
night-work and leisure schedules change the sleep-wake
timing and due to the extended and sometimes inverted
activity, individuals are exposed to light at night creating
a conflicting signal to the circadian clock and disrupting
circadian regulation of physiology.
Circadian disruption increases the risk to develop disease in humans [2] and rodents [3], it also promotes an
obesogenic condition, altered metabolism [4–6], immune dysfunction [7, 8] and increased the vulnerability
to develop cancer [9, 10]. In rodents, light at night increases the growth rate of mammary adenocarcinomas
[11], chemical induced hepatocarcinogenesis [12], and
accelerates aging and tumorigenesis in young rats [13].
These studies have related the increased tumor growth
to the decreased nocturnal production of melatonin and
its reduced blood concentration due to light at night.
However, in addition to melatonin suppression, other
deleterious changes triggered by constant illumination
conditions (LL), may favor the process of tumor
development.
Inflammatory environments and altered immune function are recognized as carcinogenic promoters [14–16].
Tumor-secreted inflammatory mediators such as Interleukin 6 (IL-6) and Tumor necrosis factor α (TNF-α), can
regulate host metabolism in multiple tissues [17, 18], suggesting a possible role of an inflammatory state in mediating tumor-induced metabolic changes in the host. We
have previously demonstrated that circadian disruption induces a increased inflammatory response [8] and promotes metabolic disturbances, including, dyslipidemia,
insulin insensitivity and increased adipose mass [5], all of
them leading to an obesogenic environment, which is an
additional factor that could provide a favorable internal
environment for tumor growth [19].
Here we hypothesized that circadian disruption induced by LL will favor tumor development via altering
the inflammatory response and metabolism in the host,
resulting in a propitious condition for the proliferative
activities required for tumor growth.
Methods
Experimental design
The aim of this study was to investigate in rats exposed
to LL and their controls the metabolic and the inflammatory state in the host, and the resulting conditions of
the tumor microenvironment that may favor tumor’s
growth. For this purpose, after 12 days of baseline, rats
were randomly assigned to one of 2 groups: 1. Control
Page 2 of 13
LD, rats were left undisturbed in their home cages during 5 weeks and remained in 12:12 h LD; 2. Constant
light (LL), rats were maintained with the lights on (200–
250 lx at the level of the cage) for 5 weeks. Body weight
and food intake were determined at the baseline and
every week along the protocol. All animals included in
the LL group were completely arrhythmic both in locomotor activity and body temperature after 5 weeks of LL
exposure.
Experiment 1. Behavioral and metabolic consequences of
5 weeks in LL
A first series of LD (n = 8) and LL (n = 8) rats were used
to confirm arrythmicity of general activity and core body
temperature (Tb) after 5 weeks in LL conditions. Intraabdominal temperature sensors (iButtons) were implanted
before starting experiments and programmed to measured
Tb during the last two days on week 5 of the protocol. A
glucose tolerance test (GTT) was performed at the end of
the 4th week; glucose and triglycerides (TG) in plasma
were assessed at the end of the 5th week.
Experiment 2. Evaluation of the inflammatory response to
LPS after 5 weeks in LL
A series of LD (n = 8) and LL (n = 8) rats were cannulated in the external jugular vein and were implanted
with intra-abdominal temperature sensors (iButtons).
After 1-week recovery (5 weeks in the lighting condition), rats received intravenous LPS (2 μg/kg) in the
morning at ZT2 based on previous studies [8, 20] and in
order to have the influence of light in both groups.
Blood samples were collected from the jugular cannula
and TNF-α was determined. In order to measure sickness behavior, food and fluid ingestion, body weight and
temperature response were monitored before, following,
24 h and 48 h post the LPS administration. After this experiment, rats were euthanized and temperature sensors
were collected for temperature analysis.
Experiment 3. Evaluation of tumor development, tumor
microenvironment and the influence of the tumor on the
host metabolism
In another series of LD (n = 8) and LL (n = 8) rats, at
the end of the 5th week, rats were subcutaneously inoculated with C6 tumor cells and 13 days later, rats were
euthanized and tumors as well as blood were collected
for further metabolic analysis of the host and tumor. Another series of LD (n = 8) and LL (n = 8) rats were subcutaneously inoculated with tumor cells and after 9 days
a GTT was performed. All animals remained in their
lighting schedules i.e., LD or LL until the end of the
experiments.
Guerrero-Vargas et al. BMC Cancer (2017) 17:625
Page 3 of 13
Animals and general housing conditions
Glucose tolerance test
Adult male Wistar rats weighing 190 to 200 g at the beginning of the experiments were obtained from the animal
facility of the Faculty of Medicine of the Universidad
Nacional Autónoma de México (UNAM). Animals were
housed in individual cages placed in isolated lockers with
controlled lighting conditions located in a soundproof
monitoring room maintained at a controlled temperature
of 22 ± 1 °C and with continuous air flow. All rats were
given free access to food (Rodent Laboratory Chow 5001,
Purina, Minnetanka, MN, USA) and water. For a baseline
all rats were under a 12:12 h light-dark cycle (LD), lightson at 7:00, defined as Zeitgeber time 0 (ZT0) and lights
off at 19:00 h (ZT12).
During week 4, the GTT was performed after 16 h of
overnight fasting. A basal blood sample was obtained at
ZT0 (7:00 h), and an intraperitoneal injection of 1 g of
glucose/kg in saline solution was immediately given.
After glucose administration, subsequent blood samples
were collected from tail puncture (15, 30, 60 and
120 min respectively). Glucose level was determined
with a blood glucose monitor (Glucose meter, AccuChek active. Roche).
Automatic monitoring of general activity
General activity was automatically monitored daily with tilt
sensors placed under the individual cages. Behavioral events
were collected with a digital system (Omnialva SA de CV,
México) and automatically stored every minute in a PC for
further analysis. Analysis was performed with the program
for PC SPAD9 designed for this system and based on
Matlab. Double plotted actograms were constructed for
each animal representing the number of activity counts
every 15 min and periodicity with a χ2 periodogram for the
last 14 days of the experimental protocol.
Intra-jugular cannula insertion and intra-abdominal
temperature sensors implantation
All surgeries were performed as previously described [20]
using aseptic procedures.
For temperature recordings, the iButtons were programmed to collect core temperature data every 60 min
and implanted in the rat peritoneum. For experiment 1,
recordings started on week 5; for experiment 2, data
were collected starting 2 days before LPS administration
and continued until sacrifice. Temperature recordings
were collected according to geographical time and the
subjetive day-night phases for LL rats were selected
based on the 12 h day and 12 h night of LD animals.
Blood sample collection TNF-α and metabolic
determinations
Blood samples (250ul) drawn from the intrajugular catheter were collected in Microvette®/500 tubes (Sarsted,
Nümbrecht Germany) before LPS (0 min) and postinfusion times 40, 80, 120 and 180 min. Samples were centrifuged and plasma TNF-α levels were determined by
ELISA according to the manufacturer’s recommendations
(Invitrogen #KRC3011). Glucose and TG plasma levels
were determined with enzymatic methods (ELITech Clinical Systems, France). Blood samples were taken from tail
puncture between ZT2-ZT3 under ad libitum conditions.
Inflammatory response
Inflammation was induced by a single intravenous (iv) injection of LPS (2μg/kg lipopolysaccharide from Escherichia coli serotype 0127:B8, Sigma-Aldrich, St. Louis, MO).
Tumor xenografts
The glioma C6 cell line has shown to be a convenient
model to assess factors influencing tumor proliferation.
This C6 cell line has a similar growth rate in the brain
and in the subcutaneous region, it is already visible on
day 5 and it starts decreasing on day 15, providing a
10 day window for observations and manipulations.
Moreover the histological characteristics are similar for
C6 cells implanted in the brain and subcutaneously,
showing high nuclear cell ratio, mitosis and pseudopalisading with small populations of GFAP positive cells
[21]. Therefore subcutaneous implantation has the advantage that it can be measured with a caliper, and can
be easily monitored externally without killing rats on different days. For this study the glioma C6 cell line was
kindly provided by Dra. Patricia García López from the
Instituto Nacional de Cancerología México and was obtained from ATCC® CCL-107™ (Rockville, Maryland,
USA). This cell line was cloned from a rat glial tumor
induced by N-nitrosomethylurea [22]. The cell culture
was maintained as a monolayer in RPMI-1640 medium
supplemented with 5% fetal bovine serum and incubated
at 37 °C in a 5% CO2 atmosphere at high humidity. The
C6 cell line was tested negative for Mycoplasma.
Rats were subcutaneously inoculated with 5 × 10⁶ C6cells in the back right flank; tumor size was assessed
every 2 days from day 7 to day 13. The volume of C6 tumors reaches a maximum on day 15 in intact rats, after
which the tumor reabsorbs [21]. Tumor volume was determined with a caliper using the following relation:
V = π/6 × (large diameter × [short diameter] 2).
Tumor macrophages immunohistochemistry and cell
count
Tumors were fixed in 4% paraformaldehyde (ph 7.2) for
24 h at 4 °C, and cryo-protected in 30% sucrose 1 mM
PB (ph 7.2) for 3 to 4 days. Tumors were frozen and cut
in 20 μm coronal sections at −20 °C. Free-floating tumor
Guerrero-Vargas et al. BMC Cancer (2017) 17:625
Page 4 of 13
sections were incubated for 24 h under constant shaking
at 4 °C with rabbit anti F4/80 antibody (1:2000; Santa
Cruz) and were processed according to the avidin-biotin
peroxidase method [20]. Immunoreactivity to F4/80 was
quantified in six representative sections using a light
microscope (Leica ICC50HD) and captured with a 40×
ocular. Immunoreactive-positive areas were counted
using computerized image analysis system (Image J,
1.42q, National Institutes of Health Bethesda, MD) using
12 squares grid over the tumor picture. Positive staining
grids (inflammatory loci) were counted by free hand.
two factors (Condition LL or LD x time). Mean day-night
temperature was compared with a two-way ANOVA.
ANOVA’s were followed by Bonferroni’s post-hoc test for
multiple comparisons. An unpaired one-tail Student T test
was used to analyze food ingestion, serum TG, AUC,
CD43 cells and genes measured in the tumor. MannWhitney test was used to analyze F4/80-IR positive grids.
All data and the Area Under the Curve (AUC) for
plasma glucose were analyzed by using GraphPad Prism
(version 6.03; Graph Pad Software, Inc.). Statistical significance was set at α = 0.05.
Tumor q-PCR
Results
Total RNA from tumors was harvested using Trizol
reagent (life technologies). RNA was reverse transcribed to generate cDNA using SuperScript III firststand synthesis super mix (Invitrogen). Specific primer
sets (Additional file 1: Table S1) and Kapa Sybr Master
Mix (Kapa biosystems) were used for qPCR. Data were
collected using a A Prism 7000 real-time PCR system (Life
Technologies), samples were run in duplicate. Relative
quantification studies were performed with the collected
data using the Prism 7000 System SDS software 1.3 (Life
Technologies) and the relative expression ratio (R) of a
target gene was calculated based on Efficiency and the CP
deviation of an unknown sample versus a control, and
expressed in comparison to the reference genes [23] hypoxanthine phosphoribosyltransferase (HPRT) and TATA
box binding protein (TbP).
Constant light induced loss of circadian rhythms in
general activity and core body temperature
Flow cytometry
Tumor dissociation was performed as previously described [24]. Cells were washed twice by PBS and
counted in a Neubauer chamber; cell viability was evaluated using Trypan Blue dye exclusion. Immunofluorescence staining was carried out by antibodies to rat
lymphocyte markers (Additional file 1: Table S2). In
brief, 2 X 10⁵ cells were suspended in PBS containing
0.2% bovine serum albumin and 0.2% sodium azide, and
incubated with fluorescent antibodies for 30 min at 8°C.
After washing, 10,000 cells were analyzed on a MACSQuant flow cytometer (Miltenyi Biotech, Germany).
First, acquired cells were gated by their physical properties (forward and side scatter); immediately, a second
gate was done based on CD45 expression and forward
scatter, from which was drawn a histogram to analyze
CD43, CD3, CD4, CD8, CD45R and CD161 expression.
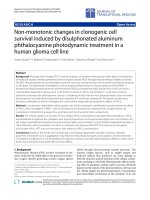
Control rats in LD exhibited a clear day-night general
activity alternation, characterized by high activity levels
during the night (Fig. 1a). In contrast, LL induced a progressively loss of general activity rhythmicity until no
clear day–night difference was observed (Fig. 1b). The
periodogram corresponding to the last 14 days of experiment confirmed circadian rhythmicity in general activity
for all rats in LD (Fig. 1c) and loss of circadian rhythmicity for all LL rats (Fig. 1d).
Circadian rhythms in core body temperature (Tb) were
also monitored during the last 2 days of the lighting
protocol. LD rats showed a clear day-night Tb rhythm
characterized by low temperature levels during the day
and high levels during the night (Fig. 1e) while LL rats
showed constant temperature values along the subjective
day-night 24 h period. Interestingly, the mean daily
temperature of LL rats was higher than the mean of the
day values of LD rats (Fig. 1d; p < 0.05).
Constant light modified metabolism in the host
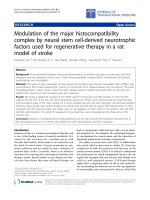
After 5 weeks, LL animals had gained more weight than
the control LD rats; this reached significant difference
from LD animals on weeks 4 and 5 of the protocol
(Fig. 2a; p < 0.01). The increased body weight gain observed in LL rats, was not due to a difference in food
consumption (Fig. 2b).
Plasma TG levels were higher in LL as compared with
LD rats (Fig. 2c; p < 0.01); similarly, glucose plasma
levels were significantly higher in LL rats as compared
with LD rats both under fasted (before GTT) and ad
libitum conditions (Fig. 2d; p < 0.01). In addition, LL
rats showed an impaired glucose clearance, as demonstrated with the GTT (Fig. 2e-d; p < 0.05).
Statistical analysis
Data are presented as mean ± standard error of the mean
(SEM). Weight gain, tumor volume, core temperature,
food and water intake, ad libitum-fasted glucose, glucose
levels for the GTT and TNF-α plasma levels were compared with a two-way ANOVA for repeated measures for
Constant light increases the inflammatory response to
LPS
Basal TNF-α plasma levels, measured at time 0 were
very low or undetectable in both LD and LL rats. LPS
administration triggered a significant increase of TNF-α
Guerrero-Vargas et al. BMC Cancer (2017) 17:625
Page 5 of 13
a
b
c
d
e
f
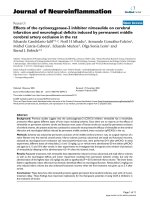
Fig. 1 Constant light for 5 weeks disrupts circadian rhythms in general activity and core body temperature (Tb). (a) Representative double-plotted
actograms from LD and (b) LL rats respectively. Black and white horizontal bars on top of the actograms represent night and day. The change in the
lighting condition after 12 days of baseline (12:12 h LD cycle) is indicated with the legend “lights on” and the large white bar representing the constant
light condition. (c) The χ2 periodogram test for the last 14 days demonstrates a 24 h rhythm for LD and (d) the absence of a circadian rhythm for LL
rats. (e) Mean temperature values from the last 2 days of the lighting schedule for LD (grey circles) and LL (white circles) rats along 24 h. (f) Mean daynight temperature values for LD (grey bars) and LL (white bars), stripped bars in each group represent the night. Data are the mean ± SEM (n = 8/
group). For E the repeated-measures two-way ANOVA, indicated significant interaction of the lighting condition versus time p < 0.0001. For F the twoway ANOVA indicated significant interaction of the lighting condition versus time p < 0.0001. The Bonferroni test indicated statistical difference LL from
LD *p < 0.05 for F and indicated & p < 0.001 between day and night in the LD group
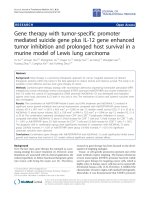
plasma levels in both groups, reaching the highest
levels after 40 and 80 min, LL rats reached significantly higher TNF-α plasma levels as compared with
LD rats (Fig. 3a; p < 0.05).
After the LPS challenge, analysis of Tb indicated that
both groups exhibited an initial increase in Tb with a
first peak 1 h after LPS administration and a second
peak 5–6 h later, the mean temperature of the day in LL
rats was significantly higher as compared to LD rats
(Fig. 3b; p < 0.05) and the Tb difference between day
and night in LD rats was dampened. 24 h post LPS injection Tb of both groups returned to pre injection
levels (Fig. 3c). Both groups reduced food consumption
on the day of LPS administration, this was more severe
in LL rats, which consumed 41.66 ± 2.76% less food as
compared to the 12.59 ± 2.41% reduction observed in
LD rats (Fig. 3d; p < 0.05); water intake was also reduced
in both groups (Fig. 3e). 24 h after LPS administration
both groups increased food and water intake; nevertheless 48 h post LPS, LL rats were still consuming significantly less food than the LD group (Fig. 3d; p < 0.05).
This initial food and water reduction impacted on
body weight for both groups on the day of LPS administration; however, there was no difference in the weight
loss between groups (19 ± 2.67 g in LD and
12.83 ± 2.46 g in LL rats). Animals had not recovered
body weight 48 h post LPS. Altogether these results indicate that LL aggravates the sickness response, especially
cytokine production and food consumption.
Inoculated tumor cells grow more in LL rats
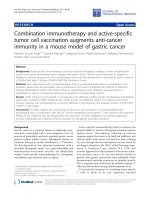
Inoculated tumor cells formed bigger tumors in LL rats,
that were significantly different from LD tumors on days
11 and 13 (Fig. 4a; p < 0.05). At the end of the
Guerrero-Vargas et al. BMC Cancer (2017) 17:625
Page 6 of 13
a
b
c
d
e
f
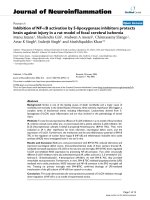
Fig. 2 Constant light (LL) disrupts metabolism. (a) LL rats (white circles) gained more body weight along the 5-week protocol as compared with
LD rats (grey circles). The repeated-measures two-way ANOVA indicated significant interaction of the lighting condition versus time, p = 0.0011.
The Bonferroni test **p < 0.01 indicated statistical difference from LD. (b) Food ingestion assessed for 24 h during week 5 indicated no differences
between groups. Data are expressed as mean ± SEM (n = 7–8/group). (c) Basal plasma TG and (d) glucose levels under ad libitum and fasted
conditions were significantly increased in LL rats. Data are the mean ± SEM (n = 12/group), **p < 0.01 indicates statistical difference from LD;
unpaired t test. (e) Glucose tolerance test (GTT, 0–120 min) and (f) area under the curve (AUC) following i.p. administration of 1 g of glucose/kg.
Data are the means ± SEM (n = 14–15/group). * p < 0.05 indicates statistical difference from LD; unpaired t test
experiment, isolated tumors from LL were also significantly heavier than LD tumors (Fig. 4b-c; p < 0.5). Together these findings suggest that LL induces a suitable
environment for tumor growth.
Tumor development changed the metabolic profile in the
host
Tumor development affected the body weight between
LL and LD groups (Fig. 2a). Before tumor inoculation
LL rats were heavier than LD rats, 4 days after inoculation differences disappeared between groups and by the
end of the experiment (13 days after) LD rats had gained
more weight as compared to LL rats (Fig. 5a; p < 0.05),
suggesting that in LL rats the increased tumor growth
resulted in a higher metabolic demand.
Tumor development also decreased food ingestion in
both groups as compared to their own basal levels
(Fig. 5b; p < 0.05) without difference between groups.
TG levels in LL tumor-bearing rats diminished 26% as
compared to their previous condition. In contrast, TG
levels in LD tumor-bearing rats increased 10% as compared to their previous condition; thus TG levels were
not different between LL and LD tumor-bearing rats
(Fig. 5c). The presence of the tumor induced an increase
of glucose levels in both groups. LL animals increased
55.01% ± 6, while LD rats increased 45.92% ± 8 from
their basal glucose levels. In addition, tumor development also increased fasting blood glucose levels in LL
rats as compared to LD (Fig. 5d; p < 0.05); nevertheless
glucose clearance was not different between LL and LD
tumor-bearing rats on day 9 after tumor cells inoculation as demonstrated with the GTT.
In order to test whether the initial metabolic condition
induced by LL may be the promoting factor for tumor
growth, a different group of rats in LD condition, was
exposed to a 1 h daily access to high sugar diet for
4 weeks (Additional file 2). The high sugar diet induced
increased body weight and similar metabolic disturbances as observed in LL rats (Additional file 3: A-D). A
sugar diet favored the growth of bigger tumors as compared to rats consuming a chow diet (Additional file 3:
E; p < 0.01), reaching similar size as tumors in the LL
rats at day 13.
Tumors from LL rats recruit more macrophages
Because the infiltration of immune cells is an important
event that correlates with tumor growth or elimination
(depending on the infiltrating immune cell type), we investigated the inflammatory condition in the tumor.
Tumor infiltration of T cells (CD3+CD4+ and CD3+CD8+),
NK cells (CD161+) and B cells (CD45R) was not different
between LD and LL (Additional file 4: A-D). However,
Guerrero-Vargas et al. BMC Cancer (2017) 17:625
Page 7 of 13
a
b
c
d
e
f
Fig. 3 LL rats produced more TNF-α and showed increased sickness behavior in response to LPS. (a) TNF-α plasma levels after the administration of
2μg/kg of LPS. The repeated-measures two-way ANOVA indicated a significant effect due to the interaction condition versus time, p = 0.0065. The
Bonferroni test **p < 0.01 indicated statistical difference from LD. (b) Thermoregulatory response to LPS. The arrow represents LPS administration at
ZT2 for both groups. The mean day-night core body temperature (Tb) is shown in the box, for LD (grey bars) and LL (white bars), stripped bars in each
group represent the night. The repeated-measures two-way ANOVA indicated a significant effect due to light condition p = 0.0107; and time
p = 0.0011. The Bonferroni test p < 0.05 indicated statistical difference from LD and # between LL. (c) Thermoregulatory response 24 h post LPS. The
mean day-night core body temperature (Tb) is shown in the box. The subjetive day-night phases for LL rats were selected based on the 12 h day and
12 h night of LD animals. The repeated-measures two-way ANOVA indicated effects due to the interaction condition versus time, p = 0.0011; the
Bonferroni test indicated *p < 0.05 statistical difference from LD and & between LD. (d) Food intake, (e) Water intake and (f) Weight gain during the
day of LPS administration, 24 and 48 h post LPS in LD and LL rats. Values are expressed as a percentage of the baseline value established prior to LPS
administration. For d, the repeated-measures two-way ANOVA indicated effects due to lighting condition p = 0.0107 and time p = 0.0011. Data are the
mean ± SEM (n = 6/group). *p < 0.05 indicates statistical difference from LD; with Bonferroni test
tumors of LL rats tend to recruited more monocytes
(CD43+, Fig. 6a). Because monocytes are the precursors of
macrophages, we evaluated the presence of macrophages
inside the tumors, using the F4/80 marker. The inmmunohistochemical staining indicated that tumors from LL
rats recruited more macrophages as compared to LD rats
(Fig. 6b-c; p < 0.05). The increased number of tumor macrophages in LL did not result in increased levels of
a
b
circulating TNF-α. Undetectable TNF-α plasma levels
were measured on both LD and LL rats (Data not shown).
The LL tumor microenvironment is characterized by an
altered metabolic profile
In order to identify the factors in the tumor microenvironment that may favor its growth, a set of genes related
with metabolism, cytokines, growth and angiogenesis
c
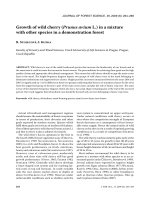
Fig. 4 Constant light enhances tumor growth. (a) Tumor volume along 13 days after subcutaneous C6 cells inoculation. The repeated-measures two-way
ANOVA indicated a significant interaction of condition versus time, p = 0.0240. The Bonferroni test indicated *p < 0.05, *p < 0.01 statistical difference from
LD. (b) Tumor weight at day 13. *p < 0.05 indicates statistical difference from LD; unpaired t test. (c) Representative pictures from LD and LL tumors. Data
are the mean ± SEM (n = 7/group)
Guerrero-Vargas et al. BMC Cancer (2017) 17:625
Page 8 of 13
a
b
c
d
e
f
Fig. 5 Tumor development modifies the metabolic profile of the host. (a) Accumulative gain weight along the 13 days after tumor cells
inoculation (b) Food ingestion before, on day 7 and day 13 after tumor cells inoculation. Data are the mean ± SEM (n = 7/group). For A and B,
the repeated-measures two-way ANOVA indicated a significant effect of time, p < 0.0001. Bonferroni test indicated *p < 0.01 statistical difference
from LD, & between LD and # between LL. (c) TG and (d) glucose levels under ad libitum and fasted conditions in LD and LL tumor-bearing rats
(13 days) D. Unpaired t test **p > 0.001 indicated statistical difference from LD. Data are the mean ± SEM (n = 7/group). (e) Glucose tolerance test
(0–120 min) and (F) AUC following i.p. administration of 1 g glucose/kg. Data are the mean ± SEM (n = 8/group)
a
b
c
Fig. 6 Tumors from LL rats recruit more macrophages. (a) Gating strategy employed to identify CD43+ cells in LD and LL tumors and percentage of
CD43+ cells (n = 3–4/group). Analysis was done on whole lysates from tumors removed from LD and LL rats on day 13. (b) Immunohistochemistry
staining of LD and LL tumors against an anti-macrophage antibody F4/80. Arrows indicate inflammatory loci. (c) Quantification of inflammatory loci in
the grid area. Data are the mean ± SEM (n = 5–6/group) *p = 0.0173 indicates statistical difference from LD; Mann-Whitney test
Guerrero-Vargas et al. BMC Cancer (2017) 17:625
Page 9 of 13
pathways were evaluated in tumors obtained from LD
and LL 13 days after inoculation.
Genes involved in lipogenesis Acetyl-CoA carboxylase
alpha (Acaca), Fatty acid synthase.
(Fasn) and Peroxisome proliferator activated receptor
gamma (Pparγ) were highly expressed in the tumors of
LL rats as compared to LD tumors (Fig. 7a; p < 0.5), suggesting an up regulation of lipid production in tumors of
LL animals in order to support their growth. Contrasting, Sterol regulatory element binding transcription factor
1 (Srebp-1) a transcriptional activator of the genes involved in lipogenesis was decreased in the tumors of LL
rats (p < 0.05). The expression of genes related to lipid
oxidation Carnitine palmitoyltransferase IA (Cpt1a), AcylCoA dehydrogenase (Acads), Hydroxyacyl-CoA dehydrogenase (Hadha) and Peroxisome proliferator-activated receptor alpha (Ppar ) was not different between LD and
LL tumors (Fig. 7b).
From the genes involved in glycolysis, the expression
of the Glucose transporter 1 (Glut1) was increased in
LL as compared to LD tumors (Fig. 7c; p < 0.05) suggesting a higher glucose uptake. The expression profile
of other glycolytic genes Hexokinase II (HkII), Pyruvate
kinase muscle isozyme M2 (Pkm2) and Lactate dehydrogenase (Ldh) was not different between the two
groups (Fig. 7c). In line with the increased lipogenesis
and glucose transport, tumors from LL rats expressed
high levels of the oncogene Myc, the Insulin transporter
(Ir) and the pro-angiogenic gene Vegf-α(Fig. 7d and e;
p < 0.05). In contrast, no differences between tumors in
the two groups were found in the expression of the
Hypoxia-inducible factor 1-alpha (Hif1-α) and the measured cytokines Transforming growth factor beta
(Tfgα), Interleukin 10 (Il10), Interleukin 6 (IL6), Interleukin 1 beta (Il1α) and Tnfα (Fig. 7f ).
Discussion
Light at night is a modern life style problem, especially
for individuals living in big cities; it affects night workers
as well as young people and children that are exposed to
artificial light for extended hours of the night. The effects of light at night on human and rodent health have
been the focus of several studies reporting a loss of body
homeostasis, body weight gain, depression and increased
tumor development [11, 25, 26]; however, the mechanisms involved in this process are not well established.
This study demonstrates that light at night disrupts the
host’s metabolism as well as the inflammatory response
creating an obesogenic environment, favorable for tumor
growth. Tumors induced in LL rats showed an increased
number of macrophages, expressed high mRNA levels of
key enzymes involved in lipogenesis as well as in the uptake of glucose; this was associated with increased mRNA
levels of markers of tumor development.
LL disrupts metabolism
The control of cellular metabolism is essential for cell survival, and the role of aberrant cellular metabolism in cancer
a
b
c
d
e
f
Fig. 7 In tumors from rats exposed to LL the expression of genes involved in lipogenesis, glucose uptake, angiogenesis and cell proliferation was
increased. (a) Relative expression of genes (Acaca, Fasn, Srebp-1 and Pparγ) involved in lipogenesis; (b) Relative expression of genes involved in
lipid oxidation (Cpt1, Acads, Hadha and Pparα); (c) glycolysis (Glut-1, HkII, Pkm2, Ldh); (d) Tumor growth (Myc, P53, Ir); (e) angiogenesis (Vegfα, Hif1α) and (F) cytokines (Tfgα, Il10, IL6, Il1α and Tnfα). All genes were measured using qRT-PCR analysis. Gene expression in tumors was normalized to
the expression of Hprt and Tbp as endogenous controls. Data are plotted as the mean ± SEM. (n = 7–10/group). *p < 0.05, *p < 0.01 indicates
statistical difference from LD; unpaired t test
Guerrero-Vargas et al. BMC Cancer (2017) 17:625
is becoming evident. In humans, over weight and an anabolic metabolism are associated with cancer development
[19, 27]. Several systemic and metabolic alterations that accompany obesity, such as insulin resistance, hyperglycemia,
fat accumulation, low-grade systemic inflammation and immune deregulation, also correlate with cancer development
[28]. Present data are in agreement with this approach,
since the increased tumor growth was associated with increased body weight gain, induced dyslipidemia, high glucose levels and altered glucose clearance in LL animals.
Similar metabolic changes and tumor growth were observed after a high sugar diet, confirming that increase
tumor development profits from the host’s metabolism
shifted to an obesogenic condition. Indeed, high glucose
levels are associated with poor survival in patients with
glioblastoma [29, 30], the same kind of tumors induced in
the present study after the inoculation of C6 cells in the rat
[31]. Importantly, fasting regimens, which are associated
with decreased levels of glucose and insulin, delayed the
progression of cancer, have cancer preventive effects and
increase the efficacy of chemotherapy agents [32–34].
It is well described that tumor cells “reprogram” the
host’s metabolism in order to survive and proliferate under
conditions that otherwise would arrest or kill normal cells
[35]. We report that after 13 days of tumor induction, in
both groups plasma glucose levels were increased while TG
levels decreased in LL animals, correlating with increased
tumor growth and suggesting TG uptake.
Page 10 of 13
the high expression of Glut-1 coupled to glucose metabolism [40]. This is supported by observations in which
glucose was withdrawn from culture medium inducing
apoptosis in glioblastoma cell lines [41].
In this study the glucose tolerance test suggests insulin resistance induced by LL, which is in agreement
with others findings [4], the increased Ir mRNA levels
observed in LL tumors coupled with the increased insulin levels in LL observed by others, offer another possible pathway (46) by which tumor growth can be
stimulated under the metabolic conditions of LL. This
possible mechanism is further supported by the increased mRNA levels of the transcription factor Myc in
LL tumors. Interestingly, besides regulating the transcription of genes involved in cell growth, cell proliferation, cell cycle, protein biosynthesis and apoptosis
(under nutrient or growth factor deprivation conditions) [42], other genes targeted by the transcription
factor Myc include key genes involved in glucose metabolism such as Glut-1 [43], lipid metabolism and
angiogenesis [44]. The increased expression of Glut-1
probably promoting increased glucose influx to the LL
tumor cells, together with the up-regulation of Myc,
may favor glucose metabolism and the supply of acetylcoA used as a substrate for lipid biosynthesis and for
other nuclear processes.
High lipid synthesis in LL tumors
Increased expression of glucose transporter 1 in LL
tumors
Tumor cells take up nutrients such as glucose, lipids and
aminoacids to fuel their metabolic pathways [36]. Glucose metabolism in cancer cells is known to be elevated
due to altered membrane transport, that leads to increased intracellular glucose levels. Glucose is used by
tumors to generate energy mainly through aerobic glycolysis (increased conversion of glucose to lactic acid to
produce ATP) [37]. The main product lactate, is associated with increased tumor angiogenesis, heightened metastasis, and can also induce a pro-inflammatory state in
the tumor microenvironment [38]. In line with this, tumors isolated from LL rats exhibited increased mRNA
levels of the glucose transporter 1 (Glut-1), which promotes glucose import into the cytoplasm. Besides a primary substrate for ATP generation, glucose is a carbon
source for the biosynthesis of other macromolecules;
hence a critical nutrient for fast proliferating cells [39].
Contrasting, we did not find significant differences in
the expression of key enzymes involved in the aerobic
glycolytic pathway such as HKII, Pkm2 and Ldh. Thus
differences in enzymatic activity may be present since
previous findings relate the growth of C6 tumor cells to
Alterations in lipid metabolic pathways are another wellrecognized metabolic adaptation that enables tumors to
take up exogenous lipids or up-regulate endogenous synthesis (50,51). Decreased circulating TG levels in LL
tumor bearing rats, suggest tumor lipid uptake, which is
supported by the observed up-regulation of Vegf-α
known target of Ppar-γ which was also up-regulated in
LL tumors and it is known to be activated by fatty acids
in the tumor microenvironment [45]. Moreover, present
data suggest that LL tumors have increased lipid synthesis because they expressed high mRNA levels of all the
key enzymes involved in lipid synthesis such as Acaca
that generates malonyl-CoA from actetyl-Coa, Fasn,
which catalyzes fatty acid chain elongation and Pparγ, a
transcription factor that regulates the expression of
genes involved in lipid metabolism as well as tumorogenesis [46]. Strikingly, LL tumors expressed decreased
mRNA levels of Srepb-1 (a transcription factor that regulates the activation of genes involved in fatty acid synthesis),
which suggest the role of other regulatory mechanisms for
the increased expression of lipogenic genes in LL tumors.
The increased fatty acids synthesis observed in LL tumors
may favor energy production, cell signaling and tumor
growth by inducing membrane synthesis, angiogenesis, migration and immunosuppression [46].
Guerrero-Vargas et al. BMC Cancer (2017) 17:625
Constant light disrupts the inflammatory response to LPS
Undetectable TNF-α plasma levels were measured in LL
rats before the LPS challenge, indicating that LL increases the sensitivity to an immune challenge without
changing the inflammatory state of the host at least in
the circulation, as observed in other circadian
desynchronization protocols such as experimental shiftwork and jet lag in rodents [8, 47]. However, LL aggravated
certain components of the sickness response such as cytokine production, and food consumption after LPS administration, which is in agreement with other studies [7].
Constant light also decreases the amplitude of the diurnal
rhythmicity of leukocyte counts as well as the number and
cytotoxicity of splenic NK cells in rats [48, 49]. Moreover,
rats exposed to LL produce fewer antibodies in response to
a T-cell dependent antigen [50]. Altogether these results
also indicate that LL affects the function of the immune
system in a way that may favor the development of disease
and tumor growth.
Page 11 of 13
propitious internal tumor environment. We have demonstrated that tumors from LL rats up-regulate key enzymes involved in glucose uptake and lipogenesis, which
correlates with increased expression of tumor growth
markers. Of clinical relevance is the fact that circadian
disruption by LL exposure induces several metabolic features that are also observed in Type II diabetes mellitus
patients or with metabolic syndrome; conditions that
also are associated with increased cancer incidence.
Light at night suppresses melatonin in both, diurnal
(humans) and nocturnal subjects [56–58] and has shown
to exert adverse effects in diurnal species in a similar
way as in nocturnal rodents [59, 60]. In this regard light
at night is an environmental risk factor that appears to
favor conditions for tumor growth, similar to obesity
and diabetes. Present data highlight the importance of
developing strategies to prevent circadian disruption and
raise the need to continue exploring the link between
circadian regulation and health problems including
cancer.
The inflammatory microenvironment of LL tumors
The exacerbated inflammatory response observed in LL
animals suggested a deregulated inflammatory response
affecting the tumor microenvironment. Our analysis
confirmed that LL tumors recruited more macrophages
as compared to LD tumors favoring tumor growth. Macrophages are the major immune cell population recruited in gliomas [51] and support tumor progression,
angiogenesis, metastasis and immunosuppression [52].
In this sense, increased number of TAMs observed in LL
tumors may have contributed to the observed tumor
growth via the production of soluble factors such as
VEGF a well-recognized angiogenic promoter. Here we
show that the highly macrophage infiltrating LL tumors
expressed increased pro-angiogenic factor Vegf-a mRNA
levels, which regulates blood vessel formation but also
exert mitogenic actions that may contribute to the enhance tumor growth observed in LL rats. Importantly,
targeted deletion of TAMs in glioma xenografts promotes tumor regression [53].
Angiogenesis is an essential mechanism for tumor
growth and maintenance, which may occur in response
to environmental cues such as hypoxia stabilizing the
transcription factor Hif-1α, that in turn activates the expression of angiogenic genes like Vegf-a. Levels of the
Hif-1α mRNA were not different between LL and LD tumors, which can be explained by its relatively short-lived
mRNA [54], or the oscillating O2 tumor levels (over the
course of hours and days), which induce periodic fluctuations of tumor Hif-1α expression [55].
Conclusions
The obesogenic metabolism observed in LL hosts associated to an altered immune response may have favored a
Limitations of our study
The tumor cell line used in this study does not enable us
to follow tumor development at latter survival times because for this type of cells the host immune system induces tumor involution. However, this cell line allowed
us to study tumor development in rats with an intact
immune system and the interaction with the host’s
homeostatic conditions. Although we induced the tumor
by inoculating tumor cells, present data suggest that the
metabolic condition observed in LL rats per se may promote spontaneous tumor formation at later stages as has
been recently demonstrated in a model of circadian
desynchronization by chronic jet lag exposure [61].
More studies are necessary to corroborate this.
Additional files
Additional file 1: Table S1. and Table S2. (PDF 102 kb)
Additional file 2: Supplementary methods. (PDF 67 kb)
Additional file 3: High sugar diet (HS) induces a suitable metabolic
environment for tumor growth. (A) HS rats (white circles) gained more body
weight along the 4-week protocol as compared with chow diet rats (grey
circles). Data are the mean ± SEM (n = 7/group). The repeated-measures
two-way ANOVA indicated significant effects for condition versus time,
interaction p = 0.0014. The Bonferroni test ***p < 0.001 indicated statistical
difference from chow diet. (B) HS rats ingest more Kcal in 24 h. Data are the
mean ± SEM (n = 7/group). ** p < 0.01 indicates statistical difference from
chow diet; unpaired t test. (C) Basal plasma triglycerides (TG) and glucose
levels (D) under ad libitum conditions were significantly increased in HS rats.
Data are the mean ± SEM (n = 6–7/group), **p < 0.01, ***p < 0.001 indicates
statistical difference from chow diet; unpaired t test. (E) Glucose tolerance
test (GTT, 0–120 min) following i.p. administration of 1 g of glucose/kg.
Values are expressed as mean ± SEM (n = 7/group). The repeated-measures
two-way ANOVA indicated significant effects for condition versus time
interaction p = 0.016. The Bonferroni test **p < 0.01 indicated statistical
difference from chow diet. (F) Tumor volume along 13 days after
Guerrero-Vargas et al. BMC Cancer (2017) 17:625
subcutaneous C6 cells inoculation. The repeated-measures two-way ANOVA
indicated a significant interaction for condition versus time, p = 0.0032. Data
are expressed as mean ± SEM (n = 4-7group). The Bonferroni test indicated
**p < 0.01 statistical difference from chow diet. (PDF 328 kb)
Additional file 4: Tumors from LL and LD rats similar percentages of
immune cells. (A) Percentage of CD8+, (B) CD4+, (C) CD45R+ and (D)
CD161+ cells. Data are expressed as the mean ± SEM (n = 3–4/group).
Analysis was done on whole lysates from tumors removed from LD and
LL rats on day 13. (PDF 23 kb)
Abbreviations
Acaca: Acetyl-CoA carboxylase alpha; Acads: Acyl-CoA dehydrogenase;
Cpt1a: Carnitine palmitoyltransferase IA; Fasn: Fatty acid synthase;
Glut1: Glucose transporter 1; GTT: Glucose tolerance test; Hadha: HydroxyacylCoA dehydrogenase; Hif1-α: Hypoxia-inducible factor 1-alpha;
HkII: Hexokinase II; Il10: Interleukin 10; Il1α: Interleukin 1 beta; Il6: Interleukin 6;
Ir: Insulin transporter; iv: Intravenous; LD: Light-dark cycle; Ldh: Lactate
dehydrogenase; LL: Constant illumination conditions;
LPS: Lipopolysaccharide; Pkm2: Pyruvate kinase muscle isozyme M2;
Pparα: Peroxisome proliferator-activated receptor alpha; Pparγ: Peroxisome
proliferator activated receptor gamma; Srebp-1: Sterol regulatory element
binding transcription factor 1; Tb: Core body temperature; Tfgα: Transforming
growth factor beta; TG: Triglycerides; TNF-α: Tumor necrosis factor α;
Vegfα: Vascular endothelial growth factor alpha; ZT: Zeitgeber time
Acknowledgements
None.
Funding
This work was supported by postdoctoral fellowship DGAPA-UNAM to N.N.
Guerrero-Vargas and grants PAPIIT-UNAM IG200314 and IG200417 to C. Escobar and R.M. Buijs. CONACyT 239403 to C. Escobar and CONACyT 220598 to
R.M. Buijs. These funding sources provided support for the conduct of research; they played no role in study design, collection, analysis and interpretation of data, preparation of manuscript, or decision to submit the article for
publication.
Availability of data and materials
All data generated or analysed during this study are included in this
published article and its supplementary information files.
Authors’ contributions
N.N.G-V. and C.E. designed and conceived the research; N.N.G-V., R.N-E,
M.A.G-R, M.C.B, E.E-B, A.L-B, and C.C-M conducted experiments. N.N.G-V.,
M.A.G-R., M.C.B., A.L-B., C.E., R.L. and R.M.B analyzed data. N.N.G-V. and C.E.,
wrote the paper. N.N.G-V., R.N-E, M.A.G-R, M.C.B, E.E-B, A.L-B, R.L. R.M.B and
C.E. reviewed and edited the manuscript. C.E. is the guarantor of this work
and, as such, had full access to all data in the study. All authors read and
approved the final manuscript.
Ethics approval
Experimental procedures used in this study were approved by the committee
for ethical evaluation at the Faculty of Medicine, UNAM (019/2015), in strict
accordance with international guidelines for animal handling. All efforts were
made to minimize the number of animals and their suffering.
Consent for publication
Not applicable.
Competing interests
The authors declare that they have no competing interests.
Publisher’s Note
Springer Nature remains neutral with regard to jurisdictional claims in
published maps and institutional affiliations.
Author details
1
Departamento de Anatomía, Facultad de Medicina, UNAM, Universidad
Nacional Autónoma de México, Ciudad Universitaria, 04510 México City,
Page 12 of 13
Mexico. 2Departamento de Biología Celular y Fisiología, Instituto de
Investigaciones Biomédicas, Universidad Nacional Autónoma de México,
04510 Mexico City, CP, Mexico. 3Departamento de Bioquímica, Facultad de
Medicina, Universidad Nacional Autónoma de México, 04510 Mexico City, CP,
Mexico. 4Departamento de Medicina experimental, Facultad de Medicina,
Universidad Nacional Autónoma de México, 04510 Mexico City, Mexico.
Received: 2 April 2017 Accepted: 28 August 2017
References
1. Bell-Pedersen D, Cassone VM, Earnest DJ, Golden SS, Hardin PE, Thomas TL,
Zoran MJ. Circadian rhythms from multiple oscillators: lessons from diverse
organisms. Nat Rev Genet. 2005;6(7):544–56.
2. Cho Y, Ryu SH, Lee BR, Kim KH, Lee E, Choi J. Effects of artificial light at
night on human health: a literature review of observational and
experimental studies applied to exposure assessment. Chronobiol Int. 2015;
32(9):1294–310.
3. Evans JA, Davidson AJ. Health consequences of circadian disruption in
humans and animal models. Prog Mol Biol Transl Sci. 2013;119:283–323.
4. Coomans CP, van den Berg SA, Houben T, van Klinken JB, van den Berg R,
Pronk AC, Havekes LM, Romijn JA, van Dijk KW, Biermasz NR, et al.
Detrimental effects of constant light exposure and high-fat diet on
circadian energy metabolism and insulin sensitivity. FASEB J. 2013;27(4):
1721–32.
5. Salgado-Delgado RC, Saderi N, Basualdo Mdel C, Guerrero-Vargas NN,
Escobar C, Buijs RM. Shift work or food intake during the rest phase
promotes metabolic disruption and desynchrony of liver genes in male rats.
PLoS One. 2013;8(4):e60052.
6. Kooijman S, van den Berg R, Ramkisoensing A, Boon MR, Kuipers EN, Loef
M, Zonneveld TC, Lucassen EA, Sips HC, Chatzispyrou IA, et al. Prolonged
daily light exposure increases body fat mass through attenuation of brown
adipose tissue activity. Proc Natl Acad Sci U S A. 2015;112(21):6748–53.
7. Lucassen EA, Coomans CP, van Putten M, de Kreij SR, van Genugten JH,
Sutorius RP, de Rooij KE, van der Velde M, Verhoeve SL, Smit JW, et al.
Environmental 24-hr cycles are essential for health. Curr Biol. 2016;26(14):
1843–53.
8. Guerrero-Vargas NN, Guzman-Ruiz M, Fuentes R, Garcia J, Salgado-Delgado
R, Basualdo Mdel C, Escobar C, Markus RP, Buijs RM. Shift work in rats results
in increased inflammatory response after lipopolysaccharide administration:
a role for food consumption. J Biol Rhythm. 2015;30(4):318–30.
9. Anisimov VN. Light pollution, reproductive function and cancer risk. Neuro
Endocrinol Lett. 2006;27(1–2):35–52.
10. Portnov BA, Stevens RG, Samociuk H, Wakefield D, Gregorio DI. Light at
night and breast cancer incidence in Connecticut: an ecological study of
age group effects. Sci Total Environ. 2016;572:1020–4.
11. Cos S, Mediavilla D, Martinez-Campa C, Gonzalez A, Alonso-Gonzalez C,
Sanchez-Barcelo EJ. Exposure to light-at-night increases the growth of
DMBA-induced mammary adenocarcinomas in rats. Cancer Lett. 2006;235(2):
266–71.
12. van den Heiligenberg S, Depres-Brummer P, Barbason H, Claustrat B, Reynes
M, Levi F. The tumor promoting effect of constant light exposure on
diethylnitrosamine-induced hepatocarcinogenesis in rats. Life Sci. 1999;
64(26):2523–34.
13. Vinogradova IA, Anisimov VN, Bukalev AV, Ilyukha VA, Khizhkin EA, Lotosh
TA, Semenchenko AV, Zabezhinski MA. Circadian disruption induced by
light-at-night accelerates aging and promotes tumorigenesis in young but
not in old rats. Aging. 2010;2(2):82–92.
14. Grivennikov SI, Karin M. Inflammatory cytokines in cancer: tumour necrosis factor
and interleukin 6 take the stage. Ann Rheum Dis. 2011;70 Suppl 1:i104–8.
15. Mantovani A, Allavena P, Sica A, Balkwill F. Cancer-related inflammation.
Nature. 2008;454(7203):436–44.
16. Grivennikov SI, Greten FR, Karin M. Immunity, inflammation, and cancer. Cell.
2010;140(6):883–99.
17. Mauer J, Denson JL, Bruning JC. Versatile functions for IL-6 in metabolism
and cancer. Trends Immunol. 2015;36(2):92–101.
18. Hotamisligil GS. Inflammation and metabolic disorders. Nature. 2006;
444(7121):860–7.
19. Arnold M, Leitzmann M, Freisling H, Bray F, Romieu I, Renehan A,
Soerjomataram I. Obesity and cancer: an update of the global impact.
Cancer Epidemiol. 2016;41:8–15.
Guerrero-Vargas et al. BMC Cancer (2017) 17:625
20. Guerrero-Vargas NN, Salgado-Delgado R, Basualdo MD, Garcia J, GuzmanRuiz M, Carrero JC, Escobar C, Buijs RM. Reciprocal interaction between the
suprachiasmatic nucleus and the immune system tunes down the
inflammatory response to lipopolysaccharide. J Neuroimmunol. 2014.
21. Watanabe K, Sakamoto M, Somiya M, Amin MR, Kamitani H, Watanabe T.
Feasibility and limitations of the rat model by C6 gliomas implanted at the
subcutaneous region. Neurol Res. 2002;24(5):485–90.
22. Benda P, Lightbody J, Sato G, Levine L, Sweet W. Differentiated rat glial cell
strain in tissue culture. Science. 1968;161(3839):370–1.
23. Pfaffl MW. A new mathematical model for relative quantification in real-time
RT-PCR. Nucleic Acids Res. 2001;29(9):e45.
24. Pachynski RK, Scholz A, Monnier J, Butcher EC, Zabel BA. Evaluation of
tumor-infiltrating leukocyte subsets in a subcutaneous tumor model. J Vis
Exp. 2015(98).
25. Anderson LE, Morris JE, Sasser LB, Stevens RG. Effect of constant light on
DMBA mammary tumorigenesis in rats. Cancer Lett. 2000;148(2):121–6.
26. Anisimov VN, Baturin DA, Popovich IG, Zabezhinski MA, Manton KG,
Semenchenko AV, Yashin AI. Effect of exposure to light-at-night on life span
and spontaneous carcinogenesis in female CBA mice. Int J Cancer. 2004;
111(4):475–9.
27. Bhaskaran K, Douglas I, Forbes H, dos-Santos-Silva I, Leon DA, Smeeth L.
Body-mass index and risk of 22 specific cancers: a population-based cohort
study of 5.24 million UK adults. Lancet. 2014;384(9945):755–65.
28. Font-Burgada J, Sun B, Karin M. Obesity and cancer: the oil that feeds the
flame. Cell Metab. 2016;23(1):48–62.
29. Tieu MT, Lovblom LE, McNamara MG, Mason W, Laperriere N, Millar BA,
Menard C, Kiehl TR, Perkins BA, Chung C. Impact of glycemia on survival of
glioblastoma patients treated with radiation and temozolomide. J NeuroOncol. 2015;124(1):119–26.
30. Derr RL, Ye X, Islas MU, Desideri S, Saudek CD, Grossman SA. Association
between hyperglycemia and survival in patients with newly diagnosed
glioblastoma. J Clin Oncol. 2009;27(7):1082–6.
31. Grobben B, De Deyn PP, Slegers H. Rat C6 glioma as experimental model
system for the study of glioblastoma growth and invasion. Cell Tissue Res.
2002;310(3):257–70.
32. Marinac CR, Natarajan L, Sears DD, Gallo LC, Hartman SJ, Arredondo E,
Patterson RE. Prolonged nightly fasting and breast cancer risk: findings from
NHANES (2009–2010). Cancer Epidemiol Biomark Prev. 2015;24(5):783–9.
33. Caffa I, D'Agostino V, Damonte P, Soncini D, Cea M, Monacelli F, Odetti P,
Ballestrero A, Provenzani A, Longo VD, et al. Fasting potentiates the
anticancer activity of tyrosine kinase inhibitors by strengthening MAPK
signaling inhibition. Oncotarget. 2015;6(14):11820–32.
34. Lee C, Raffaghello L, Brandhorst S, Safdie FM, Bianchi G, Martin-Montalvo A,
Pistoia V, Wei M, Hwang S, Merlino A, et al. Fasting cycles retard growth of
tumors and sensitize a range of cancer cell types to chemotherapy. Sci
Transl Med. 2012;4(124):124ra127.
35. Hanahan D, Weinberg RA. Hallmarks of cancer: the next generation. Cell.
2011;144(5):646–74.
36. Cairns RA, Harris IS, Mak TW. Regulation of cancer cell metabolism. Nat Rev
Cancer. 2011;11(2):85–95.
37. Hsu PP, Sabatini DM. Cancer cell metabolism: Warburg and beyond. Cell.
2008;134(5):703–7.
38. Colegio OR, Chu NQ, Szabo AL, Chu T, Rhebergen AM, Jairam V, Cyrus N,
Brokowski CE, Eisenbarth SC, Phillips GM, et al. Functional polarization of
tumour-associated macrophages by tumourderived lactic acid. Nature. 2014;
513(7519):559–63.
39. Hatanaka M. Transport of sugars in tumor cell membranes. Biochim Biophys
Acta. 1974;355(1):77–104.
40. Nagamatsu S, Nakamichi Y, Inoue N, Inoue M, Nishino H, Sawa H. Rat C6
glioma cell growth is related to glucose transport and metabolism.
Biochem J. 1996;319(Pt 2):477–82.
41. Jelluma N, Yang X, Stokoe D, Evan GI, Dansen TB, Haas-Kogan DA. Glucose
withdrawal induces oxidative stress followed by apoptosis in glioblastoma
cells but not in normal human astrocytes. Mol Cancer Res. 2006;4(5):319–30.
42. Dang CV, O'Donnell KA, Zeller KI, Nguyen T, Osthus RC, Li F. The c-Myc
target gene network. Semin Cancer Biol. 2006;16(4):253–64.
43. Osthus RC, Shim H, Kim S, Li Q, Reddy R, Mukherjee M, Xu Y, Wonsey D, Lee
LA, Dang CV. Deregulation of glucose transporter 1 and glycolytic gene
expression by c-Myc. J Biol Chem. 2000;275(29):21797–800.
44. Baudino TA, McKay C, Pendeville-Samain H, Nilsson JA, Maclean KH, White
EL, Davis AC, Ihle JN, Cleveland JL. c-Myc is essential for vasculogenesis and
Page 13 of 13
45.
46.
47.
48.
49.
50.
51.
52.
53.
54.
55.
56.
57.
58.
59.
60.
61.
angiogenesis during development and tumor progression. Genes Dev.
2002;16(19):2530–43.
Forootan FS, Forootan SS, Gou X, Yang J, Liu B, Chen D, Al Fayi MS, AlJameel W, Rudland PS, Hussain SA, et al. Fatty acid activated PPARgamma
promotes tumorigenicity of prostate cancer cells by up regulating VEGF via
PPAR responsive elements of the promoter. Oncotarget. 2016;7(8):9322–39.
Rohrig F, Schulze A. The multifaceted roles of fatty acid synthesis in cancer.
Nat Rev Cancer. 2016;16(11):732–49.
Castanon-Cervantes O, Wu M, Ehlen JC, Paul K, Gamble KL, Johnson RL,
Besing RC, Menaker M, Gewirtz AT, Davidson AJ. Dysregulation of
inflammatory responses by chronic circadian disruption. J Immunol. 2010;
185(10):5796–805.
Depres-Brummer P, Bourin P, Pages N, Metzger G, Levi F. Persistent T
lymphocyte rhythms despite suppressed circadian clock outputs in rats. Am
J Physiol. 1997;273(6 Pt 2):R1891–9.
Oishi K, Shibusawa K, Kakazu H, Kuriyama T, Ohkura N, Machida K. Extended
light exposure suppresses nocturnal increases in cytotoxic activity of splenic
natural killer cells in rats. Biol Rhythm Res. 2006;37:21–35.
Valdes-Tovar M, Escobar C, Solis-Chagoyan H, Asai M, Benitez-King G.
Constant light suppresses production of Met-enkephalin-containing
peptides in cultured splenic macrophages and impairs primary immune
response in rats. Chronobiol Int. 2015;32(2):164–77.
Hussain SF, Yang D, Suki D, Aldape K, Grimm E, Heimberger AB. The role of
human gliomainfiltrating microglia/macrophages in mediating antitumor
immune responses. Neuro-Oncology. 2006;8(3):261–79.
Lewis CE, Pollard JW. Distinct role of macrophages in different tumor
microenvironments. Cancer Res. 2006;66(2):605–12.
De Palma M, Venneri MA, Galli R, Sergi Sergi L, Politi LS, Sampaolesi M,
Naldini L. Tie2 identifies a hematopoietic lineage of proangiogenic
monocytes required for tumor vessel formation and a mesenchymal
population of pericyte progenitors. Cancer Cell. 2005;8(3):211–26.
Takeda N, O'Dea EL, Doedens A, Kim JW, Weidemann A, Stockmann C,
Asagiri M, Simon MC, Hoffmann A, Johnson RS. Differential activation and
antagonistic function of HIF-{alpha} isoforms in macrophages are essential
for NO homeostasis. Genes Dev. 2010;24(5):491–501.
Dewhirst MW. Intermittent hypoxia furthers the rationale for hypoxiainducible factor-1 targeting. Cancer Res. 2007;67(3):854–5.
Tapia-Osorio A, Salgado-Delgado R, Angeles-Castellanos M, Escobar C.
Disruption of circadian rhythms due to chronic constant light leads to
depressive and anxiety-like behaviors in the rat. Behav Brain Res. 2013;252:
1–9.
Gooley JJ, Chamberlain K, Smith KA, Khalsa SB, Rajaratnam SM, Van Reen E,
Zeitzer JM, Czeisler CA, Lockley SW. Exposure to room light before bedtime
suppresses melatonin onset and shortens melatonin duration in humans. J
Clin Endocrinol Metab. 2011;96(3):E463–72.
Chang AM, Santhi N, St Hilaire M, Gronfier C, Bradstreet DS, Duffy JF,
Lockley SW, Kronauer RE, Czeisler CA. Human responses to bright light of
different durations. J Physiol. 2012;590(13):3103–12.
Fonken LK, Kitsmiller E, Smale L, Nelson RJ. Dim nighttime light impairs
cognition and provokes depressive-like responses in a diurnal rodent. J Biol
Rhythm. 2012;27(4):319–27.
Fonken LK, Haim A, Nelson RJ. Dim light at night increases immune
function in Nile grass rats, a diurnal rodent. Chronobiol Int. 2012;29(1):26–34.
Kettner NM, Voicu H, Finegold MJ, Coarfa C, Sreekumar A, Putluri N, Katchy
CA, Lee C, Moore DD, Fu L. Circadian homeostasis of liver metabolism
suppresses hepatocarcinogenesis. Cancer Cell. 2016;30(6):909–24.
Submit your next manuscript to BioMed Central
and we will help you at every step:
• We accept pre-submission inquiries
• Our selector tool helps you to find the most relevant journal
• We provide round the clock customer support
• Convenient online submission
• Thorough peer review
• Inclusion in PubMed and all major indexing services
• Maximum visibility for your research
Submit your manuscript at
www.biomedcentral.com/submit