CAISMOV24, a new human low-grade serous ovarian carcinoma cell line
Bạn đang xem bản rút gọn của tài liệu. Xem và tải ngay bản đầy đủ của tài liệu tại đây (1.08 MB, 12 trang )
da Silva et al. BMC Cancer (2017) 17:756
DOI 10.1186/s12885-017-3716-4
RESEARCH ARTICLE
Open Access
CAISMOV24, a new human low-grade
serous ovarian carcinoma cell line
Rodrigo Fernandes da Silva1, Daniela Maira Cardozo1, Gisele Olinto Libanio Rodrigues2,3,
Caroline Natânia de Souza-Araújo1, Natacha Azussa Migita2,3, Liliana Aparecida Lucci de Angelo Andrade1,
Sophie Derchain1,4, José Andrés Yunes1,3 and Fernando Guimarães1,4*
Abstract
Background: The spontaneous immortalization of primary malignant cells is frequently assigned to their genetic
instability during in vitro culturing. In this study, the new epithelial ovarian cancer cell line CAISMOV24 was described
and compared with its original low-grade serous ovarian carcinoma.
Methods: The in vitro culture was established with cells isolated from ascites of a 60-year-old female patient
with recurrent ovarian cancer. The CAISMOV24 line was assessed for cell growth, production of soluble biomarkers,
expression of surface molecules and screened for typical mutations found in serous ovarian carcinoma. Additionally,
comparative genomic hybridization was employed to compare genomic alterations between the CAISMOV24 cell line
and its primary malignant cells.
Results: CAISMOV24 has been in continuous culture for more than 30 months and more than 100 in vitro passages.
The cell surface molecules EpCAM, PVR and CD73 are overexpressed on CAISMOV24 cells compared to the primary
malignant cells. CAISMOV24 continues to produce CA125 and HE4 in vitro. Although the cell line had developed
alongside the accumulation of genomic alterations (28 CNV in primary cells and 37 CNV in CAISMOV24), most of
them were related to CNVs already present in primary malignant cells. CAISMOV24 cell line harbored KRAS mutation
with wild type TP53, therefore it is characterized as low-grade serous carcinoma.
Conclusion: Our results corroborate with the idea that genomic alterations, depicted by CNVs, can be used
for subtyping epithelial ovarian carcinomas. Additionally, CAISMOV24 cell line was characterized as a low-grade serous
ovarian carcinoma, which still resembles its primary malignant cells.
Keywords: Ascites, Cell culture, Comparative genomic hybridization, KRAS
Background
Ovarian cancer is the most lethal gynecological cancer,
causing most of women’s death. Its lethality is a consequence of the lack of symptoms or biomarkers enabling
the early diagnosis of disease, and the propensity of
malignant cells to seed the peritoneal cavity. The epithelium accounts for 90% of ovarian cancers [1, 2]. Epithelial
ovarian cancer (EOC) comprises four major histotypes,
which are further classified based on their growth and
molecular characteristics in slowly developing or type I
* Correspondence:
1
Faculdade de Ciências Médicas, University of Campinas, Campinas, SP, Brazil
4
Women’s Hospital “Professor Doutor José Aristodemo Pinotti” – CAISM,
University of Campinas, Rua Alexander Fleming 101, Campinas, SP 13083-881,
Brazil
Full list of author information is available at the end of the article
tumors, and more aggressive or type II tumors [3–5]. The
serous histotype is responsible for almost 70% of epithelial
ovarian cancers, which are additionally differentiated into
low (type I) and high grades (type II). The most aggressive
subtype of serous ovarian carcinoma accounts for twothirds of all ovarian cancer deaths, making them the most
extensively studied ovarian carcinoma [3, 4, 6].
Biomarkers and molecular characterization of the
tumors can represent a more accurate biological classification to separate and treat these tumors, rather than
their site of origin. As an example, cancer antigen 125
(CA125) and human epididymis protein 4 (HE4) have
been detected in the serum of ovarian cancer patients.
Together, they enhance the sensitivity and specificity for
the diagnosis of the disease [7, 8]. Additionally, the
© The Author(s). 2017 Open Access This article is distributed under the terms of the Creative Commons Attribution 4.0
International License ( which permits unrestricted use, distribution, and
reproduction in any medium, provided you give appropriate credit to the original author(s) and the source, provide a link to
the Creative Commons license, and indicate if changes were made. The Creative Commons Public Domain Dedication waiver
( applies to the data made available in this article, unless otherwise stated.
da Silva et al. BMC Cancer (2017) 17:756
identification of molecular surface markers on malignant
cells can both contribute to the diagnosis and a better
comprehension of tumor-host interactions [9–11].
Recently, molecular characteristics of tumors have become
the new standard classification for clinical pathology. In
this concern, methods such as comparative genomic
hybridization allow the detection of deletions and duplications of genomic segments, known as copy number
variation (CNV). This method has been used to evaluate
differences between cancer histotypes and putative target
driver genes in EOC [12, 13].
Cell lines from various tumor types have been developed for use as a tumor model for controlled laboratory
studies. Usually, cell lines have the facility to be cultivated, stored and shared between different laboratories.
However, cell lines are known for their susceptibility to
genetic and metabolic alterations, which can alter their
characteristics in relation to the primary malignant cells.
Ideally, the more a cell line resembles the primary malignant cells, the more useful it will be for scientific
research. In vitro cultures of primary malignant cells and
established cell lines have been widely employed as
experimental models for the understanding of ovarian
cancer biology, the evaluation of new therapeutic
approaches and to search for tumor markers [14–17].
Currently, Broad-Novartis Cancer Cell Line Encyclopedia
(CCLE includes 52
cell lines of human ovarian cancer [18]. Jacob et al. [17],
recently published a review including 104 human cell lines
originating from ovarian cancers or human ovarian surface epithelium. However, there are a limited number of
the already established ovarian carcinoma cell lines, which
have been well characterized as in vitro models. Domcke
et al. [19] evaluated the genomic profiles of 47 ovarian cell
lines in comparison to ovarian tumor samples, and found
that some of the cell lines most commonly used as experimental models do not resemble their cognate tumor profile. Thus, new, well-characterized cell lines that resemble
the different histological and molecular subtypes of ovarian neoplasia are still needed, particularly for lowgrade serous ovarian carcinoma [3, 4]. The goal of
this study was to report the establishment of a new
Page 2 of 12
human epithelial ovarian carcinoma cell line (CAISMOV24), describing its phenotypic and molecular
characteristics, and comparing genomic alterations between the cell line and its primary malignant cells.
Methods
Patient and ascites sampling
The patient was a 60-year-old woman, originally
subjected to exploratory laparotomy for the diagnosis of
ovarian neoplasia, procedure that was carried out at
"Hospital da Mulher Prof. Dr. José Aristodemo Pinotti–
Centro de Atenção Integral à Saúde da Mulher", the
Women’s Hospital of the University of Campinas
(Campinas, Brazil). A non-resectable stage IIIC ovarian
neoplasia was found from which a biopsy of the tumor
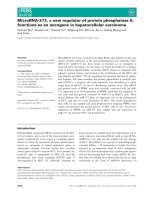
mass was collected. The anatomical pathological diagnosis
was consistent with a low-grade serous adenocarcinoma
of the ovary (Fig. 1). Subsequently, the patient was treated
with chemotherapy followed by surgery for cytoreduction.
Relapse occurred 1 year later, when ascites fluid originally used to initiate the in vitro culture of EOC cells was
collected by sterile aspiration at the time of a laparotomy, in May 2011. The serum level of CA125 at the
time of ascites collection was 2216 U/ml. The patient
died in August 2012 with pulmonary metastasis. The
study was approved by the Research Ethics Committee
of Unicamp (897/2011) and was registered on the
Brazilian National Health Council (CAAE: 0807.0.146.000–
11). Signed informed consent was obtained from the
patient prior sampling of ascites and blood.
Initiation of the cell culture and maintenance
of the cell line
The ascites fluid was taken to our cell culture laboratory
and processed immediately after sampling. Ascites fluid
was transferred to 50 ml conical tubes, the total volume
was doubled by the addition of balanced salt solution
(PBS; Nutricell, Campinas, Brazil) and 25 IU/ml of
heparin was added (Liquemine, Roche, São Paulo, SP,
Brazil). The cell fraction was isolated by centrifugation
and washed twice in PBS (400 g/8 min/room
temperature). The final cell pellet was suspended in
Fig. 1 Peritoneal implant of low-grade serous ovarian carcinoma. a obj 10× and b obj 40×
da Silva et al. BMC Cancer (2017) 17:756
HAM F10 medium supplemented with L-glutamine
(2 mM, Nutricell, Campinas, Brazil) and fetal bovine serum
(10%, FBS; Nutricell, Campinas, Brazil). Cell number and
viability were assessed using a hemocytometer and the
trypan-blue exclusion method, respectively. Although the
cell suspension was constituted by a diversity of cells at this
time, the presence of tumor cells was noticed and the cell
suspension was adjusted to 1 × 10⁶ cells/ml with culture
medium. Thus, 10 × 104 cells were seeded in petri dishes
(35 X 10 mm; Corning, New York, USA), with supplemented culture medium added up to a volume of 2 ml
(resulting in a 5 × 10⁴ cells/ml suspension); dishes were
placed in an incubator (37 °C, 5% CO2). The initial subcultures (the first 12 in vitro passages) were performed without
a regular time period, ranging from 3 to 4 weeks, after
which cells were detached with trypsin/EDTA (0.25%;
Nutricell, Campinas, Brazil), counted and seeded in new
T25 flasks (JetBiofil, Guangzhou, China) at 104 cells/cm2
with supplemented HAM F10 medium. From the 12th in
vitro passage onwards, the maintenance of the cultures and
subculturing became regular. Thus, cultures were replenished with fresh medium every 2–3 days, and treated with
trypsin/EDTA for cell re-plating every 2 weeks.
Assessment of in vitro growth kinetics of the cells
Quantification of the dividing capabilities of the cells was
assessed several times during the 63rd and 100th in vitro
passages. Thus, T25 culture flasks were seeded with 104
cells/cm2. Subsequently, replicates of the culture flasks were
treated with trypsin/EDTA for cell detaching at different
time points, and their number and viability were assessed
using a hemocytometer and the trypan-blue exclusion
method. The mean number of cells per centimeter square
was expressed on a semi-logarithmic scale. Additionally,
cell division in cultures was assessed by flow cytometry. For
this, CAISMOV24 cells were labelled with violet proliferation dye 450 (VPD450, Becton, Dickinson and Company,
Mountain View, USA) according to the manufacturer’s instructions, prior to being seeded in T25 culture flasks at a
density of 104 cells/cm2. Subsequently, cells were detached
at different time points (days 3, 5, 7 and 10) for acquisition in a FACS Verse with FACS Suite software
(Becton Dickinson, San Jose, USA). Stained cell suspensions were analyzed by setting the appropriate
SSC/FSC gate on tumor cells and taking into account
the fluorescence intensities on day 0 in labelled and
unlabeled cells. The proliferation platform of FlowJo
7.1 software (Tree Star, Ashland, USA) was used for
the data analysis.
Page 3 of 12
appropriate concentrations of fluorochrome-conjugated
monoclonal antibodies (MAb), anti-CD326 (antiEpCAM, clone EBA), anti-HLA-class I (clone G46–2.6),
anti-TGFβ1 (clone TW4-9E7), anti-CD39 (clone TU66),
anti-CD73 (clone A2D) (Becton, Dickinson and Company, Mountain View, USA) and anti-CD155 (anti-PVR,
clone 2H7) (eBioscience, San Diego, USA). Cells were
incubated for 30 min in an ice bath and protected from
light. After incubation, cells were washed twice with PBS
and the final cell pellets were suspended for acquisition
in a FACS Verse with FACS Suite software (Becton
Dickinson, San Jose, USA). The human erythromyeloblastoid cell line K562 was used as a negative control
for most of the surface molecules assessed in the
assay. All samples were analyzed by setting the appropriate SSC/FSC gate on the tumor cells. FlowJo 10.0
software (Tree Star, Ashland, USA) was used for the
data analysis.
The levels of soluble tumor markers CA125 and HE4
(human epididymis protein 4) were evaluated in the
culture media taken between the 45th and 65th in vitro
passages of the cells. An automatic chemiluminescencebased immunoassay was employed for this purpose. Thus,
the CA125 II and Architect HE4 kits, combined with
the Architect iSystem (Abott Diagnostics; Wiesbaden,
Germany), were used according to the manufacturer’s
instructions to assess CA125 and HE4, respectively.
Cytogenetic analysis
The established cell line was subjected for routine
karyotype and cytogenetic analysis. Briefly, cell cultures were treated with 100 μl of KarioMAX colcemid solution (10 μg/ml; Life Techinologyes, Carlsbad,
CA, USA) and incubated for 5 h (37 °C, 5% CO2).
Cells were detached with trypsin/EDTA (0.25%),
transferred to a 15 ml conical tube and centrifuged
(200 g/10 min/room temperature). The cells were
subjected to hypotonic treatment with 0.075 M KC1
for 8 min at 37 °C, centrifuged and fixed at least 3
times for 10 min with a freshly prepared 3:1 mixture
of methanol and acetic acid. Chromosome preparations were then made by dripping the cell suspension
onto cold and wet clean slides and air-drying. The
chromosome analysis was performed after staining of
the slides for Giemsa G-banding. Twenty good quality metaphases were analyzed in order to describe
the main findings, and digital images were obtained
by using the BANDview System (Applied Spectral
Imaging; Carlsbad, USA).
Immunophenotyping of cell line and biomarkers
production in culture
Cell line authentication
A flow cytometric-based assay was used according to
standard procedures. Briefly, the cells were mixed with
Analysis of short tandem repeats (STRs) was performed
by Genomic Engenharia Molecular Ltda. (São Paulo,
da Silva et al. BMC Cancer (2017) 17:756
Brazil). STR analyses included markers for 21 loci on
different chromosomes: D10S1237, D13S317, D16S539,
D18S51, D19S433, D1S1656, D21S11, D22S1045, D2S1338,
D3S1358, D5S818, D7S820, D8S1179, HUMCSF1PO,
HUMFIBRA_FGA, HUMTH01, HUMTPOX, HUMVWA,
Penta D, Penta E. STR profile of CAISMOV24 cell line was
compared to that of other human cell lines, by using the
tool available on line at />vices-human-and-animal-cell-lines/online-str-analysis.html.
Cell identity is expressed as an evaluation value (EV) and
calculated as EV = (Number of coincident peaks of STR
profiles between cell lines A and B) X 2 / Total number of
peaks of STR profiles in A and B. EV values greater than
0.9 indicate that the two cell types are derived from the
same origin [20].
Comparative genomic hybridization assay
The Affymetrix Cytoscan HD platform microarray
(Affymetrix, Santa Clara, USA) was employed to
compare DNA alterations between the CAISMOV24
cells and their primary malignant cells. This array
comparative genome hybridization platform contains 2.6
million markers for CNVs and 750,000 for single nucleotide polymorphisms (SNPs), enabling the high resolution
detection of aberrations across the genome. Prior to
DNA extraction, primary malignant cells were isolated
from ascites by positive selection of the leukocytes,
which was achieved by employing anti-CD45 MAb
conjugated with beads and magnetic columns (MidiMacs
separation system, Miltenyi, Bergisch Gladbach, Germany).
Additionally, the cell suspension of the CAISMOV24 line
was obtained by the detachment of cells from the established culture. DNA was obtained with an extraction kit
based on columns with a silica membrane for DNA purification. (Illustra genomicPrep MiniSpin Kit, GE Healthcare,
Buckinghamshire, UK). Finally, 250 ng of genomic DNA
from CAISMOV24 cells and their primary malignant cells
was used for microarray hybridization using the Cytoscan
HD platform (Affymetrix) according to the manufacturer’s
instructions. The Affymetrix CEL data files were converted
into CYCHP files and the microarray data were analyzed
using the Affymetrix Chromosome Analysis Suite 3.0
(ChAS 3.1) (Affymetrix). Analysis was performed using a
setting of 50 consecutive probes and 100 kbp in length for
the detection of gains or losses. The intersection of genes
present in genomic alteration regions, common between
the primary malignant cells and CAISMOV24 cells, was
analyzed using InteractVenn software (erac
tivenn.net/). Relevant genes contained in the altered
genomic sequences were compared with those reported by the Catalogue of Somatic Mutations in
Cancer (COSMIC Welcome Trust Sanger Institute,
/>
Page 4 of 12
Mutation screening
DNA and RNA were obtained from cryopreserved
CAISMOV24 cells at 83rd in vitro passage with extraction kits based on columns with silica membrane and
designed for DNA or RNA purification respectively
(Illustra genomicPrep MiniSpin Kit, GE Healthcare,
Buckinghamshire, UK). DNA and RNA were quantified
with the Qubit dsDNA HS Assay Kit (ThermoFisher
Scinteific, Waltham, USA) and RNA BR Assay Kit
(ThermoFisher Scinteific) respectively. The quality of
DNA extraction products was assessed through electrophoresis in agarose (1%) stained with SYBR safe DNA
Gel Stain (ThermoFisher Scinteific). RNA fragment
length was assessed by a Bioanalyzer trace (DV200 metric)
using an RNA 6000 chip on an Agilent Bioanalyzer
(Agilent Technologies Inc., Santa Clara, USA). DNA products were assessed for possible mutations in KRAS (exon
2), BRAF (exon 2) and TP53 (exon 2–11) genes by Sanger
sequencing with the BigDye Terminator v3.1 Cycle
Sequencing Kit (ThermoFisher Scientific) and capillary
electrophoresis in an Applied Biosystems automated
sequencer. Primers used for PCR are provided in
Additional file 1: Table S1, and were based on the
previously described by Arcila et al. [21]. Additionally,
TruSight RNA Pan-Cancer Panel (Illumina, Inc., USA)
was employed for transcriptome analysis of 1385 genes
and 21,043 exons regions implicated in hotspot cancer
pathways, following the manufacturer’s protocol. Briefly,
targeted RNA-seq libraries were prepared using 50 ng of
total RNA. The sample was subjected to RNA sequencing
on an Illumina MiSeq (Illumina, Inc.) at 8 samples per
flow cell (~3 M reads per sample). Read mapping, gene
expression information, variant calling, and fusion detection were performed using the RNA-Seq Alignment App
with STAR aligner on BaseSpace Sequence Hub.
Results
CAISMOV24 cell line establishment and in vitro growth
kinetics
Primary culture with cells from ascites was mainly
composed of epithelial cells, and a small number of
fibroblasts. However, the number of fibroblasts decreased
until disappearing along with the initial in vitro passages.
As previously mentioned, the first 9 to 12 initial subcultures were performed without a regular period of time
(among 3 to 4 weeks), the period in which cell proliferation was slow and unable to cover the entire culture flask
surface. After this period, cell proliferation became
quicker and in vitro passages for the maintenance of cell
culture became regular (every 2 weeks). To evaluate the
reproducibility of the cell culture transformation from primary cells into the cell line, this procedure was repeated
using cells from ascites which were maintained and
da Silva et al. BMC Cancer (2017) 17:756
Page 5 of 12
are important components in the treatment of women
with adnexal masses. The production of serum biomarkers by CAISMOV24 cells in culture was confirmed by the detection of CA125 (135.80 U/ml
±56.26) and HE4 (811.45 pmol/ml ±53.53) in the
supernatant of CAISMOV24 cell cultures.
cryopreserved. As a result, the same pattern of development was observed.
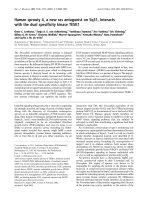
CAISMOV24 has been in continuous culture for more
than 30 months and more than 100 in vitro passages.
Figure 2a shows the typical epithelioid morphology of
the established cell line. After cell plating, CAISMOV24
cells require 2–3 days to exhibit their fully proliferation
capability, when their average doubling population time
was calculated to be 71.2 h. Although the growth rate of
the cell culture diminished from the 10th day, the cells
continue to proliferate until covering the entire surface
of the culture flask, reaching approximately 100,000
cells/cm2 with 96% viability (Fig. 2b). VPD450-stained
CAISMOV24 cells assessed by flow cytometry allowed
the mean proliferation index to be calculated as
3.94 ± 0.94 times (Fig. 2c).
Cytogenetic analysis
Immunophenotyping and biomarker production in
culture
Cell line authentication
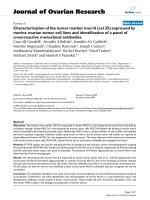
Figure 3 compares the expression of the HLA-class I,
PVR (CD155), EpCAM (CD326), TGFβ1, CD39 and
CD73 surface molecules between CAISMOV24 cells
and their primary malignant cells from ascites. The
CAISMOV24 cell line was characterized by the expression
of HLA-class I, EpCAM and PVR molecules. Additionally,
CAISMOV24 cells express high levels of TGFβ1 and
CD73, and low levels of CD39, molecules which are
absent or modestly expressed on primary malignant cells.
Serum biomarkers such as CA125 and more recently HE4
The chromosomes of the cell line were initially analyzed
by a routine karyotyping approach in the 45th in vitro
passage. Figure 4 shows one representative G-banded
karyotype depicting the main findings. According to
standard nomenclature, the karyotype of this cell is
denoted as 53~55,XX, +1, add(1) (p36), add(2) (p25), +3,
add(4) (q35), +5, +7, +8, −9, +dic(9;?) (p13;?), +12, +14,
+16, −19, +20, +22, −X, +mar[cp51].
Tables 1 and 2 summarize the main findings regarding
STR analysis. Comparisons of STR profiles between
CAISMOV24 and other human cell lines did not match
EV values greater than 0.9, confirming the uniqueness of
CAISMOV24 cell line.
Comparative genomic hybridization assay
CAISMOV24 cell line and its primary malignant cells
were compared for chromosomal aberrations. For this
purpose, a comparative genomic hybridization assay was
Fig. 2 a Different time points of the in vitro growth of the CAISMOV24 cell line. CAISMOV24 cells were launched at 104 cells/cm2 in HAM F10
medium supplemented with 2 mM L-glutamine and 10% fetal bovine serum. b Representative growth curve for the CAISMOV24 cell line, assessed
from the 63rd to the 100th in vitro passages. c Proliferation profile of CAISMOV24 cells assessed by flow cytometry on day 5, following cell labeling
with violet proliferation dye 450 (VPD450); the shaded areas represent each of the new cell generations, which retained approximately half of the
VPD450 fluorescence intensity of its parent cell. Mean proliferation index of CAISMOV24 cells resulted in 3.94 ± 0.94 times
da Silva et al. BMC Cancer (2017) 17:756
Page 6 of 12
Fig. 3 Flow cytometric profiles representative of the fluorescence intensity of the molecules, HLA-class I, PVR (CD155), EpCAM (CD326), TGF-β1,
CD39 and CD73, comparing the expression of these surface molecules between the CAISMOV24 cell line and its primary malignant cells. The cells
were incubated with appropriate concentrations of fluorochrome-conjugated monoclonal antibodies. After incubation, cells were washed with
PBS and the final cell pellets suspended for acquisition, using a FACS Verse flow cytometer. The K562 cell line was employed as a negative control
for most of the surface molecules assessed in this assay
employed. Table 3 summarizes the main findings regarding CNVs. The total number of CNVs increased with the
number of in vitro passages, with 28 detected in the primary malignant cells and 37 in the cell line assessed at
the 83rd in vitro passage. Chromosomes 4, 10, 15, 17, 18
and 21 remained unaltered, both in the primary malignant cells and in the cell line. Additionally, in eight
of the altered chromosomes, the number of CNVs
remained the same for the primary malignant cells
and the cell line. The most affected chromosomes
Fig. 4 Representative G-banded karyotype of a CAISMOV24 cell with 54 chromosomes. Dic = dicentric chromosome, add = additional material
of unknown origin
da Silva et al. BMC Cancer (2017) 17:756
Page 7 of 12
Table 1 Short tandem repeat (STR) analysis of CAISMOV24
Locus
Alleles
Table 2 Short tandem repeat (STR) comparisons with DSMZ
database
D10S1237
21,19
EV
Cell No. Scored
D13S317
12,11
1.00–0.95
0
D16S539
12,12
0.95–0.90
0
D18S51
19,12
0.90–0.85
0
D19S433
14,13
0.85–0.80
1
D1S1656
16,15.3
0.80–0.75
3
D21S11
32.2,30
0.75–0.70
3
D22S1045
16,16
0.70–0.65
33
D2S1338
17,17
0.65–0.60
74
D3S1358
17,16
0.60–0.55
214
D5S818
13,12
0.55–0.50
328
D7S820
12,8
0.50–0.45
38
D8S1179
13,10
0.45–0.40
503
HUMCSF1PO
12,12
0.40–0.35
675
HUMF13B
10,9
0.35–0.30
608
HUMFIBRA_FGA
25,23
0.30–0.25
458
HUMTH01
6,6
0.25–0.20
223
HUMTPOX
8,8
0.20–0.15
90
HUMVWA
17,17
0.15–0.10
13
Penta D
9,9
0.10–0.05
0
13,7
0.05–0.00
10
Penta E
(with three or more CNVs) in the primary malignant
cells were chromosomes 7, 8, 12, 20 and X, which
represented 60.7% (17 in 28) of the total CNVs. Chromosomes 1, 7, 8, 9, 12, 16 and 20 from the CAISMOV24 cell line had high numbers of CNVs (three
or more CNVs), which represented 67.6% (25 in 37)
of the total CNVs. Although CNVs were mostly represented by gains of genomic sequences (86% of
CNVs in primary malignant cells and 78% in
CAISMOV24 cell line), CNVs also included losses of genomic sequences and hemizygous deletions of duplicated
chromosome regions, characterizing copy neutral loss
of heterozygosity (cnLOH, genotyping provided in
Additional file 2: Table S2, Additional file 3: Table S3
and Additional file 4: Table S4). Among losses of genomic sequences, there was one detected on chromosome 9 (ch9p21.3) of the primary malignant cells that
was not detected in CAISMOV24 cell line. Extensive
alterations, involving long genomic sequences, were
detected in chromosomes 2, 3, 5, 7, 8, 12, 13, 14, 19
and X (Fig. 5). The total size of genomic sequences
contained in CNVs was higher in CAISMOV24 cells
(1,971,963 kbp) than in the primary malignant cells
(1,394,479 kbp).
The chromosomal regions affected by CNVs included
10,523 genes. Of these, 8798 genes were common for
STR profile of CAISMOV24 cell line was compared to that of other 3274
human cell lines available at DSMZ site, />services-human-and-animal-cell-lines/online-str-analysis.html; Number of
cell lines scored among different evaluation values (EV)
CNVs found either in the CAISMOV24 cell line or its
primary malignant cell, 710 genes were present only in
CNVs of the CAISMOV24 line, whilst 1015 genes were
present only in the CNVs of the primary malignant cell
(InteractVenn />
Mutation screening
Screening for typical mutations of serous ovarian carcinomas found that CAISMOV24 harbored KRAS mutation,
together with wild type TP53, characterizing the cell line as
low-grade serous ovarian carcinoma. Furthermore, transcriptome analysis confirmed the typical KRAS mutation
(rs121913529; HGVS nomenclatures: NM_004985.4:c.35G
> T, NP_004976.2:p.Gly12Val) frequently observed in lowgrade serous ovarian carcinomas. Transcriptome analysis
also showed absence of gene fusions, and revealed
several genes with SNP, in which its clinical relevance
for the development of the serous ovarian carcinoma
is unknown (Additional file 5: Table S5). Table 4
shows 15 variant genes without SNP location record
and their frequency of alterations in CAISMOV24 cell
line was higher than 0.35.
1
1
14
16
Gain
Gain
Gain
Gain
Gain
Gain
Gain
Gain
cnLOH
Gain
Gain
Gain
Gain
Gain
Gain
Loss
Loss
Gain
Gain
Gain
Gain
Gain
Gain
Loss
Gain
Gain
Gain
182
201
384
512
1499
5355
55,959
1142
90,074
86,774
95,671
9834
11,031
28,314
84,394
209
140
4398
39,089
99,432
7818
66,570
83,982
127
180,606
197,79
242, 771
Xq21.31(88,604,293–88,786,664)×3
Xp22.33(2,956,273–3,156,774)×3
Xq21.2(85,297,084–85,680,929)×3
22q11.22(22,943,460–23,455,803)×25–26
20p13(61,568–1,560,550)×3
20q13.32q13.33(57,560,776–62,915,555)×3
20q13.32q13.33(57,560,776–62,915,555)×3
19p13.3(260,911–1,403,381)×24–25
16p13.3q24.3(89,560–90,163,275) hmz
14q11.2q32.33(20,511,672–107,285,437)×2–3
13q11q34(19,436,286–115,107,733)×3
12q12q13.12(39,535,139–49,369,195)×29–30
12p13.33p13.2(173,786–11,204,306)×39–40
12p13.2q12(11,207,579–39,521,153)×39–40
12q13.12q24.33(49,385,726–133,777,902)×39–40
9p21.3(21,887,365–22,096,124)×1
8p11.22(39,247,097–39,386,952)×2
8p11.22p11.1(39,388,765–43,786,723)×4
8p23.3p11.22(158,048–39,246,760)×4
8q11.1q24.3(46,863,521–146,295,771)×4
7q11.21q11.23(66,698,378–74,516,616)×3
7p22.3q11.21(43,360–66,613,020)×3
7q11.23q36.3(75,137,713–159,119,707)×3
6p25.3(254,282–381,137)×1
5p15.33q35.3(113,576–180,719,789)×3
3p26.3q29(61,891–197,851,986)×3
2p25.3q37.3(12,770–242,783,384)×28–29
22
X
0
1
2
20
19
16
14
13
1
1
3
1
5
2
1
3
1
11
12
3
4
8
9
4
1
1
2
1
7
6
5
3
2
6
34
106
515
51
955
770
459
68
192
149
778
4
58
418
659
1
1035
1279
1494
CNV
3
Type
Gain
Gain
Gain
Gain
Gain
Gain
Loss
Gain
Gain
Loss
cnLOH
Gain
Gain
Gain
Loss
Gain
Gain
Gain
Gain
Gain
Gain
Loss
Gain
Gain
Gain
Gain
Gain
Gain
Gain
Loss
Gain
Loss
Gain
cnLOH
Gain
Size (kbp)
74,778
458
557
14,149
47,64
1256
124
143
236
291
82,965
13,876
71,619
95,671
9499
11,276
23,369
364
679
3244
21,879
140
4398
39,089
99,432
1695
3221
72,589
80,786
127
180,606
276
197,79
242,76
113,168
144,332
317,481
Cytoband interval
Xp22.33q13.3(168,546–74,946,70n)×2–3
22q11.22(22,997,802–23,455,803)×24–25
20p12.1(14,319,185–14,875,738)×3
20p13p12.1(61,568–14,210,343)×3
20p12.1q13.33(15,275,354–62,915,555)×3
19p13.3(260,911–1,517,292)×24–25
16p13.3(7,094,531–7,218,941)×1
16p13.3(1,986,979–2,129,528)×3
16p13.3(1,052,879–1,288,518)×3
16p13.3(7,441,425–7,732,737)×1
16p13.3q24.3(7,198,476–90,163,275) hmz
14q32.12q32.33(93,408,967–107,285,437)×29–30
14q11.2q32.12(20,511,672–92,130,966)×29–30
13q11q34(19,436,286–115,107,733)×3
12q12q13.11(39,441,095–48,940,506)×1
12p13.33p13.2(173,786–11,450,109)×39–40
12p13.2p11.1(11,466,434–34,835,837)×39–40
11p15.5(241,986–606,294)×3
9q34.3(139,282,807–139,961,930)×3
9p21.3(22,086,839–25,330,810)×291–292
9p24.3p21.3(203,861–22,082,884)×2–3
8p11.22(39,247,097–39,386,952)×1
8p11.22p11.1(39,388,765–43,786,723)×4
8p23.3p11.22(158,048–39,246,760)×4
8q11.1q24.3(46,863,521–146,295,771)×4
7q11.23(72,692,112–74,386,749)×3
7q11.23q21.11(75,034,632–78,255,196)×3
7p22.3q11.23(43,360–72,632,831)×3
7q21.11q36.3(78,333,779–159,119,707)×3
6p25.3(254,253–381,137)×1
5p15.33q35.3(113,576–180,719,789)×3
3q12.1(98,596,503–98,872,626)×0–1
3p26.3q29(61,891–197,851,986)×3
2p25.3q37.3(15,702–242,775,910) hmz
1p36.33(2,173,472–2,286,640)×0–1
1p36.33(900,361–1,044,693)×2–3
1p36.32(3,324,208–3,641,689)×0–1
Gene Count
494
4
2
134
518
58
1
18
6
1
734
238
521
459
51
198
139
21
45
5
102
2
33
292
511
33
39
436
626
1
1035
1
1278
1494
3
8
7
CNV copy number variation; Column “Gene Count” refers to number of genes found in CNV sequence, cnLOH Copy neutral loss of heterozygosity; Cytoband interval based on assembly human genome hg19
3
1
13
1
4
12
X
1
9
22
4
8
1
3
7
3
1
6
19
1
5
20
1
1
1
6
3
1p36.32(3,331,773–3,552,456)×3
2
221
Chromosome
Gain
1
Gene Count
1
Cytoband interval
CAISMOV24
Size (kbp)
CNV
Chromosome
Type
Primary maligant cells
Table 3 Comparison of copy number variations (CNVs) between CAISMOV24 cell line and its primary low-grade serous ovarian carcinoma cells
da Silva et al. BMC Cancer (2017) 17:756
Page 8 of 12
da Silva et al. BMC Cancer (2017) 17:756
Page 9 of 12
Fig. 5 Image captured from software ChAS (Affymetrix, USA) summarizing chromosomal aberrations found across the genome of the CAISMOV24
cell line compared with its primary malignant cells. Extensive alterations, involving long genomic sequences, were detected in chromosomes 3, 5,
7, 8, 12, 13, 14, 19 and X, both in the CAISMOV24 cell line and its primary malignant cell. X axis = Chromosomes; Left y axis = Allele differences
(gray); Right y axis = Copy number state (black)
Discussion
In this study a new low-grade serous ovarian carcinoma
cell line, named as CAISMOV24, was characterized in
terms of its in vitro cell growth, production of soluble biomarkers and expression of cell surface molecules.
Additionally, CAISMOV24 was molecularly characterized
and compared to its primary malignant cells for genomic
alterations. In vitro models of well-characterized lowgrade serous ovarian cell lines are currently limited in the
literature. CAISMOV24 resulted from the in vitro
spontaneous immortalization of primary malignant cells
from ascites that was associated with a low-grade serous
ovarian carcinoma. Although malignant cells of ovarian
neoplasia from either tumor tissue or ascites can be
Table 4 Gene mutations without SNP location record and with high alteration frequencies in CAISMOV24 cell line
Gene
Chr
Position
Depth
Ref
Alt
Alt Freq
Variant Type
AKAP9
chr7
91,652,181
18
C
CAAC
0.39
inframe insertion
HIST1H1D, HIST1H2APS3
chr6
26,235,122
186
G
A
0.39
missense variant, downstream gene variant
AKAP12
chr6
151,674,121
585
A
AGGA
0.41
inframe insertion
SPEN
chr1
16,202,753
20
G
A
0.45
missense variant
NCOR2
chr12
124,812,039
117
G
T
0.47
missense variant
EP400
chr12
132,554,157
32
G
A
0.59
missense variant
ZNF687
chr1
151,259,035
5
G
C
0.60
missense variant, upstream gene variant
NOTCH1
chr9
139,393,579
38
C
T
0.63
missense variant
HMGA1, C6orf1
chr6
34,211,292
59
A
AA
0.78
frameshift variant, feature elongation, downstream gene variant
WHSC1L1
chr8
38,148,080
20
C
T
0.85
missense variant
KIF5B
chr10
32,311,775
7
C
G
1.00
splice donor variant
PPP2R1B
chr11
111,631,542
2
C
T
1.00
splice donor variant
RELN
chr7
103,230,181
2
T
C
1.00
missense variant
AKAP9
chr7
91,652,181
18
C
CAAC
0.39
inframe insertion
HIST1H1D, HIST1H2APS3
chr6
26,235,122
186
G
A
0.39
missense variant, downstream gene variant
Chr chromosome, Ref reference nucleic acid, Alt altered nucleic acid, Alt Freq frequency alteration
da Silva et al. BMC Cancer (2017) 17:756
cultivated in vitro for a limited period, only a minority of
the primary cell cultures may become cell lines [14].
Spontaneous immortalization of primary cultures of malignant cells is an event occurring at a very low frequency.
As an example, O’Donnell et al. [11] reported the occurrence of only one spontaneous immortalization among
156 primary cultures generated from epithelial ovarian
neoplasia, while all the other cultures entered senescence between the 2nd and 8th in vitro passages. The
spontaneous immortalization of primary cultures is frequently assigned to the genetic instability of malignant
cells and accumulation of genomic alterations, such as
the gain or loss of genomic sequences, during in vitro
culturing. However, this is a poorly understood and little documented phenomenon. Additionally, these genomic alterations can affect cell lines, driving them away
from the cognate tumor profile and, thus, limiting their
usefulness as experimental models.
Genomic alterations in low-grade serous ovarian
carcinomas have been described as intermediate between
borderline and high-grade serous ovarian carcinomas
[22–24]. However, CNVs can be remarkably heterogeneous either in number or in their genomic location,
among different low-grade tumors [25]. Although our
results showed that CAISMOV24 cell line had arisen
alongside the accumulation of genomic alterations, most
of them were related to CNVs already present in the
primary malignant cells. Additionally, some of these
CNVs were reported to be shared by low-grade serous
ovarian carcinomas. Thus, among the genomic alterations detected in the CAISMOV24 cell line and its
primary malignant cells, copy number gains in chromosomes 8, 12 and 20 were mentioned by Fernandez et al.
[25] as commonly detected in low-grade serous carcinoma cell lines. Similarly, chromosome 4 was among
those that did not harbor genomic alterations.
Our results showed that few CNVs were found exclusively in the cell line or in its primary malignant cells.
Particularly, hemizygous deletion at ch9p21.3 was observed predominantly in primary malignant cells, but
not in CAISMOV24 cells. This observation supported
the low-grade origin of our primary cells, since hemizygous or homozygous deletions at ch9p21.3 have been
reported as one of the most frequent copy number loss
observed in low-grade serous ovarian carcinomas [22, 25].
However, the absence of this CNV in CAISMOV24
cells suggests that cell line could have emerged from
specific cell clones of the primary malignant cells.
Similarly, Lee et al. [26] showed that peritoneal metastasis
arises from cellular clones with little accumulation of
CNV in relation to its primary tumor in patients with
high-grade serous ovarian cancer. Taken together, these
observations suggest that similar mechanisms could be
operating in vivo and in vitro systems. Thus, CAISMOV24
Page 10 of 12
cell line shall have evolved from a process involving both,
expansion of specific cell clones in addition to the enlargement or loss of altered pre-existing genomic sequences in
primary malignant cells.
Although copy number alterations and gene mutations
are caused by independent processes, it has been
suggested that CNV profiles can be used for a better
characterization among different histotypes of epithelial
ovarian cancer [12], since they could harbor histotypespecific gene mutations. Additionally, CNVs could
encode genes which drive growth [13, 27] and could
alter gene expression or disrupt regulatory mechanisms
leading to phenotypic alterations of the malignant cells
in culture. Typically, low-grade serous ovarian carcinoma
has few somatic mutations, which are mainly found in
genes associated with the mitogen-activated protein kinase
pathway such as KRAS, BRAF and NRAS [23, 25, 28].
KRAS and BRAF mutations are found in a proportion of
low-grade serous carcinomas and, frequently, they are
mutually exclusive. This is in contrast to high-grade serous carcinomas, which mutations include TP53 gene and
rarely KRAS [25, 29]. Accordingly, our results showed that
CAISMOV24 cell line harbors KRAS mutation, which is
relatively frequent in recurrent low-grade serous carcinomas [30]. The transcriptome analyses not only confirmed
CAISMOV24 cell line as a low-grade serous carcinoma, but also revealed several genes with SNPs,
which clinical relevance for development of serous
ovarian carcinomas has being under evaluation. In
this context, HMGA1 over-expression was observed in
epithelial ovarian carcinomas [31], while NOTCH1
has been correlated with ovarian cancer development
and a poor prognosis [32, 33].
In this study, immunophenotyping of the CAISMOV24
cell line was performed in an attempt to characterize the
cells in relation to the expression of surface molecules,
frequently observed in epithelial ovarian carcinomas,
which have also been implicated in the failure of an
immune response against tumors. Thus, the epithelial
origin of CAISMOV24 cells was confirmed by the expression of EpCAM and PVR, two molecules expressed by
ovarian epithelial cells, which are frequently overexpressed in ovarian carcinomas [19, 34, 35]. Additionally,
expression of the HLA-class I molecule was not lost as
a consequence of the malignant transformation of the
ovarian epithelial cells [36, 37]. Our results showed that
CAISMOV24 cells express high levels of TGF-β1 and
CD73, and low levels of CD39, molecules that were
absent or modestly expressed on the primary malignant
cells. All of these molecules have been implicated in
impaired immune response against ovarian carcinomas,
either by direct TGF-β1-mediated effects [9, 38, 39], or
by indirect effects resulting from the breakdown of
ATP into adenosine by CD73, which promotes the
da Silva et al. BMC Cancer (2017) 17:756
immunosuppression of T cytotoxic and NK lymphocytes [9, 37]. Serum biomarkers such as CA125 and
more recently HE4 are important components in the
treatment of women with adnexal masses. HE4 is a glycoprotein with low expression in normal ovarian tissue,
higher in non-ovarian cancer tissue and highest in ovarian
cancer tissue. HE4 as a single tumor marker has been reported to be as good as CA125 for the detection of ovarian cancer. HE4 and CA125 together enhance the
sensitivity and specificity for the diagnosis of ovarian cancer [7, 8]. In this study, the in vitro production of CA125
and HE4 by CAISMOV24 cells was confirmed, stressing
the similarities between the cell line and its primary malignant cells.
Conclusion
In this study, the CAISMOV24 cell line was compared
to its primary malignant cells. Our results corroborate
with the idea that genomic alterations, depicted by
CNVs, can be used for subtyping epithelial ovarian
carcinomas. Additionally, CAISMOV24 cell line was
characterized as a low-grade serous ovarian carcinoma,
which still resembles its primary malignant cells.
Additional files
Additional file 1: Table S1. Primers. Primers used for PCR amplification
prior to Sanger sequencing of KRAS, BRAF and TP53 genes. (DOCX 15 kb)
Page 11 of 12
Funding
This study was supported by grants from São Paulo Research Foundation –
FAPESP. Financial supports numbers 2011/14520–0, 2012/12802–1, 2014/
14777–1, 2016/07822–4 and scholarship 2014/07401–3. Funding agency
did not participate in the design of the study and collection, analysis, and
interpretation of data and in writing the manuscript.
Availability of data and materials
The datasets used and/or analyzed during the current study are available
from the corresponding author on reasonable request.
Authors’ contributions
RFS, SFD, JAY and FG analyzed, interpreted the data and wrote the
manuscript. RFS, DMC, GOLR, CNSA and NAM performed the experiments,
contributing for acquisition of data and their analysis. DMC, GOLR analyzed
and interpreted the comparative genomic hybridization data. SFD analyzed
and interpreted the patient clinical data. LALAA analyzed and interpreted the
patient histopathological data. JAY and FG designed and managed the
study. All authors read and approved the final manuscript.
Authors’ information
JAY and SFD are Fellowship from the Brazilian National Counsel of Technological
and Scientific Development.
Ethics approval and consent to participate
The study was approved by the Research Ethics Committee of University of
Campinas (27 September 2011, 897/2011) and was registered on the Brazilian
National Health Council (CAAE: 0807.0.146.000–11). Patient provided written
informed consent for the use of her blood and ascites samples, and her data.
Consent for publication
A written informed consent for publication of patient’s information was
provided by the patient’s next of kin.
Competing interests
Sophie Françoise Derchain is an editorial board member of BMC Cancer. The
authors declare that they have no competing interests.
Additional file 2: Table S2. LOH ch2p25.3 CAISMOV24. Genotyping of
hemizygous deletions of duplicated chromosome regions (copy neutral
loss of heterozygosity or cnLOH) in chromosome 2 of CAISMOV24 cell
line. (XLSX 5208 kb)
Publisher’s Note
Additional file 3: Table S3. LOH ch16p13.3 primary cells. Genotyping of
hemizygous deletions of duplicated chromosome regions (copy neutral loss
of heterozygosity or cnLOH) in chromosome 16 of primary malignant cells.
(XLSX 1738 kb)
Author details
1
Faculdade de Ciências Médicas, University of Campinas, Campinas, SP, Brazil.
2
Instituto de Biologia, University of Campinas, Campinas, SP, Brazil.
3
Laboratório de Biologia Molecular, Centro Infantil Boldrini, Campinas, SP,
Brazil. 4Women’s Hospital “Professor Doutor José Aristodemo Pinotti” –
CAISM, University of Campinas, Rua Alexander Fleming 101, Campinas, SP
13083-881, Brazil.
Additional file 4: Table S4. LOH ch16p13.3 CAISMOV24. Genotyping of
hemizygous deletions of duplicated chromosome regions (copy neutral
loss of heterozygosity or cnLOH) in chromosome 16 of CAISMOV24 cell
line. (XLSX 1750 kb)
Springer Nature remains neutral with regard to jurisdictional claims in
published maps and institutional affiliations.
Received: 26 January 2017 Accepted: 30 October 2017
Additional file 5:Table S5. CAISMOV24 PanCancer transcriptome.
Transcriptome data of CAISMOV24 cell line. (XLSX 531 kb)
Abbreviations
ATP: Adenosine triphosphate; CA125: Cancer antigen 125; CCLE: Cancer Cell
Line Encyclopedia; CD: Cluster of differentiation; cnLOH: Copy neutral loss of
heterozygosity; CNV: Copy number variation; COSMIC: Catalogue of Somatic
Mutations in Cancer; DNAM-1: DNAX accessory molecule-1; EDTA: Ethylenediamine
tetraacetic acid; EOC: Epithelial ovarian cancer; EpCAM: Epithelial cell
adhesion molecule; FACS: Fluorescence-activated cell sorting; FBS: Fetal
bovine serum; FSC: Forward scatter; HE4: Human epididymis protein 4;
Mab: Monoclonal antibody; PVR: Poliovirus receptor; SNP: Single nucleotide
polymorphism; SSC: Side scatter; VPD450: Violet proliferation dye 450
Acknowledgements
Authors are thankful to Ana Luiza Ongaro Seidinger Conte for preforming
Sanger polymorphism screening, and the team of LCE-CAISM for technical
support for the karyotyping, and CA125 and HE4 determinations.
References
1. Naora H, Montell DJ. Ovarian cancer metastasis: integrating insights from
disparate model organisms. Nat Rev Cancer. 2005;5(5):355–66.
2. Siegel RL, Miller KD, Jemal A. Cancer statistics, 2015. CA Cancer J Clin.
2015;65(1):5–29.
3. Bowtell DD. The genesis and evolution of high-grade serous ovarian cancer.
Nat Rev Cancer. 2011;10(11):803–8.
4. Vaughan S, Coward JI, Bast Jr RC, Berchuck A, Berek JS, Brenton JD, et al.
Rethinking ovarian cancer: recommendations for improving outcomes. Nat
Rev Cancer. 2011;11:719–25. doi: 10.1038/nrc3144.
5. Vargas AN. Natural history of ovarian cancer. Cancer Science &Therapy.
2014;6:247–52.
6. Seidman JD, Horkayne-Szakaly I, Haiba M, Boice CR, Kurman RJ, Ronnett BM.
The histologic type and stage distribution of ovarian carcinomas of surface
epithelial origin. Int J Gynecol Pathol. 2004;23(1):41–4.
7. Galgano MT, Hampton GM, Frierson HF Jr. Comprehensive analysis of
HE4 expression in normal and malignant human tissues. Mod Pathol.
2006;19(6):847–53.
da Silva et al. BMC Cancer (2017) 17:756
8.
9.
10.
11.
12.
13.
14.
15.
16.
17.
18.
19.
20.
21.
22.
23.
24.
25.
26.
27.
Pitta DR, Sarian LO, Barreta A, Campos EA, Andrade LL, Fachini AM, et al.
Symptoms, CA125 and HE4 for the preoperative prediction of ovarian
malignancy in Brazilian women with ovarian masses. BMC Cancer. 2013;13:423.
doi: 10.1186/1471-2407-13-423.
Häusler SF, Montalbán del Barrio I, Strohschein J, Chandran PA, Engel JB,
Hönig A, et al. Ectonucleotidases CD39 and CD73 on OvCA cells are potent
adenosine generating enzymes responsible for adenosine receptor 2Adependent suppression of T cell function and NK cell cytotoxicity. Cancer
Immunol Immunother. 2011;60(10):1405–18.
Patriarca C, Macchi RM, Marschner AK, Mellstedt H. Epithelial cell adhesion
molecule expression. (CD326) in cancer: a short review. Cancer Treat Rev.
2012;38:68–75.
O'Donnell RL, McCormick A, Mukhopadhyay A, Woodhouse LC, Moat M,
Grundy A, et al. The use of ovarian cancer cells from patients undergoing
surgery to generate primary cultures capable of undergoing functional
analysis. PLoS One. 2014;9(6):e90604.
Huang RY, Chen GB, Matsumura N, Lai HC, Mori S, Li J, Wong MK, Konishi I,
Thiery JP, Goh LBMC. Histotype-specific copy-number alterations in ovarian
cancer. Med Genomics. 2012;5:47. doi: 10.1186/1755-8794-5-47.
Zhang D, Chen P, Zheng CH, Xia J. Identification of recurrent focal copy
number variations and their putative targeted driver genes in ovarian
cancer. BMC Bioinformatics Oncotarget. 2016;7(4):4298–309.
Thériault BL, Portelance L, Mes-Masson AM, Nachtigal MW. Establishment of
primary cultures from ovarian tumor tissue and ascites fluid. In: Malek A,
Tchernitsa O, editors. Ovarian cancer: methods and protocols, methods in
molecular biology. Secaucus: Springer; 2013. p. 323–36.
Chen J, Wang J, Zhang Y, Chen D, Yang C, Kai C, Wang X, Shi F, Dou J.
Observation of ovarian cancer stem cell behavior and investigation of
potential mechanisms of drug resistance in three-dimensional cell culture. J
Biosci Bioeng. 2014;118(2):214–22.
Giri S, Rattan R, Deshpande M, Maguire JL, Johnson Z, Graham RP, Shridhar
V. Preclinical therapeutic potential of a nitrosylating agent in the treatment
of ovarian cancer. PLoS One. 2014;9(6):e97897.
Jacob F, Nixdorf S, Hacker NF, Heinzelmann-Schwarz VA. Reliable in vitro
studies require appropriate ovarian cancer cell lines. J Ovarian Res. 2014;7:
60. doi: 10.1186/1757-2215-7-60.
Barretina J, Caponigro G, Stransky N, Venkatesan K, Margolin AA, Wilson CJ,
et al. The cancer cell line encyclopedia enables predictive modeling of
anticancer drug sensitivity. Nature. 2012;483(7391):603–7.
Domcke S, Sinha R, Levine DA, Sander C, Schults N. Evaluating cell lines as
tumor models by comparison of genomic profiles. Nat Commun. 2013;4:
2126–36. doi: 10.1038/ncomms3126.
Sugimoto T, Gotoh T, Yagyu S, Kuroda H, Iehara T, Hosoi H, Ohta S, Ohira M,
Nakagawara A. A MYCN-amplified cell line derived from a long-term event-free
survivor among our sixteen established neuroblastoma cell lines. Cancer Lett.
2013;331:115–21.
Arcila M, Lau C, Nafa K, Ladanyi M. Detection of KRAS and BRAF mutations
in colorectal carcinoma roles for high-sensitivity locked nucleic acid-PCR
sequencing and broad-spectrum mass spectrometry genotyping. J Mol
Diagn. 2011;13(1):64–73.
Kuo KT, Guan B, Feng B, MaoTL CX, Jinawath N, Wang Y, Kurman RJ,
Shih IM, Wanf TL. Analysis of DNA copy number alterations in ovarian
serous tumors identifies new molecular genetic changes in low-grade
and high-grade carcinomas. Cancer Res. 2009;69(9):40364042.
doi: 10.1158/0008-5472.CAN-08-3913.
Boyd J, Luo B, Peri S, Wirchansky B, Hughes L, Forsythe C, Wu H. Whole
exome sequence analysis of serous borderline tumors. Gynecologic Oncol.
2013;130:560–4.
Hunter SM, Anglesio MS, Ryland GL, et al. Molecular profiling of low grade
serous ovarian tumours identifies novel candidate driver genes. Oncotarget.
2015;6:37663–77.
Fernández ML, DiMattia GE, Dawson A, Bamford S, Anderson S, Hennessy BT,
Anglesio MS, Shepherd TG, Salamanca C, Hoenisch J, Tinker A, Huntsman DG,
Carey MS. Differences in MEK inhibitor efficacy in molecularly characterized
low-grade serous ovarian cancer cell lines. Am J Cancer. 2016;6:2235–51.
Lee JY, Yoon JK, Kim B, Kim S, Kim MA, Lim H, et al. Tumor evolution and
intratumor heterogeneity of an epithelial ovarian cancer investigated using nextgeneration sequencing. BMC Cancer. 2015;15:85. doi: 10.1186/s12885-015-1077-4.
Freeman JL, Perry GH, Feuk L, Redon R, McCarroll SA, Altshuler DM, et al.
Copy number variation: new insights in genome diversity. Genome Res.
2006;16(8):949–61.
Page 12 of 12
28. Emmanuel C, Chiew YE, George J, Etemadmoghadam D, Anglesio MS,
Sharma R, Russell P, Kennedy C, Fereday S, Hung J, Galletta L, Hogg R, Wain
GV, Brand A, Balleine R, MacConaill L, Palescandolo E, Hunter SM, Campbell
I, Dobrovic A, Wong SQ, Do H, Clarke CL, Harnett PR, Bowtell DDL, DeFazio
A. Genomic classification of serous ovarian cancer with adjacent borderline
differentiates RAS pathway and TP53-mutant tumors and identifies NRAS as
an oncogenic driver. Clin Cancer Res. 2014;20:6618–30.
29. McIntyre JB, Rambau PF, Chan A, Yap S, Morris D, Nelson GS, Köbel M.
Molecular alterations in indolent, aggressive and recurrent ovarian lowgrade serous carcinoma. Histopathology. 2017;70:347–58.
doi: 10.1111/his.13071.
30. Della Pepa C, Tonini G, Santini D, Losito S, Pisano C, Di Napoli M, Cecere SC,
Gargiulo P, Pignata S. Low grade serous ovarian carcinoma: from the
molecular characterization to the best therapeutic strategy. Cancer Treat
Rev. 2015;41:136–43.
31. Masciullo V, Baldassarre G, Pentimalli F, Berlingieri MT, Boccia A, Chiappetta
G, Palazzo J, Manfioletti G, Giancotti V, Viglietto G, Scambia G, Fusco A.
HMGA1 protein over-expression is a frequent feature of epithelial ovarian
carcinomas. Carcinogenesis. 2003;24:1191–8. doi: 10.1093/carcin/bgg075.
32. Wang M, Wang J, Wang L, Wu L, Xin X. Notch1 expression correlates with
tumor differentiation status in ovarian carcinoma. Med Oncol. 2010;27:1329–35.
doi: 10.1007/s12032-009-9384-8.
33. Alniaimi AN, Demorest-Hayes K, Alexander VM, Seo S, Yang D, Rose S.
Increased Notch1 expression is associated with poor overall survival in
patients with ovarian cancer. Int J Gynecol Cancer. 2015;25:208–13.
doi: 10.1097/IGC.0000000000000359.
34. Carlsten M, Björkström NK, Norell H, Bryceson Y, van Hall T, Baumann BC, et al.
DNAX accessory molecule-1 mediated recognition of freshly isolated ovarian
carcinoma by resting natural killer cells. Cancer Res. 2007;67(3):1317–25.
35. da Silva RF, Petta CA, Derchain SF, Alici E, Guimarães F. Up-regulation of
DNAM-1 and NKp30, associated with improvement of NK cells activation
after long-term culture of mononuclear cells from patients with ovarian
neoplasia. Hum Immunol. 2014;75(8):777–84.
36. Schanoski AS, Cavalcanti TC, Campos CBL, Vieira-Matos AN, Rettori O,
Guimarães F. Walker 256 tumor MHC class I expression during the shift a
variant to the immunogenic AR variant. Cancer Lett. 2004;211(1):119–27.
37. Hirohashi Y, Torigoe T, Mariya T, Kochin V, Saito T, Sato N. HLA class I as a
predictor of clinical prognosis and CTL infiltration as a predictor of
chemosensitivity in ovarian cancer. Oncoimmunology. 2015;4(5):e1005507.
doi: 10.1080/2162402X.2015.1005507.
38. Ghiringhelli F, Ménard C, Terme M, Flament C, Taieb J, Chaput N, et al. CD4
+CD25+ regulatory T cells inhibit natural killer cell functions in a transforming
growth factor-B-dependent manner. J Exp Med. 2005;202(8):1075–85.
39. Young A, Mittal D, Stagg J, Smyth MJ. Targeting cancer-derived adenosine:
new therapeutic approaches. Cancer Discov. 2014;4(8):879–88.
Submit your next manuscript to BioMed Central
and we will help you at every step:
• We accept pre-submission inquiries
• Our selector tool helps you to find the most relevant journal
• We provide round the clock customer support
• Convenient online submission
• Thorough peer review
• Inclusion in PubMed and all major indexing services
• Maximum visibility for your research
Submit your manuscript at
www.biomedcentral.com/submit