Nomograms that predict the survival of patients with adenocarcinoma in villous adenoma of the colorectum: A SEER-based study
Bạn đang xem bản rút gọn của tài liệu. Xem và tải ngay bản đầy đủ của tài liệu tại đây (1.22 MB, 12 trang )
Tang et al. BMC Cancer
(2020) 20:608
/>
RESEARCH ARTICLE
Open Access
Nomograms that predict the survival of
patients with adenocarcinoma in villous
adenoma of the colorectum: a SEER-based
study
Chao-Tao Tang†, Ling Zeng†, Jing Yang†, Chunyan Zeng and Youxiang Chen*
Abstract
Background: Considering that the knowledge of adenocarcinoma in villous adenoma of the colorectum is limited
to several case reports, we designed a study to investigate independent prognostic factors and developed
nomograms for predicting the survival of patients.
Methods: Univariate and multivariate Cox regression analyses were used to evaluate prognostic factors. A nomogram
predicting cancer-specific survival (CSS) was performed; internally and externally validated; evaluated by receiver
operating characteristic (ROC) curve, C-index, and decision curve analyses; and compared to the 7th TNM stage.
Results: Patients with adenocarcinoma in villous adenoma of the colorectum had a 1-year overall survival (OS) rate of
88.3% (95% CI: 87.1–89.5%), a 3-year OS rate of 75.1% (95% CI: 73.3–77%) and a 5-year OS rate of 64.5% (95% CI: 62–
67.1%). Nomograms for 1-, 3- and 5-year CSS predictions were constructed and performed better with a higher C-index
than the 7th TNM staging (internal: 0.716 vs 0.663; P < 0.001; external: 0.713 vs 0.647; P < 0.001). Additionally, the
nomogram showed good agreement between internal and external validation. According to DCA analysis, compared
to the 7th TNM stage, the nomogram showed a greater benefit across the period of follow-up regardless of the
internal cohort or external cohort.
Conclusion: Age, race, T stage, pathologic grade, N stage, tumor size and M stage were prognostic factors for both OS
and CSS. The constructed nomograms were more effective and accurate for predicting the 1-, 3- and 5-year CSS of
patients with adenocarcinoma in villous adenoma than 7th TNM staging.
Keywords: Adenocarcinoma in villous adenoma, Colorectum, Nomogram, Survival, SEER
Background
According to global cancer statistics in 2018, colorectal
cancer (CRC) is the third most common cancer, with 97,
220 new cases of colon cancer and 43,030 new cases of
rectal cancer worldwide [1]. There are three pathways involved in the pathogenesis of sporadic CRC: the classic
* Correspondence:
†
Chao-Tao Tang, Ling Zeng and Jing Yang contributed equally to this work.
Department of Gastroenterology, the First Affiliated Hospital of Nanchang
University, 17 Yongwaizheng Street, Nanchang 330006, Jiangxi, China
colorectal adenoma (CRA)-adenocarcinoma pathway, the
de novo pathway and the inflammatory cancer pathway.
Among these pathways, the adenoma-adenocarcinoma
pathway is the most common mechanism for the development of CRC [2]. Adenomatous polyps account for approximately 60–70% of all colonic polyps and are divided
into tubular adenomas, villous/tubulovillous adenomas
(VA/TVAs), sessile serrated adenomas (SSAs) and traditional serrated adenomas (TSAs), while TSAs are often
admixed with SSA and VA/TVA [3]. The pathological
© The Author(s). 2020 Open Access This article is licensed under a Creative Commons Attribution 4.0 International License,
which permits use, sharing, adaptation, distribution and reproduction in any medium or format, as long as you give
appropriate credit to the original author(s) and the source, provide a link to the Creative Commons licence, and indicate if
changes were made. The images or other third party material in this article are included in the article's Creative Commons
licence, unless indicated otherwise in a credit line to the material. If material is not included in the article's Creative Commons
licence and your intended use is not permitted by statutory regulation or exceeds the permitted use, you will need to obtain
permission directly from the copyright holder. To view a copy of this licence, visit />The Creative Commons Public Domain Dedication waiver ( applies to the
data made available in this article, unless otherwise stated in a credit line to the data.
Tang et al. BMC Cancer
(2020) 20:608
characteristic of villous adenoma is more than 75% of villous features with or without epithelial projections. According to previous studies, compared with other
adenomas, adenomas with villous features have been considered a risk factor associated with an increased probability of developing into a more advanced neoplasia or
dysplasia lesion [4]. Moreover, the size of the adenoma
and the number of adenomas increase the risk of advanced development [5]. The results of a multicenter cohort study suggested that adenomas of more than 2 cm in
diameter and with high-grade dysplasia were highly correlated with the development of CRC (HR: 9.25, 95% CI,
6.39–13.39) [6]. Although mounting evidence has suggested that villous adenoma is correlated with adenocarcinoma, current knowledge of the survival rate of patients
with adenocarcinoma in villous adenoma is limited to a
small series of studies [7–11]. The first report was that a
19-year-old male had carcinoma arising from a villous adenoma [12]. According to a recent case report, a 71-yearold female patient with intramucosal adenocarcinoma in
villous adenoma recurred after 19 months in the ulcer scar
site because of the careless pathological examination.
After post-endoscopic submucosal dissection (ESD), there
were no recurrent signs during 9 years of follow-up [10].
Hence, identifying prognostic factors for patients with
adenocarcinoma in villous adenoma is a vital part of the
assessment and therapy of CRC.
The Surveillance, Epidemiology, and End Results
(SEER) program contains detailed research data on many
kinds of tumors that cover almost 30% of the population
in the United States [13]. Additionally, nomograms are
widely used to assess the prognosis of cancers because of
their ability to transform a statistical predictive model
into a single numerical estimate of the probability of an
event, which is a user-friendly method that guides clinical decision-making for doctors [14]. Therefore, in our
study, we utilized a nomogram to analyze the impact of
clinical characteristics such as TNM stage and tumor
size on the survival rate of patients with adenocarcinoma
in villous adenoma using the SEER database.
Methods
Data source
A total of 970,163 patients with CRC were identified
from 2004 to 2015. All data were extracted from the
SEER database of the United States, which covers abundant information on cancers. SEER*Stat software (version 8.3.6, downloaded from />seerstat/) was used to extract patient information from
the SEER database.
Population selection
To acquire the necessary information from the databanks, we established criteria to exclude some useless
Page 2 of 12
data. As shown in Fig. 1, we carefully reviewed the patient information. The inclusion criteria were as follows:
(1) positive pathological diagnosis; (2) sufficient information about survival; and (3) available follow-up data. The
exclusion criteria were as follows: (1) pathological diagnosis not adenocarcinoma in villous adenoma (ICD-O-3
Hist/behav, malignant: 8261/3); (2) no detailed information about the specific cause of death or other cause of
death; (3) no information on AJCC TNM status; (4) unknown race of patient; and (5) no record of tumor number and pathological grade. The missing value were
listed in the Supplementary Table 1.
Study variables
Several variables were extracted from the SEER database,
including age, race, sex, T stage, N stage, M stage,
pathological grade of the tumor, number of tumors and
tumor size. Patients were divided by age into < 50 years,
50–59 years, 60–69 years and > =70 years. Race was classified as black, white, and other. Pathological grade was
categorized as well differentiated (grade I), moderately
differentiated (grade II), poorly differentiated (grade III),
and undifferentiated (anaplastic, grade IV). The T stage
was divided into Tis, T1, T2, T3, T4 and TX. The N
stage was described as N0 (No), N1 (Yes), N2 (Yes) and
NX. For M stage, M0 indicated negative metastasis,
while M1 indicated positive metastasis. Tumor size was
separated into < 5 cm, > = 5 cm and unknown. The number of tumors was divided into two groups: 1 tumor or
more than 1 tumor.
Statistical analysis
As described in the previous section, the demographic
characteristics and clinicopathological information of the
patients are summarized in Table 1. Differences in the
baseline characteristics between patients who died from
cancer and patients who died from other causes were
assessed by the chi-square test. Overall survival (OS)
and cancer-specific survival (CSS) were regarded as the
primary indexes of our study. The potential factors associated with OS and CSS were analyzed by univariate and
multivariate Cox regression analyses. Survival curves
were obtained by the K-M method and stratified by the
clinicopathological index. To perform the nomogram,
first, we performed the multivariate Cox regression analysis by the “coxph” function in the “survival” package;
after that, we performed the “step” function to determine the value of the Akaike Information Criterion
(AIC), which is a well-known method for selecting variables; according to the AIC value, we determined the
variables to build the nomogram; finally, we used the
“plot” function and “nom” function in the “rms” packages to construct the nomogram model. The survival
curves, ROC curves, C-index and calibration curves were
Tang et al. BMC Cancer
(2020) 20:608
Page 3 of 12
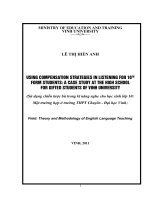
Fig. 1 OS curves for the patients
calculated using the “rms”, “foreign” and “survival” packages in R software (Version 3.5.0). A competing-risk
model was established via the “cmprsk” package. All
packages used in our manuscript were obtained from
the website ( All results were
considered to be statistically significant when the P value
was less than 0.05.
Results
Patient characteristics
As depicted in Supplementary Figure 1, according to the
criteria set at the beginning of our study, we finally extracted 2813 patients who were diagnosed with adenocarcinoma in villous adenoma by histopathology from
the SEER database. Table 1 lists the basic information
regarding the demographic and clinical characteristics of
the patients with adenocarcinoma in villous adenoma.
As shown in Table 1, of the 2813 patients, 666 died from
different causes, including carcinoma and other causes.
Among these patients, 398 patients died from adenocarcinoma, and 268 patients died due to other causes. In
the whole cohort, the six variables of age, grade, tumor
size, T stage, N stage and metastasis had statistical significance in the cases of death attributed to adenocarcinoma and other causes, while no significant differences
were observed for race, sex or tumor number.
Survival analysis
As shown in Fig. 1 and Table 2, overall, the patients had
a 1-year OS of 88.3% (95% CI: 87.1–89.5%), 3-year OS of
75.1% (95% CI: 73.3–77%) and 5-year OS of 64.5% (95%
CI: 62–67.1%). As shown in Table 2, some characteristics, such as age, TNM stage and pathological grade,
suggested that advanced tumors highly affected survival,
while we also found that the size and number of tumors
had an effect on the prognosis of patients. The larger the
tumor and the greater the number of tumors, the shorter
the survival time is. In line with the results shown in
Table 2, the analysis of OS by Kaplan-Meier plots revealed that age, race, pathological grade, N stage, T
stage, metastasis, tumor size and tumor number were
prognostic factors (Supplementary Figures 2, 3 and 4).
Tang et al. BMC Cancer
(2020) 20:608
Page 4 of 12
Table 1 Patients’ demographics, clinical characteristics at diagnosis
Variables
Total (%)
Cause-specific Death (%)
Death due to other causes (%)
n
2813
398
268
Age
P Value
< 0.0001
< 50
309 (10.98%)
32 (8.04%)
4 (1.49%)
50–59
643 (22.86%)
64 (16.08%)
24 (8.96%)
60–69
711 (25.28%)
96 (24.12%)
39 (14.55%)
≥ 70
1150 (40.88%)
206 (51.76%)
201 (75%)
White
2265 (80.52%)
319 (80.15%)
222 (82.84%)
Black
318 (11.3%)
59 (14.82%)
30 (11.19%)
Other
230 (8.18%)
20 (5.03%)
16 (5.97%)
Male
1466 (52.12%)
210 (52.76%)
143 (53.36%)
Female
1347 (47.88%)
188 (47.24%)
125 (46.64%)
Race
0.375
Sex
0.8802
Pathology Grade
0.013
I
492 (17.49%)
49 (12.31%)
38 (14.18%)
II
2037 (72.41%)
273 (68.59%)
203 (75.75%)
III
220 (7.82%)
58 (14.57%)
23 (8.58%)
IV
64 (2.28%)
18 (4.52%)
4 (1.49%)
NO
1993 (70.85%)
195 (48.99%)
202 (75.37%)
Yes
758 (26.95%)
181 (45.48%)
55 (20.52%)
NX
62 (2.2%)
22 (5.53%)
11 (4.1%)
No
2559 (90.97%)
242 (60.8%)
251 (93.66%)
Yes
254 (9.03%)
156 (39.2%)
17 (6.34%)
Lymph node metastasis
< 0.0001
Metastasis
< 0.0001
Tumor size
< 0.0001
≤ 5 cm
1596 (56.74%)
156 (39.2%)
148 (55.22%)
> 5 cm
680 (24.17%)
157 (39.45%)
57 (21.27%)
Unknow
537 (19.09%)
85 (21.36%)
63 (23.51%)
Tumor number
0.11
1
2557 (90.9%)
350 (87.94%)
224 (83.58%)
>1
256 (9.1%)
48 (12.06%)
44 (16.42%)
Tis
146 (5.19%)
3 (0.75%)
11 (4.10%)
T1
904 (32.14%)
58 (14.57%)
92 (34.33%)
T2
521 (18.52%)
53 (13.32%)
56 (20.90%)
T3
921 (32.74%)
159 (39.95%)
85 (31.72)
T4
244 (22.86%)
91 (22.86%)
9 (3.36%)
Tx
77 (2.74%)
34 (8.54%)
15 (5.6%)
T stage
< 0.0001
Subsequently, we performed univariate and multivariate
Cox regression analyses for OS and CSS (Tables 3 and 4).
With regard to OS, in multivariate analysis, age, race, T
stage, metastasis, tumor size and tumor number were
identified as prognostic factors. For example, compared to
patients more than 70 years old, patients who were less
than 50 years old were obviously associated with a lower
mortality risk (HR: 0.175, 95% CI: 0.123–0.249). Black
race, advanced T stage and M stage, larger tumor number
and tumor size were also hazardous factors for survival.
Tang et al. BMC Cancer
(2020) 20:608
Page 5 of 12
Table 2 1-, 3- and 5-year survival of OS among patients according to different hierarchical analysis
Variables
1-year (%) (95% CI)
3-year (%) (95% CI)
5-year (%) (95% CI)
log-rank test
All patients
88.3%(87.1–89.5%)
75.1%(73.3–77%)
64.5% (62–67.1%)
–
P < 0.0001
Age
< 50
96.2% (94–98.6%)
86.3% (81.8–91.1%)
80.8% (74.6–87.5%)
50–59
93.5% (91.5–95.5%)
85.6% (82.4–88.9%)
77.5% (72.9–82.4%)
60–69
92.8% (90.9–94.8%)
78.4% (4.8–82.2%)
71.5% (67–76.2%)
≥ 70
80.4% (78.1–82.9%)
64.4% (61.3–67.6%)
48.6% (44.5–53.6%)
White
88.4% (87–89.8%)
75% (73–77.1%)
63.9% (61–66.8%)
Black
86% (82.2–90%)
71.4% (66–77.3%)
60.8% (54–68.6%)
Other
90.8% (86.8–94.8%)
81.7% (75.9–88.1%)
74.2% (65.1–84.5%)
Male
88.6% (87–90.4%)
73.8% (71.2–76.5%)
63.1% (59.6–66.9%
Female
87.9% (86.1–89.7%)
76.4%(73.9–79.1%)
65.9%(62.3–69.6%)
P = 0.02
Race
P = 0.3
Sex
P < 0.0001
Pathology Grade
I
90.6% (88–93.4%)
82.4%(78.6–86.4%)
72.1%(66.3–78.5%)
II
89.3% (88.7–91.4%)
75.2%(73.9–78.2%)
64.1%(61.2–67.3%)
III
77.5% (72.1–83.4%)
62.1%(54.9–68.5%)
53.4%(43.9–62.4%)
IV
77.5%(67.4–89.2%)
58.1%(45.5–74.5%)
–
No
90.8%(89.5–92.2%)
79.5% (77.4–81.6%)
69% (66.1–72.1%)
Yes
80.7% (75.3–86.5%)
52.6% (37.6–55%)
31.3% (22.4–43.7%)
Unknown
60.7% (47.2–73.1%)
43.9 (32.24%-59,8%)
35.1% (20.5–60.1%)
No
91.3% (90.1–92.4%)
80.4% (78.7–82.3%)
69.7% (67.1–72.4%)
Yes
58.7% (52.7–65.4%)
22.5% (17.2–29.5%)
13.3% (8.15–21.6%)
≤ 5 cm
91.6% (90.1–93.1%)
81.6% (78.8–83.6%)
70.7% (67.2–74.4%)
> 5 cm
85.1% (82.5–87.7%)
65% (61.1–69%)
53.8% (49–58.9%)
Unknow
84.3% (81.1–87.5%)
72.5% (67–75.7%)
62.4% (57.2–68.1%)
P < 0.0001
N Stage
P < 0.0001
Metastasis
Tumor size
P < 0.0001
P = 0.004
Tumor number
1
88.3% (87–89.6%)
76.2% (74.2–78.1%)
65.5% (62.8–68.3%)
>1
88.7% (84.8–92.7%)
67.2% (61.3–73.8%)
56.5% (49.6–64.4%)
Tis
91% (87.3–96.6%)
79.9% (72.5–88.1%)
–
T1
89.2%(87.1–91.3%)
78.5% (75.5–81.7%)
65.8% (61.3–70.7%)
T2
88.1% (85.3–91.1%)
75.7% (71.6–80%)
64.3% (59.1–71.1%)
T3
89.6% (87.6–91.7%)
75% (72.1–78.7%)
66% (61.9–70.5%)
T4
82.1% (77.2–87.3%)
62.5%(55.6–70.3%)
55.1% (46.5–65.3%)
Tx
75.4% (65.8–86.4%)
56% (44.9–72.6%)
–
T stage
For CSS, multivariate analyses revealed that some variables, including age, race, T stage, pathological grade,
N stage, tumor size and metastasis, remained prognostic factors. Furthermore, based on the competing-
P < 0.0001
risk model, the CSS curves showed that age, race, T
stage, pathological grade, N stage, tumor size and M
stage were potential prognostic factors (Supplementary Figures 5, 6 and 7).
Tang et al. BMC Cancer
(2020) 20:608
Page 6 of 12
Table 3 Univariate analysis and Multivariate analysis of variables for OS in patients
Variables
Univariate analysis
Multivariate Analysis
HR (95%CI)
P value
HR (95%CI)
P value
Age
< 50
0.282(0.201–0.397)
0.000
0.175(0.123–0.249)
0.000
50–59
0.335(0.266–0.422)
0.000
0.281(0.222–0.355)
0.000
60–69
0.48(0.395–0.583)
0.000
0.376(0.307–0.459)
0.000
≥ 70
Reference
–
Reference
–
0.585(0.397–0.861)
0.007
0.524(0.355–0.774)
0.001
Race
Other
White
0.865(0.691–1.083)
0.205
0.794(0.633–0.995)
0.045
Black
Reference
–
Reference
–
Male
1.08(0.927–1.257)
0..323
–
–
Female
Reference
–
–
–
I
0.416(0.261–0.664)
0.000
0.758(0.47–1.223)
0.256
II
0.573(0.374–0.880)
0.011
0.943(0.61–1.456)
0.789
Sex
Pathology Grade
III
0.980(0.612–1.57)
0.932
1.428(0.887–2.3)
0.142
IV
Reference
–
Reference
–
0.7(0.579–0.846)
0.000
0.887(0.717–1.072)
0.199
Yes
Reference
–
Reference
–
Unknown
2.0(1.574–2.543)
0.000
1.688(1.305–2.133)
0.000
No
0.161(0.135–0.192)
0.000
0.17(0.138–0.208)
0.000
Yes
Reference
–
Reference
N stage
No
Metastasis
Tumor size
0.000
–
0.000
≤ 5 cm
0.518(0.436–0.615)
0.000
0.731(0.608–0.879)
0.001
> 5 cm
Reference
–
Reference
–
Unknow
0.787(0.643–0.964)
0.021
1.081(0.872–1.338)
0.478
Tumor number
1
0.725(0.582–0.904)
0.004
0.76(0.609–0.950)
0.016
>1
Reference
–
Reference
–
0.511(0.332–0.787)
0.002
0.624(0.402–0.968)
0.035
T stage
Tis
T1
0.573(0.441–0.746)
0.000
0.782(0.596–1.028)
0.078
T2
0.642(0.484–0.853)
0.002
0.867(0.648–1.160)
0.336
T3
0.622(0.48–0.807
0.000
0.687(0.528–0.894)
0.005
T4
Reference
–
Reference
–
Tx
1.239(0.805–1.908)
0.331
1.442(0.929–2.238)
0.102
Performance of the nomograms
To construct a survival prediction model, we selected
CSS as the main observation and then built a nomogram
plot. As listed in Table 4, patients with age > 70 years,
advanced T stage, distant metastasis, positive LNM and
larger tumor size (> 5 cm) and black patients had worse
prognosis. To build the nomogram, race and tumor size
were not included because the AIC value was obviously
larger when it was added into the nomogram. Therefore,
we established a nomogram based on four other
Tang et al. BMC Cancer
(2020) 20:608
Page 7 of 12
Table 4 Univariate analysis and Multivariate analysis of variables for CSS in patients
Variables
Univariate analysis
HR (95%CI)
Age
Multivariate Analysis
P value
HR (95%CI)
0.000
0.000
< 50
0.5(0.344–0.725)
0.000
0.238(0.161–0.352)
50–59
0.486(0.367–0.643)
0.000
0.373(0.281–0.496)
60–69
0.679(0.533–0.866)
0.002
0.468(0.363–0.602)
≥ 70
Reference
–
Reference
Race
Other
0.019
0.492(0.296–0.817)
0.006
P value
0.000
–
0.024
0.509(0.305–0.849)
0.01
White
0.77(0.583–1.017)
0.066
0.754(0.569–0.998)
0.049
Black
Reference
–
Reference
–
0.535
–
–
0.535
–
–
Sex
Male
1.064(0.874–1.296)
Female
Reference
Pathology Grade
–
0.000
0.001
I
0.291(0.17–0.50)
0.000
0.665(0.381–1.159)
0.15
II
0.406(0.252–0.655)
0.000
0.786(0.483–1.28)
0.333
III
0.867(0.511–1.471)
0.596
1.348(0.788–2.308)
0.276
IV
Reference
–
Reference
–
0.691(0.538–0.888)
0.004
Lymph node
No
0.000
0.468(0.369–0.592)
0.000
Yes
Reference
–
Reference
–
Unknown
2.074(1.574–2.733)
0.000
1.577(1.186–2.098)
0.002
No
0.089(0.072–0.109)
0.000
0.114(0.089–0.146)
0.000
Yes
Reference
–
Reference
–
Metastasis
Tumor size
0.000
0.000
≤ 5 cm
0.365(0.292–0.457)
0.000
0.618(0.486–0.786)
0.000
> 5 cm
Reference
–
Reference
–
Unknow
0.642(0.496–0.831)
0.001
0.993(0.755–1.306)
0.96
Tumor number
1
0.841(0.622–1.138)
0.262
–
–
>1
Reference
–
–
–
T stage
0.000
0.000
Tis
0.28(0.151–0.519)
0.000
0.435(0.232–0.817)
0.01
T1
0.406(0.297–0.555)
0.000
0.702(0.505–0.976)
0.035
T2
0.459(0.326–0.646)
0.000
0.773(0.542–1.104)
0.157
T3
0.478(0.595–1.701)
0.000
0.56(0.41–0.763)
0.000
T4
Reference
–
Reference
–
Tx
1.006(0.595–1.701)
0.981
1.248(0.728–2.139)
0.421
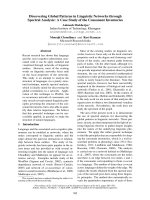
prognostic factors (Fig. 2). According to the nomogram,
we found that T stage contributed the most to the prognosis of AC patients, followed by M stage and age,
whereas positive LNM had the least proportion for predicting survival. To explain the nomogram, a straight
line can be drawn down to each time point to determine
the estimated probability of survival. With respect to
each predictor, we could read the points assigned on the
0–10 scale at the top and then add these points. The
corresponding predictions of 1-, 3-, and 5-year risk are
Tang et al. BMC Cancer
(2020) 20:608
Page 8 of 12
Fig. 2 A nomogram for the prediction of the 1-, 3- and 5-year OS rates of patients with adenocarcinoma in villous adenoma
read last by finding the number on the “Total Points”
scale.
Validation of the nomogram model
To investigate the validity of the nomogram, we divided
the patients into internal and external cohorts according
to the year of diagnosis (2004–2009 group and 2010–
2015 group) and determined the C-index value. As listed
in Table 5, the value of the C-index in the internal cohort was 0.716 (95% CI, 0.684–0.773), which was higher
than the TNM stage value (C-index, 0.663, 95% CI,
0.603–0.734), suggesting that the nomogram was more
effective for predicting survival than TNM stage. In line
with the results of the external cohort, the nomogram
was superior to TNM stage (external cohort, 0.713, 95%
Table 5 Accuracy of the prediction score of the nomogram and
TNM stage for estimating prognosis of patients
Variable
Value (95%CI)
Internal validation
External validation
C index for nomogram
0.716(0.684–0.773)
0.713(0.641–0.794)
C index for TNM stage
0.663(0.603–0.734)
0.647(0.611–0.709)
1 year AUC for nomogram
0.701(0.612–0.751)
0.689(0.625–0.724)
3 year AUC for nomogram
0.771(0.672–0.811)
0.764(0.682–0.817)
5 year AUC for nomogram
0.762(0.673–0.821)
0.771(0.712–0.823)
1 year AUC for TNM stage
0.596(0.537–0.702)
0.643(0.605–0.683)
3 year AUC for TNM stage
0.683(0.601–0.724)
0.714(0.639–0.811)
5 year AUC for TNM stage
0.689(0.634–0.758)
0.703(0.651–0.763)
Tang et al. BMC Cancer
(2020) 20:608
CI, 0.641–0.794; TNM stage, 0.647, 95% CI, 0.611–
0.709). With respect to the specificity and sensitivity
of the nomogram, in the internal cohort, we found
that the AUC values for predicting 1-year, 3-year and
5-year survival by the nomogram were 0.701 (0.612–
0.751), 0.771 (0.672–0.811) and 0.762 (0.673–0.821),
respectively, while the TNM stage values for predicting 1-year, 3-year and 5-year survival were 0.596
(0.537–0.702), 0.683 (0.601–0.724) and 0.689 (0.634–
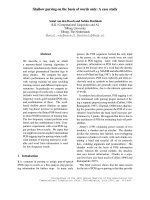
0.758), respectively (Table 5). Compared to the TNM
stage model, the nomogram was better at predicting
prognosis at 1 year, 3 years and 5 years (Fig. 3a-c). As
indicated by the external cohort, the nomogram also
performed better than TNM stage (1-year AUC: 0.689
vs. 0.643, 3-year AUC: 0.764 vs. 0.714, 5-year AUC:
0.771 vs. 0.703, P < 0.001, Table 5 and Fig. 3d-f). Furthermore, to compare the clinical usability between
the nomogram and TNM stage, we performed a DCA
plot. As shown in Fig. 4, in both the internal cohort
and the external cohort, the predictive efficiency of
the nomogram was better than that of TNM stage for
1-year, 3-year and 5-year survival.
Page 9 of 12
Discussion
Colorectal adenomatous polyps are considered the main
reason for the development of advanced lesions. According
to current postpolypectomy surveillance guidelines, patients
who have adenomas with villous elements are considered at
high risk of developing advanced lesions; in addition, the
size of the adenoma (> = 10 mm) would increase the risk
[15]. Although colonoscopy surveillance and resection
could reduce the risk of developing carcinoma, the risk of
CRC after adenoma removal remains high, and the removal
of adenoma does not always prevent CRC because the initial adenoma features are not well known [16, 17]. Even
worse is that the knowledge of adenocarcinoma in villous
adenoma is still limited to case reports and several studies.
According to the current case reports, tumor recurrence
was frequent due to inaccurate pathological diagnoses;
however, the prognosis was good if the lesion was resected
entirely [10]. Moreover, the treatment strategies for adenocarcinoma in villous adenoma differ according to different
clinical behaviors [18]. Hence, it is of clinical significance to
accurately predict the prognosis of patients with adenocarcinoma in villous adenoma.
Fig. 3 ROC curve of the nomogram and 7th TNM stage in predicting the prognosis of patients from 2004 to 2015. a-c ROC curve for the 1-, 3and 5-year points in the 2004–2009 cohort. d-f ROC curve for the 1-, 3- and 5-year points in the 2010–2015 cohort
Tang et al. BMC Cancer
(2020) 20:608
Page 10 of 12
Fig. 4 Decision curve analysis for the nomogram and the 7th TNM stage model in the prediction of patient prognosis. a-c 1-, 3- and 5-year
points in the 2004–2009 cohort. d-f 1-, 3- and 5-year points in the 2010–2015 cohort
In the present study, we analyzed the potential risk
factors associated with colorectal adenocarcinoma in villous adenoma. In total, we determined 2831 patients
who had detailed clinical information and assessed the
clinical value of several characteristics by univariate and
multivariate Cox regression analyses. In line with other
reports [19, 20], black patients with adenocarcinoma in
villous adenoma had a poor prognosis, which was caused
by multiple factors, such as diet, the microbiome composition of the bowel and healthcare access [21, 22].
Similarly, age at diagnosis was an independent risk factor, which is the reason why guidelines recommend
screening for CRC at 50 years old, while sex was not a
prognostic factor in our study. In contrast to the findings of previous studies [19, 23], pathological grade,
which is known as a prognostic factor, was not identified
as an independent prognostic factor for the survival of
patients with adenocarcinoma in villous adenoma.
Additionally, TNM stage is known to be significantly associated with the survival of patients, and we also demonstrated that it could act as an independent predictive
factor. Tumor size greater than 5 cm was considered a
risk factor in our study because large tumors are not
sensitive to chemotherapy and are more easily invasive
[24]. Regarding the number of tumors, we found that it
was an independent risk factor for OS, which is consistent with the findings of a previous report [25]. However,
the number of tumors was not related to CSS, which
suggests that the number of tumors mainly affects the
rate of death due to other causes.
Nomograms have been successfully established to predict the survival of many tumor types and are considered
a more accurate model than the 7th AJCC staging system
[26–28]. To the best of our knowledge, no nomogram has
been established to predict the survival of patients with
adenocarcinoma in villous adenoma. Based on the results
of multivariate analysis, we constructed a nomogram to
evaluate the CSS of patients using the SEER database. For
the nomogram predictions of 1-, 3- and 5-year CSS, age,
T stage, N stage, and M stage were included in the analysis. The C-index, which was used to estimate the correlation between the predicted probability and actual event,
Tang et al. BMC Cancer
(2020) 20:608
was 0.716 (95% CI, 0.684–0.773) in the internal cohort
and 0.713 (95% CI, 0.641–0.794) in the external cohort,
which indicated that the nomogram was reliable. However, race and tumor size were not used to build the
nomogram plot because the AIC value was too large. AIC
is considered an important criterion for variable sieving
and has been used in many studies [29, 30]. Moreover, according to the results of the ROC curve and DCA, the
nomogram has better clinical usability than the 7th TNM
staging system. Therefore, to some extent, we could evaluate the prognosis of patients by the nomogram other than
TNM staging because of high reliability. According to the
total score, we could determine whether patients need further chemotherapy after surgery. In that way, we could
individualize the treatment of patients. In addition, we will
next improve and perfect this work in a future study by collecting data for our own patients, also we will perform some
experiments about adenocarcinoma in villous adenoma to
investigate what differences were between adenocarcinoma
in villous adenoma and conditional colorectal cancer.
Of course, our study has some limitations that should
be noted. First, the TNM stage we analyzed was according to the 7th AJCC staging system, which was not the
latest and may reduce the effectiveness. Then, our nomograms were constructed only by the SEER database,
leading to potential selection bias. However, we developed the nomogram and verified its validity in the internal and external cohorts, which made our results
more reliable. In addition, the use of AIC could make
our model better by avoiding overfitting and underfitting
effects. Although this nomogram performed well in the
two cohorts, it should be applied with great caution
when assessing the risk of 1-, 3- and 5-year survival. In
the future, we will collect relevant data to incorporate
the factors above into further research. Next, our manuscript has not included other characteristics, such as
hematological biomarkers and molecular parameters. As
some studies suggested, combining some hematological
biomarkers, such as HGB, neutrophils and LDH, can
promote the predictive ability of a nomogram [31], while
molecular parameters, including miRNA, CpG methylation and circular RNA, have been demonstrated to be
useful for predicting the survival of patients [32–34].
Therefore, we will improve and perfect this work in our
future study by combining these characteristics.
Conclusions
In this study, we found that age at diagnosis, tumor size, T
stage, N stage, race and M stage were identified as risk factors for CSS in our patient sample. In addition, we constructed nomograms to predict the survival of patients and
found that compared to 7th TNM staging, the nomograms
could serve as a good and effective tool for survival evaluation by calculating calibration plots and ROC curves.
Page 11 of 12
Supplementary information
Supplementary information accompanies this paper at />1186/s12885-020-07099-3.
Additional file 1: Supplementary Figure 1. The flow chart of
extracted patients from the SEER database.
Additional file 2: Supplementary Figure 2. OS curves for all patients
according to different variables. (A) Age, (B) sex, (C) tumor number, (D) T
stage.
Additional file 3: Supplementary Figure 3. OS curves for all patients
according to different variables. (A) N stage, (B) M stage, (C) pathological
grade type, (D) race.
Additional file 4: Supplementary Figure 4. OS curves for all patients
according to tumor size.
Additional file 5: Supplementary Figure 5. Analysis of CSS for all
patients according to different variables. (A) Age, (B) sex, (C) tumor
number, (D) T stage.
Additional file 6: Supplementary Figure 6. Analysis of CSS for all
patients according to different variables. (A) N stage, (B) M stage, (C)
pathological grade type, (D) race.
Additional file 7: Supplementary Figure 7. Analysis of CSS for all
patients according to M stage.
Additional file 8: Supplementary Table 1. the detail information
about different variables according to.
Abbreviations
CRC: Colorectal cancer; SSA: Sessile serrated adenomas; VA/TVAs: Villous/
tubulovillous adenomas; ESD: Endoscopic submucosal dissection;
SEER: Surveillance, Epidemiology, and End Results; AIC: Akaike Information
Criterion; OS: Overall survival; CSS: Cancer-specific survival
Acknowledgments
Not Applicable
Authors’ contributions
CTT and LZ: data collection, data analysis, and manuscript writing. JY: data
analysis. CZ and YC: project development. All authors have read and
approved the manuscript.
Funding
This study was supported by grants from the National Natural Science
Foundation of China (Grant No. 81660404), the Foundation of Jiangxi
provincial department of Science and Technology (grant No.
20201ZDG02007) and Foundation of Jiangxi Educational Committee (grant
No. GJJ170016). All funders provided support to authors and paid the fee for
statistical analysis.
Availability of data and materials
Not Applicable.
Ethics approval and consent to participate
Not Applicable.
Consent for publication
Not appliable.
Competing interests
The authors disclose no conflicts of interest.
Received: 24 February 2020 Accepted: 22 June 2020
References
1. Bray F, et al. Global cancer statistics 2018: GLOBOCAN estimates of
incidence and mortality worldwide for 36 cancers in 185 countries. CA
Cancer J Clin. 2018;68(6):394–424.
Tang et al. BMC Cancer
2.
3.
4.
5.
6.
7.
8.
9.
10.
11.
12.
13.
14.
15.
16.
17.
18.
19.
20.
21.
22.
23.
24.
25.
26.
(2020) 20:608
Winawer SJ, et al. Prevention of colorectal cancer by colonoscopic
polypectomy. The National Polyp Study Workgroup. N Engl J Med. 1993;
329(27):1977–81.
Kalimuthu SN, Chelliah A, Chetty R. From traditional serrated adenoma to
tubulovillous adenoma and beyond. World J Gastrointest Oncol. 2016;8(12):805–9.
Jin Y, et al. Risk analysis of the canceration of colorectal large polyps.
Zhonghua Wei Chang Wai Ke Za Zhi. 2018;21(10):1161–6.
Grunwald D, et al. Further defining the 2012 multi-society task force
guidelines for surveillance of high-risk adenomas: is a 3-year interval needed
for all patients? J Clin Gastroenterol. 2019;53(9):673–9.
Wieszczy P, Kaminski MF, Franczyk R, Loberg M, Kobiela J, Rupinska M, Kocot
B, Rupinski M, Holme O, Wojciechowska U et al. Colorectal Cancer incidence
and mortality after removal of adenomas during screening colonoscopies.
Gastroenterology. 2020;158(4):875-883.e875.
Chafai S, et al. Adenocarcinoma on villous tumor of the rectum in an
adolescent. Arch Pediatr. 1995;2(8):762–5.
Rossi BW, et al. Mucinous adenocarcinoma of the umbilicus 8 years
following anterior resection for villous adenoma of the rectum. J Surg Case
Rep. 2014;2014(1)..
Kuratate S, et al. Coexistent poorly-differentiated neuroendocrine cell
carcinoma and non-invasive well-differentiated adenocarcinoma in
tubulovillous adenoma of the rectum: report of a case. J Med Investig. 2010;
57(3–4):338–44.
Nakano Y, et al. Recurrence of adenoma after curative endoscopic
submucosal dissection for a rectal intramucosal adenocarcinoma in
adenoma. Endosc Int Open. 2019;7(4):E621–e624.
Sokol AB, Adler L, Morgenstern L. The synchronous association of villous
adenoma with colonic adenocarcinoma. Calif Med. 1972;117(4):61–4.
Al-Sibai A, et al. Carcinoma arising in a villous adenoma in a 19 year-old
male with review of the literature. Md State Med J. 1979;28(2):45–6.
MA D, et al. The surveillance, epidemiology, and end results (SEER) program
and pathology: toward strengthening the critical relationship. Am J Surg
Pathol. 2016;40(12):e94–e102.
Iasonos A, et al. How to build and interpret a nomogram for cancer
prognosis. J Clin Oncol. 2008;26(8):1364–70.
Hassan C, et al. Post-polypectomy colonoscopy surveillance: European
Society of Gastrointestinal Endoscopy (ESGE) guideline. Endoscopy. 2013;
45(10):842–51.
Cottet V, et al. Long-term risk of colorectal cancer after adenoma removal: a
population-based cohort study. Gut. 2012;61(8):1180–6.
Mouchli MA, et al. Colonoscopy surveillance for high risk polyps does not
always prevent colorectal cancer. World J Gastroenterol. 2018;24(8):905–16.
Del Rio P, et al. The malignant colonic polyp review of biological, clinical
parameters and treatment. Ann Ital Chir. 2015;86:396–405.
Alshareef SH, Alsobaie NA, Aldeheshi SA, Alturki ST, Zevallos JC, Barengo NC.
Association between Race and Cancer-Related Mortality among Patients
with Colorectal Cancer in the United States: A Retrospective Cohort Study.
Int J Environ Res Public Health. 2019;16;16(2):240.
Aizer AA, et al. Lack of reduction in racial disparities in cancer-specific
mortality over a 20-year period. Cancer. 2014;120(10):1532–9.
Carethers JM. Screening for colorectal cancer in African Americans:
determinants and rationale for an earlier age to commence screening. Dig
Dis Sci. 2015;60(3):711–21.
Ayanian JZ, Carethers JM. Bridging behavior and biology to reduce
socioeconomic disparities in colorectal cancer risk. J Natl Cancer Inst. 2012;
104(18):1343–4.
Franklin RA, et al. Comparative survival of patients with anal
adenocarcinoma, squamous cell carcinoma of the anus, and rectal
adenocarcinoma. Clin Colorectal Cancer. 2016;15(1):47–53.
Yan Q, et al. Value of tumor size as a prognostic factor in metastatic
colorectal cancer patients after chemotherapy: a population-based study.
Future Oncol. 2019;15(15):1745–58.
Wang R, Zhao D, Liu YJ, Ye C, Qian JR, Dai JN, Liu SY, Liu JY, Li B, Wang MJ
et al. Prognostic significance of preoperative radiotherapy in stage II and III
rectal cancer patients: a strobe-compliant study of SEER 18 registries
database (1988-2011). Neoplasma. 2019; 2019;66(6):995-1001.
Shen K, Yao L, Wei J, Luo Z, Yu W, Zhai H, Wang J, Chen L, Fu D. Worse
characteristics can predict survival effectively in bilateral primary breast
cancer: a competing risk nomogram using the SEER database. Cancer Med.
2019;8(18):7890-902.
Page 12 of 12
27. Pan Z, et al. Development and validation of a nomogram for predicting
cancer-specific survival in patients with Wilms' tumor. J Cancer. 2019;10(21):
5299–305.
28. Chai X, et al. A prognostic nomogram for overall survival in male breast
cancer with histology of infiltrating duct carcinoma after surgery. PeerJ.
2019;7:e7837.
29. Y Y, YC S, DW C, JS H, SH S, N K, KT J, H K, CS L, SH C et al. Proposed
Modification of Staging for Distal Cholangiocarcinoma Based on the Lymph
Node Ratio Using Korean Multicenter Database. Cancers. 2020;12(3):762.
30. K H, J H, J J. Association of meteorological factors and atmospheric
particulate matter with the incidence of pneumonia: an ecological study.
Clin Microbiol Infect. the official publication of the European Society of
Clinical Microbiology and Infectious Diseases; 2020;S1198-743X(20)30148-8.
31. Long P, et al. Prognostic Nomogram for patients with radical surgery for
non-metastatic colorectal Cancer incorporating hematological biomarkers
and clinical characteristics. Onco Targets Ther. 2020;13:2093–102.
32. Yang Y, et al. Prognostic value of a hypoxia-related microRNA signature in
patients with colorectal cancer. Aging (Albany NY). 2020;12(1):35–52.
33. Deng Y, Wan H, Tian J, Cheng X, Rao M, Li J, Zhang H, Zhang M, Cai Y, Lu Z
et al. CpG-methylation-based risk score predicts progression in colorectal
cancer. Epigenomics. 2020.
34. Song W, Fu T. Circular RNA-associated competing endogenous RNA
network and prognostic Nomogram for patients with colorectal Cancer.
Front Oncol. 2019;9:1181.
Publisher’s Note
Springer Nature remains neutral with regard to jurisdictional claims in
published maps and institutional affiliations.