Etoposide-mediated interleukin-8 secretion from bone marrow stromal cells induces hematopoietic stem cell mobilization
Bạn đang xem bản rút gọn của tài liệu. Xem và tải ngay bản đầy đủ của tài liệu tại đây (2.7 MB, 15 trang )
Kang et al. BMC Cancer
(2020) 20:619
/>
RESEARCH ARTICLE
Open Access
Etoposide-mediated interleukin-8 secretion
from bone marrow stromal cells induces
hematopoietic stem cell mobilization
Ka-Won Kang1, Seung-Jin Lee2,3, Ji Hye Kim2,3, Byung-Hyun Lee1, Seok Jin Kim4, Yong Park1 and
Byung Soo Kim1,2,3*
Abstract
Background: We assessed the mechanism of hematopoietic stem cell (HSC) mobilization using etoposide with
granulocyte-colony stimulating factor (G-CSF), and determined how this mechanism differs from that induced by
cyclophosphamide with G-CSF or G-CSF alone.
Methods: We compared the clinical features of 173 non-Hodgkin’s lymphoma patients who underwent autologous
peripheral blood stem cell transplantation (auto-PBSCT). Additionally, we performed in vitro experiments to assess the
changes in human bone marrow stromal cells (hBMSCs), which support the HSCs in the bone marrow (BM) niche,
following cyclophosphamide or etoposide exposure. We also performed animal studies under standardized conditions
to ensure the following: exclude confounding factors, mimic the conditions in clinical practice, and identify the
changes in the BM niche caused by etoposide-induced chemo-mobilization or other mobilization methods.
Results: Retrospective analysis of the clinical data revealed that the etoposide with G-CSF mobilization group showed
the highest yield of CD34+ cells and the lowest change in white blood cell counts during mobilization. In in vitro
experiments, etoposide triggered interleukin (IL)-8 secretion from the BMSCs and caused long-term BMSC toxicity. To
investigate the manner in which the hBMSC-released IL-8 affects hHSCs in the BM niche, we cultured hHSCs with or
without IL-8, and found that the number of total, CD34+, and CD34+/CD45- cells in IL-8-treated cells was significantly
higher than the respective number in hHSCs cultured without IL-8 (p = 0.014, 0.020, and 0.039, respectively).
Additionally, the relative expression of CXCR2 (an IL-8 receptor), and mTOR and c-MYC (components of IL-8-related
signaling pathways) increased 1 h after IL-8 treatment. In animal studies, the etoposide with G-CSF mobilization group
presented higher IL-8-related cytokine and MMP9 expression and lower SDF-1 expression in the BM, compared to the
groups not treated with etoposide.
(Continued on next page)
* Correspondence:
1
Division of Hematology-Oncology, Department of Internal Medicine, Korea
University School of Medicine, 73, Goryeodae-ro, Seongbuk-gu, Seoul 02841,
South Korea
2
Institute of Stem Cell Research, Korea University, Seoul, South Korea
Full list of author information is available at the end of the article
© The Author(s). 2020 Open Access This article is licensed under a Creative Commons Attribution 4.0 International License,
which permits use, sharing, adaptation, distribution and reproduction in any medium or format, as long as you give
appropriate credit to the original author(s) and the source, provide a link to the Creative Commons licence, and indicate if
changes were made. The images or other third party material in this article are included in the article's Creative Commons
licence, unless indicated otherwise in a credit line to the material. If material is not included in the article's Creative Commons
licence and your intended use is not permitted by statutory regulation or exceeds the permitted use, you will need to obtain
permission directly from the copyright holder. To view a copy of this licence, visit />The Creative Commons Public Domain Dedication waiver ( applies to the
data made available in this article, unless otherwise stated in a credit line to the data.
Kang et al. BMC Cancer
(2020) 20:619
Page 2 of 15
(Continued from previous page)
Conclusion: Collectively, the unique mechanism of etoposide with G-CSF-induced mobilization is associated with IL-8
secretion from the BMSCs, which is responsible for the enhanced proliferation and mobilization of HSCs in the bone
marrow; this was not observed with mobilization using cyclophosphamide with G-CSF or G-CSF alone. However, the
long-term toxicity of etoposide toward BMSCs emphasizes the need for the development of more efficient and safe
chemo-mobilization strategies.
Keywords: Hematopoietic stem cell mobilization, Etoposide, Cyclophosphamide, G-CSF
Background
Successful autologous peripheral blood stem cell transplantation (auto-PBSCT) for hematological malignancies
requires harvesting a sufficient number of human
hematopoietic stem cells (hHSCs) mobilized from the
bone marrow (BM) to the peripheral blood (PB). In clinical practice, the mobilization protocols generally include
chemotherapy and granulocyte colony-stimulating factor
(G-CSF) (chemo-mobilization), as restricting the cancer
burden during mobilization is crucial. Since the first
clinical application of G-CSF by Dührsen et al. in 1988
[1], cyclophosphamide chemo-mobilization has been
commonly used for chemo-mobilization [2, 3]. Cyclophosphamide induces the release of stress signals that
cause inflammation, thereby activating the host immune
system, which may increase hHSC mobilization [4, 5].
However, this protocol has some disadvantages, including—primarily—the unpredictability of the number of
hHSCs that can be collected from the PB and the possibility of mobilization-related toxicities, such as febrile
neutropenia [5–7]. Reiser et al. had first reported the use
of etoposide as an alternative to cyclophosphamide to
effectively mobilize PBSCs in patients in whom
cyclophosphamide-induced chemo-mobilization had
failed [8]; this led to studies on etoposide-induced
chemo-mobilization (Supplementary Material 1: Table
S1) [9–13]. However, concerns regarding the use of
etoposide include its inhibition of topoisomerase 2,
which damages DNA. Cancer patients undergoing
chemotherapy regimens that include etoposide, have
been reported to experience secondary hematological
malignancies [14, 15]. Moreover, Gibson et al. demonstrated that etoposide could damage human bone marrow
stromal cells (hBMSCs) [16]. These findings suggest that
etoposide may influence the BM niche by not only enhancing hHSC mobilization but also by inducing BM damage.
Therefore, the mechanism underlying etoposide-induced
mobilization may differ from that of G-CSF- or
cyclophosphamide-induced mobilization, which proceeds
through the demargination of HSCs from the BM to PB
due to systemic inflammation [17]. However, to date, this
topic appears to have received little attention. Furthermore, verification of the mobilization mechanisms may be
difficult due to the interference of complex physical
conditions in patients, which could confound the interpretation of the associated clinical findings. To overcome these barriers, we designed a three-step study
involving the following: 1) analysis of clinical data associated with auto-PBSCT in patients with non-Hodgkin’s
lymphoma (NHL); 2) in vitro experiments to assess the
changes in hBMSCs, which support HSCs in the BM
niche, after exposure to cyclophosphamide or etoposide; and 3) in vivo animal studies under standardized
conditions to exclude confounding factors, mimic conditions of clinical practice, and identify changes in the BM
niche caused by etoposide-induced chemo-mobilization or
other mobilization protocols.
Methods
Clinical data
The clinical data of patients with Non-Hodgkin Lymphoma (NHL) who underwent PB stem cell collection
(PBSCC) at the Korea University Anam Hospital and the
Samsung Medical Center, from 2005 to 2019, was retrospectively analyzed, and a retrospective chart review was
conducted. Both these studies were approved by an internal board of the Korea University Anam Hospital
(IRB No. 2019AN0386) and the Samsung Medical Center (2019–09–085-001).
Primary hBMSC culture
The internal review board of the Korea University Anam
Hospital (IRB No. 2015AN0267) approved all the procedures. Written informed consent was obtained from all
subjects. The subjects were healthy individuals who donated BM via BM harvesting. A total of 20 mL BM was
collected from each subject. Mononuclear cells (MNCs)
were separated using Ficoll-Paque™ Plus medium (GE
Healthcare Life Sciences, Seoul, South Korea); the
remaining cells were cultured in mesenchymal stem cell
growth medium (Lonza, Walkersville, MD, USA). In
this study, we used isolated hBMSCs within five passages from the start of the subculture and routinely
tested to confirm the absence of mycoplasma by the eMyco™ VALiD mycoplasma PCR detection kit (iNtRON, Burlington, MA, USA).
Kang et al. BMC Cancer
(2020) 20:619
Flow cytometry
Antibodies against anti-human CD73-PE, CD90-PE,
CD105-PE, CD34-FITC, and CD45-PE (Becton Dickinson,
San Jose, CA, USA) were used at 1:100 dilution. Cells were
analyzed using FACSCalibur™ (Becton Dickinson).
Chemotherapeutic agents and cytotoxicity assay
Commercially available preparations of cyclophosphamide (Endoxan injection, 500 mg; Boxter Inc., Seoul,
South Korea) and etoposide (Lastet injection, 100 mg/5
mL; Dong-A Inc., Seoul, South Korea) were used. Cell
Counting Kit-8 (CCK-8 assay, Dojindo Laboratories,
Japan) was used for the cytotoxicity assays, according to
the manufacturer’s instructions. Absorbance was measured at 450 nm using a SpectraMax Plus 384 spectrophotometer (Molecular Devices Corporation, CA, USA).
Page 3 of 15
reverse transcriptase (Thermo Fisher Scientific, Inc.),
according to the manufacturer’s instructions. Synthesized cDNA was amplified using the iQ SYBR Green
qPCR Master Mix (Bio-Rad) on a Bio-Rad iCycler iQ
(Bio-Rad). Comparative threshold cycle values were
normalized to those of glyceraldehyde-3-phosphate dehydrogenase. The primers used are described in Supplementary Material 2: Table S2. To compare the
difference in mRNA expression, relative quantification
was performed using the delta-delta Ct method [18]. In
brief, the ΔCt value was obtained after normalization
based on the internal control (GAPDH), and the ΔΔCt
value was obtained based on the control group. We
then used 2-ΔΔCt to calculate the fold change.
Mice
Human and mouse cytokine arrays
The Human Cytokine Antibody Array C1000 and Mouse
Cytokine Antibody Array C1000 (both from Ray Biotech,
GA, USA) were used, according to the manufacturer’s
instructions. Images were acquired using a ChemiDoc™
Touch Imaging System (Bio-Rad, Hercules, CA, USA)
and quantified using ImageJ (National Institutes of
Health, MD, USA). Signal was normalized using the internal positive controls and the background with the
RayBio® Antibody Array Analysis Tool (Ray Biotech).
Apoptosis and cell cycle analysis
Apoptosis analysis was performed using the EzWay
Annexin V-FITC Apoptosis Detection Kit (Koma Biotech
Inc., Seoul, South Korea). Cell-cycle distribution analysis
was performed using propidium iodide at 50 mg/mL
(Sigma-Aldrich, catalog no. P4170). Both assays were performed according to the manufacturers’ instructions.
HSC culture and IL-8 treatment
Human BM CD34+ HSCs were purchased from Lonza
(catalog no. 2 M-101) and cultured in Stemline® II
Hematopoietic Stem Cell Expansion Medium (SigmaAldrich, catalog no. S0192) containing 100 ng/mL
stem cell factor, thrombopoietin, and G-CSF (all obtained from R&D Systems, Inc., Minneapolis, MN,
USA). Recombinant human IL-8/CXCL8 protein was
acquired from R&D Systems (catalog no. 208-IL).
Quantitative reverse transcription-polymerase chain
reaction (qRT-PCR)
Total RNA was isolated from cells using the Qiagen
RNeasy kit (Qiagen, Hilden, Germany) and quantified
using a NanoDrop spectrophotometer (Thermo Fisher
Scientific, Inc., Waltham, MA, USA). cDNA was synthesized using 2 μg total RNA as a template in a 20-μL reaction mixture containing oligos, primers, and Superscript II
All experimental procedures using animals complied
with the guidelines of the Laboratory Animal Research
Center of the Korea University College of Medicine (IRB
No. KOREA-2017-0176). A total of 87 C57BL/6 N mice
were purchased from Orient Bio (Seongnam, South
Korea). Mice, 8 weeks of age and with a body weight of
20 g, were maintained in polypropylene cages under specific pathogen-free conditions, with light/dark 12-h cycles, at 21 ± 2 °C, and had ad libitum access to a
maintenance diet. Sample sizes were calculated using a
pilot study and the G*Power program ( All analyses were conducted blindly to
minimize the effects of subjective bias.
Protocol for HSC mobilization in mice
The mouse model of HSC mobilization was designed
based on protocol used in human patients (Fig. 4a–b). A
previously reported model of cyclophosphamide chemomobilization was used in this study [19]. Due to the apparent lack of a related animal model, we developed a
new model of etoposide chemo-mobilization. Mice were
injected intraperitoneally with 4 mg cyclophosphamide
(≈ 200 mg/kg) on day 1 (D1) or with 0.8 mg etoposide (≈
40 mg/kg) on days 1 and 2 (D1, D2). Subsequently, 5 μg
human G-CSF (250 μg/kg per day; Leucostim prefilled
syringe INJ, Dong-A Inc.) was administered daily as a
single subcutaneous injection, on each successive day
from day 3, for a total of 4 days. All mice were euthanized on D7 by cardiac puncture and cervical dislocation under anesthesia. On day 7 (D7), we isolated
hematopoietic progenitor cells (HPCs) using an EasySep™ Mouse Hematopoietic Progenitor Cell Isolation
Kit and performed colony-forming unit (CFU) assays
using MethoCult™ GF M3434 medium (both from
Stem Cell Technologies, Vancouver, BC, Canada), according to the manufacturer’s instructions.
Kang et al. BMC Cancer
(2020) 20:619
Page 4 of 15
Enzyme-linked immunosorbent assay (ELISA)
Statistical analysis
Plasma levels of stromal cell-derived factor-1 (SDF-1),
matrix metalloproteinase-2 (MMP2), and matrix
metalloprotease-9 (MMP9) in mice were measured using
the Magnetic Luminex® Screening Assay (R&D Systems),
according to the manufacturer’s instructions.
Patient demographics and baseline characteristics were
compared using Kruskal–Wallis H and Chi-square tests.
Multivariate analysis using the Cox proportional hazards
method was performed. Mann–Whitney U, Student’s ttests, and analysis of variance were used to analyze differences in data from the in vitro and in vivo experiments, based on the variables involved. A post hoc
analysis with Bonferroni correction was performed when
statistical differences were identified among the three
groups. Data analysis was performed using IBM SPSS
Statistics for Windows, version 25.0 (IBM Corp., NY,
USA). Significant differences are denoted by p-values <
0.05.
Immunohistochemistry of BM sections
Immunohistochemistry (IHC) was performed on 3-μm
formalin-fixed, paraffin-embedded sections from the
BM. The following primary antibodies were used: antikeratinocyte-derived cytokine (KC) (Cloud-Clone Corp.,
Houston, TX, USA; catalog no. PAA041Mu01; 1:50),
anti-macrophage inflammatory protein 2 (MIP-2)
(Cloud-Clone Corp.; catalog no. PAB603Mu01; 1:100),
anti-lipopolysaccharide-inducible CXC chemokine (LIX)
(Cloud-Clone Corp.; catalog no. PAA860Mu01; 1:100),
anti-MMP2 (Abcam; catalog no. ab37150; 1:200), antiMMP9 (Abcam; catalog no. ab38898; 1:200), and antiSDF-1 (Abcam; catalog no. ab9797; 1:500). In the case of
anti-KC, anti-MIP-2, anti-LIX, anti-MMP9, and antiSDF-1, antigen retrieval was performed using a citrate
buffer. All slides were scanned using a virtual microscopy scanner (Axio Scan Z1 scanner; Carl Zeiss, Jena,
Germany); positive contributions were calculated by
summing the highly positive, positive, and low-positive
fractions for each staining using the IHC profiler Plugin
of ImageJ [20].
Results
Etoposide-induced chemo-mobilization is highly effective
and exhibits different clinical features, compared to the
other mobilization methods
We analyzed data from 173 patients with NHL who
underwent PBSCC in the presence of the following chemotherapeutic agents: G-CSF only, n = 33; cyclophosphamide + G-CSF, n = 24; and etoposide + G-CSF, n =
116. The baseline characteristics of the patients are summarized in Table 1. The highest yield of CD34+ cells
was observed for etoposide + G-CSF (Fig. 1a), a result
that remained significant even after adjusting for baseline
characteristics (Supplementary Material 3: Table S3). The
Table 1 Baseline characteristics
Baseline characteristics
G-CSF only
(n= 33)
CY+G-CSF
(n= 24)
ETO+G-CSF
(n= 116)
p-value
Median age (in years) (range)
43.0 (17.0–67.0)
46.5 (20.0–62.0)
52 (21.0–65.0)
0.003
Male:female ratio
2.00
2.43
1.23
Histology, n (%)
0.243
0.139
Hodgkin lymphoma
3 (9.1)
4 (16.7)
5 (4.3)
B cell
15 (45.5)
14 (58.3)
65 (56.0)
T cell
15 (45.5)
6 (25.0)
46 (39.7)
Limited stage (Stage I-II)
8 (24.2)
3 (12.5)
31 (26.7)
Advanced stage (Stage III-IV)
Non-Hodgkin lymphoma
Disease stage, n (%)
0.342
25 (75.8)
21 (87.5)
85 (73.3)
Bone marrow involvement at dagnosis, n (%)
5 (15.2)
6 (25.0)
30 (27.5)
0.472
Number of previous chemotherapy treatments (range)
2 (1-3)
2 (1–3)
1 (1-5)
0.139
Disease status before mobilization, n (%)
0.080
Complete remission
12 (36.4)
10 (41.7)
52 (44.8)
Partial remission
19 (57.6)
12 (50.0)
47 (40.5)
Dose, total (mg/m ) (range)
━
3,000 (1,000–3,000)
750 (375–750)
━
Time from diagnosis to start of mobilization (months) (range)
7.6 (3.7–63.3)
16.6 (0.7-59.9)
6.2 (1.5–148.0)
0.003
2
Median follow-up duration after mobilization (months) (range)
12.2 (0.1–96.0)
37.8 (0.1–92.6)
13.0 (1.4–76.8)
━
Transplantation done, n (%)
29 (90.6)
16 (72.7)
112 (96.6)
━
Kang et al. BMC Cancer
(2020) 20:619
Page 5 of 15
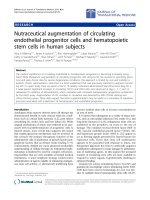
Fig. 1 Yield of CD34+ cells and changes in white blood cell counts based on the mobilization method. a Data from 173 patients diagnosed with
lymphoma who underwent peripheral blood stem cell collection (G-CSF only, n = 33; cyclophosphamide + G-CSF, n = 24; etoposide + G-CSF, n =
116) were analyzed. The highest yield of CD34+ cells was observed for etoposide + G-CSF [(1st day: G-CSF only: 1.36 (0.01–14.60);
cyclophosphamide + G-CSF, 0.81 (0.05–18.70); etoposide + G-CSF, 4.32 (0.03–32.77), 2nd day: G-CSF-only, 0.96 (0.09–7.25); cyclophosphamide + GCSF, 0.70 (0.06–13.20); etoposide + G-CSF, 3.37 (0.14–32.60), Total: G-CSF only, 3.13 (0.01–14.60); cyclophosphamide + G-CSF, 2.05 (0.12–31.9);
etoposide + G-CSF, 7.22 (0.18–59.20)]. b The change in white blood cell (WBC) counts at the nadir and at the time of collection during
mobilization was the lowest for the etoposide + G-CSF group among the three groups (ΔWBC: G-CSF only, 15,305 (− 1412–574,000);
cyclophosphamide + G-CSF, 10,320 (916–70,884); etoposide + G-CSF, 3770 (254–120,780)). Note: ‘At the nadir’ refers to the lowest WBC value
during chemotherapy before peripheral blood stem cell collection. ‘ΔWBC’ refers to the increase in WBC counts from the nadir to the time of
peripheral blood stem cell collection. Note: *** p < 0.001 after Bonferroni correction; ** p < 0.01 after Bonferroni correction. Note: Values are
reported as the median with range. Abbreviations: G-CSF, granulocyte colony-stimulating factor; CY, cyclophosphamide; ETO, etoposide
increase in white blood cell (WBC) count (from the nadir
to the time of PBSCC) was modest for etoposide + G-CSF,
compared with that for G-CSF only and cyclophosphamide + G-CSF (Fig. 1b). In etoposide + G-CSF, WBC
counts at the nadir (cyclophosphamide + G-CSF, 41 (9–
3258); etoposide + G-CSF, 262 (1–3160)) were higher, and
those at the time of PBSCC (cyclophosphamide + G-CSF,
10,350 (1000–70,900); etoposide + G-CSF, 4380 (500–122,
150)) were lower than the WBC counts in cyclophosphamide + G-CSF (p = 0.056 and 0.005, respectively). Previous
studies have reported a positive correlation between the
degree of WBC count increase during mobilization and
the increase in CD34+ cell yield [21–23]. In the present
study, etoposide-induced chemo-mobilization led to the
highest CD34+ cell yield, despite the fact that the differences in WBC counts between the nadir and the time of
PBSCC were the lowest. Therefore, we suspected that the
mechanism underlying HSC mobilization by etoposide
might differ from that of G-CSF only and cyclophosphamide. However, our hypothesis must be confirmed because there was heterogeneity among patients in each
group and because of the presence of other confounding
factors.
Etoposide increases IL-8 secretion from BMSCs and
causes long-term MBSC toxicity
hBMSCs, which constitute the major cell component of
the BM niche [24], were isolated from BM (Fig. 2a–b)
and treated with various concentrations of cyclophosphamide (0–12.5 mg/mL) or etoposide (0–2.0 mg/mL)
for 24 h. Drug concentrations sufficient to cause the
death of 10, 25, and 50% of the viable hBMSCs were defined as cytotoxic concentration (CC) 10, CC 25, and
CC 50, respectively (Fig. 2c). Data regarding the blood
concentrations of the two drugs from patients receiving
high-dose cyclophosphamide or etoposide treatment was
compiled from the literature. For high-dose cyclophosphamide treatment (1850–7000 mg/m2), the maximum
reported serum concentration (Cmax) was 2.664 mg/mL
[25, 26]. For high-dose etoposide treatment (1480–1665
mg/m2), the reported Cmax was 0.1 mg/mL [27, 28].
Based on this information, the CC10 was selected as the
drug concentration for further experiments.
hBMSCs were cultured in a medium containing normal saline (control group, n = 4), cyclophosphamide
(dose of CC10, n = 5), or etoposide (dose of CC10, n = 5)
for 24 h; subsequently, human cytokine analysis was
Kang et al. BMC Cancer
(2020) 20:619
Fig. 2 (See legend on next page.)
Page 6 of 15
Kang et al. BMC Cancer
(2020) 20:619
Page 7 of 15
(See figure on previous page.)
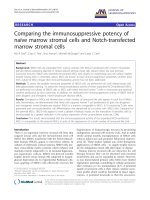
Fig. 2 Primary culture of human bone marrow stromal cells and results of the cytotoxicity assays, cytokine arrays, and apoptosis and cell cycle
analyses. a Mononuclear cells were collected from a healthy donor during bone marrow harvest. After 1–2 weeks of primary culture, adherent cells
showed spindle-shaped morphology and reached 65–70% confluence. b Flow cytometry indicated that these cells were positive for the human bone
marrow stromal cell (hBMSC) markers CD73, CD90, and CD105 and negative for the hematopoietic stem cell markers CD34 and CD45. These results
indicate that hBMSCs were properly isolated. c Cytotoxic concentration (CC) 10, CC 25, and CC 50, defined as the concentrations sufficient to cause the
death of 10, 25, and 50% of viable hBMSCs, were calculated for various concentrations of cyclophosphamide and etoposide. d hBMSCs were cultured
in normal saline (control group, n = 4), cyclophosphamide (dose of CC10, n = 5), or etoposide (dose of CC10, n = 5) for 24 h. Human cytokine analysis
was performed with the conditioned media. The level of IL-8, a mobilization-associated cytokine, was significantly higher in the etoposide-treated
group than that in the cyclophosphamide-treated group (p = 0.021 after Bonferroni correction). f Expansion of etoposide-treated hBMSCs was
significantly lower than that of cyclophosphamide-treated hBMSCs in both P1 and P2 (control, n = 7; cyclophosphamide, n = 7; etoposide, n = 7; both,
p < 0.001 after Bonferroni correction). g No differences in the numbers of early apoptotic and necrotic cells or late apoptotic cells were observed
among the groups (control, n = 4; cyclophosphamide, n = 7; etoposide, n = 7). As a negative control, hBMSCs treated only with normal saline were
used. The values within the figures represent the mean ± standard error in repeated experiments. All experimental data of representative figures are
presented as Supplementary Material 6: Fig. S3. h Etoposide-treated hBMSCs showed a higher proportion of cells arrested in the G0/G1 phase of the
cell-cycle than the cyclophosphamide-treated and untreated hBMSCs (control, n = 3; cyclophosphamide, n = 3; etoposide, n = 3; p = 0.03 and p = 0.01
after Bonferroni correction, respectively). Note: * p < 0.05 after Bonferroni correction. Note: Values are reported as the mean ± standard error of the
mean (SEM). Abbreviations: P1, passage 1; P2, passage 2; CC, cytotoxic concentration
performed using the conditioned media. The level of IL8, a mobilization-associated cytokine [29, 30], was significantly higher in the etoposide-treated group than in
the cyclophosphamide-treated group (p = 0.021 after
Bonferroni correction) (Fig. 2d–e). Other mobilizationassociated cytokines showed no significant differences
among the groups.
The degree of expansion of etoposide-treated hBMSCs
was significantly lower than that of cyclophosphamidetreated hBMSCs for all passages (p < 0.001 after Bonferroni correction for both) (Fig. 2f). No significant differences in apoptosis were observed among the groups
(Fig. 2g). However, cell-cycle analysis revealed a significantly higher proportion of etoposide-treated hBMSCs
arrested in the G0/G1 phase than cyclophosphamidetreated and untreated hBMSCs (p = 0.03 and p = 0.01
after Bonferroni correction, respectively; Fig. 2h).
IL-8 enhances HSC expansion and is associated with
CXCR2, mTOR, and c-MYC activation
We observed significantly increased IL-8 secretion from
hBMSCs treated with etoposide, compared to that from
hBMSCs treated with cyclophosphamide. To investigate
the manner in which the hBMSC-released IL-8 affects
hHSCs in the BM niche, we cultured 2.5 × 10⁶ hHSCs with
100 ng/mL IL-8 (n = 12) or without IL-8 (n = 12) for 24 h in
a conditioned medium collected from 24-h cultures of
healthy hBMSCs grown in mesenchymal stem-cell growth
medium. Previous experiments had determined the distribution of human cytokines in this conditioned medium
(Fig. 2d, control group) and had identified the relatively low
IL-8 expression in this medium (Fig. 2e, control group).
The numbers of total, CD34+, and CD34+/CD45- cells determined using a hemocytometer and flow cytometric analysis of CD34+ cells cultured with IL-8 were significantly
higher than those of cells cultured without IL-8 (p = 0.014,
0.020, and 0.039, respectively) (Fig. 3a). To identify the
mechanism underlying the effect of IL-8 on hHSCs, the
expression of CXCR2 (an IL-8 receptor) and mTOR and cMYC (components of IL-8-related signaling pathways) was
measured by qRT-PCR. The relative expression of CXCR2,
mTOR, and c-MYC increased at 1 h after IL-8 treatment
(Fig. 3b). The expression of CXCR2 returned to normal 6 h
after IL-8 treatment, and the expression of mTOR gradually
decreased at 6 and 24 h after IL-8 treatment. In the case of
c-MYC, the increased expression lasted up to 24 h.
Etoposide-induced chemo-mobilization increases IL-8associated cytokine levels, especially in the BM
We developed mouse models for PB HSC mobilization
based on the actual mobilization protocol used in human
patients (G-CSF only, n = 8; cyclophosphamide + G-CSF,
n = 8; etoposide + G-CSF, n = 8; Fig. 4a–b). Changes in
WBC counts at the nadir and at the time of collection (D7)
showed patterns similar to those observed in clinical settings (Figs. 1b and 4c). On D7, HPCs were isolated from
the PB, and CFUs (CFU-granulocytes, erythrocytes, monocytes, and megakaryocytes; CFU-granulocytes, macrophages; and burst forming unit-erythroids) were counted
(Fig. 4d). The cyclophosphamide-treated (total 200 mg/kg)
and etoposide-treated (total 80 mg/kg) groups showed a
higher number of CFUs than the G-CSF only group (p =
0.021 and 0.003 after Bonferroni correction, respectively).
No significant differences in the total number of CFUs were
observed between the cyclophosphamide-treated (total
200 mg/kg) and etoposide-treated (total 80 mg/kg)
groups (G-CSF only, n = 5; cyclophosphamide + GCSF, n = 5; etoposide + G-CSF, n = 5; Fig. 4e). Thus,
this condition might be appropriate to investigate the differences in the mechanisms underlying etoposide-induced
and other compound-induced chemo-mobilization.
Plasma cytokine levels in whole blood collected from
mice on D7 were analyzed. The levels of KC, MIP-2, and
LIX, which are IL-8 homologs in mice [31–33], were
Kang et al. BMC Cancer
(2020) 20:619
Page 8 of 15
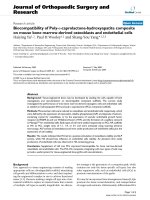
Fig. 3 Effects of increased IL-8 levels on hematopoietic stem cells. a Conditioned media was collected from 24-h cultures of healthy hBMSCs
grown in mesenchymal stem cell growth medium. Subsequently, 2.5 × 10⁶ hHSCs were cultured for 24 h in conditioned media in the presence
n = 12) and absence (n = 12) of IL-8 (100 ng/mL). The numbers of total, CD34+, and CD34+/CD45- cells were significantly higher in the hHSCs
cultured in the presence of IL-8, compared to those in cells cultured without IL-8 (p = 0.014, p = 0.020, and p = 0.039, respectively). b The relative
expression of CXCR2, mTOR, and c-MYC increased at 1 h after IL-8 treatment. The expression of CXCR2 returned to normal after 6 h of IL-8
treatment, and the expression of mTOR gradually decreased at 6 and 24 h after IL-8 treatment. In the case of c-MYC, the increased expression
lasted up to 24 h. Each experiment was repeated thrice. Note: *** p < 0.001; ** p < 0.01; * p < 0.05. Note: Values are reported as the median with
range (A) and the mean ± SEM (B). Abbreviations: hBMSCs, human bone marrow stromal cells; hHSC, human hematopoietic stem cell
measured (G-CSF only, n = 9; cyclophosphamide + GCSF, n = 9; etoposide + G-CSF, n = 9). The level of KC
was significantly increased in the etoposide-treated
group, compared with that in the cyclophosphamidetreated group (p = 0.001 after Bonferroni correction).
The levels of the other IL-8 homologs, MIP-2 and LIX,
were also increased in the etoposide-treated group, compared with those in the cyclophosphamide-treated
group; however, the differences were not significant.
None of the three homologs showed significant
differences among the etoposide-treated and G-CSFonly groups (Fig. 5a–b). To confirm that the changes in
the plasma levels of KC, MIP-2, and LIX reflected similar changes in the BM, we quantified the IHC images of
BM sections using the IHC profiler Plugin of ImageJ (GCSF only, n = 7; cyclophosphamide + G-CSF, n = 7; etoposide + G-CSF, n = 7). The levels of KC, MIP-2, and
LIX were all significantly increased in the BM sections
from the etoposide-treated group, compared with those
from the G-CSF-only and cyclophosphamide-treated
Kang et al. BMC Cancer
(2020) 20:619
Page 9 of 15
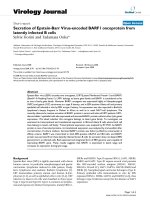
Fig. 4 Mouse model of peripheral blood hematopoietic stem cell mobilization. a, b, c The mouse model of hematopoietic stem cell (HSC)
mobilization was designed based on a protocol used in human patients (G-CSF only, n = 8; cyclophosphamide + G-CSF, n = 8; etoposide + G-CSF,
n = 8). d On day 7 (D7) of the protocol, HPCs were isolated from the peripheral blood and CFUs (CFU-granulocytes, erythrocytes, monocytes, and
megakaryocytes; CFU-granulocytes, macrophages; and burst-forming unit-erythroid) were counted. The presented pictures were obtained in the
control group (G-CSF only). e The cyclophosphamide-treated (total 200 mg/kg) and etoposide-treated (total 80 mg/kg) groups showed a higher
number of CFUs than the G-CSF only group (p = 0.021 and 0.003 after Bonferroni correction, respectively). No significant difference was observed
in the total number of CFUs between the cyclophosphamide-treated (200 mg/kg) and etoposide-treated (80 mg/kg) groups (G-CSF only, n = 5;
cyclophosphamide + G-CSF, n = 5; etoposide + G-CSF, n = 5). Note: ** p < 0.01 after Bonferroni correction; * p < 0.05 after Bonferroni correction.
Note: Values are reported as the mean ± SEM. Abbreviations: S.C., subcutaneous injection; I.P., intraperitoneal injection; NS, normal saline; G-CSF,
granulocyte colony-stimulating factor; CY, cyclophosphamide; ETO, etoposide; CFU, colony-forming unit; GEMM, granulocytes, erythrocytes,
monocytes, and megakaryocytes; GM, granulocytes, macrophages; BFU-E, burst forming unit-erythroid; n.s., not significant
Kang et al. BMC Cancer
(2020) 20:619
Page 10 of 15
Fig. 5 Keratinocyte-derived cytokine (KC), macrophage inflammatory protein 2 (MIP-2), and lipopolysaccharide-inducible CXC (LIX) expression in
the mouse model of peripheral blood hematopoietic stem cell mobilization. a, b Plasma cytokine analysis was performed in the mouse model on
day 7. Levels of KC, MIP-2, and LIX (IL-8 homologs in mice) were measured (G-CSF only, n = 9; cyclophosphamide + G-CSF, n = 9; etoposide + GCSF, n = 9). KC levels significantly increased in the etoposide-treated group, compared with those in the cyclophosphamide-treated group (p =
0.001 after Bonferroni correction). Levels of the other IL-8 homologs, MIP-2 and LIX, were also increased in the etoposide-treated group but did
not show significant differences compared to the cyclophosphamide-treated group. c, d, e To confirm local changes in KC, MIP-2, and LIX in the
bone marrow, we quantified IHC images using the IHC profiler plugin of the ImageJ. KC increased significantly in the etoposide-treated group,
compared to that in the G-CSF-only and cyclophosphamide-treated groups (p < 0.001 and p < 0.001 after Bonferroni correction, respectively).
Levels of the other IL-8 homologs, MIP-2 and LIX, increased significantly in the etoposide-treated group, compared to those in the G-CSF-only
group and cyclophosphamide-treated group (MIP-2, p = 0.004 and p < 0.001 after Bonferroni correction, respectively; LIX, p < 0.001 and p < 0.001
after Bonferroni correction, respectively). Note: *** p < 0.001 after Bonferroni correction; ** p < 0.01 after Bonferroni correction. Note: Values are
reported as the mean ± SEM. Abbreviations: G-CSF, granulocyte colony-stimulating factor; CY, cyclophosphamide; ETO, etoposide; n.s., not
significant; IHC, immunohistochemistry
Kang et al. BMC Cancer
(2020) 20:619
groups (p < 0.001 and p < 0.001; p = 0.004 and p < 0.001;
p < 0.001 and p < 0.001 after Bonferroni correction, respectively; Fig. 5c–e).
Etoposide-induced chemo-mobilization is associated with
increased MMP9 and decreased SDF-1 levels in the BM
The cytokine network was comprehensively analyzed to
identify the potential mechanisms underlying etoposideinduced HSC mobilization. Cytokines exhibiting a significant (p < 0.05) increase in response to etoposide-induced
chemo-mobilization, compared to that in response to
G-CSF-only- or cyclophosphamide-induced chemomobilization, in mouse cytokine assays were analyzed
by Ingenuity Pathway Analysis (Qiagen, Redwood City,
CA, USA; Supplementary Material 4 and 5: Fig. S1 and
S2). Network analysis showed that cytokines exhibiting increased levels in response to etoposide-induced chemomobilization were associated with the activation of matrix
metalloproteinases (MMPs), which affect the CXCR4/
SDF-1 axis, and are known to be involved in HSC
mobilization [34, 35]. Therefore, the expression of MMPs
related to HSC mobilization, i.e., MMP2 and MMP9, was
assessed. In the PB, the expression of MMP2, MMP9, and
SDF-1 did not differ significantly among groups (G-CSFonly, n = 4; cyclophosphamide chemo-mobilization, n = 4;
etoposide chemo-mobilization, n = 4). However, in the
BM, MMP9 expression was significantly increased and
SDF-1 expression was significantly decreased in the
etoposide-induced chemo-mobilization group, compared
to that in the other groups (G-CSF-only, n = 7; cyclophosphamide + G-CSF, n = 7; etoposide + G-CSF, n = 7; Fig. 6).
Discussion
Our retrospective analysis of clinical data showed that
etoposide-induced chemo-mobilization results in the
highest yield of CD34+ cells among all three groups analyzed, despite relatively modest changes in PB WBC
counts. To our knowledge, this is the first analysis of
clinical data pertaining to etoposide-induced chemomobilization. This study suggests the possibility of a different mechanism for chemo-mobilization by etoposide.
Our in vitro experiments showed that etoposide significantly increased the secretion of IL-8 by hBMSCs,
whereas cyclophosphamide did not. IL-8 is a part of the
senescence-associated secretory phenotype; therefore,
this finding might be associated with the specific influence of etoposide on hBMSC subcultures, which was not
observed upon treatment with cyclophosphamide. This
finding might provide a clue to explain the higher efficiency of etoposide at inducing chemo-mobilization
compared to that of cyclophosphamide. Studies by Pelus
et al. and Fukuda et al. support this hypothesis by showing that the CXCR2 ligand GRO-β rapidly mobilizes
HSCs and enhances engraftment, although the
Page 11 of 15
underlying mechanism has not yet been elucidated [36].
Moreover, we had previously reported that CXCR2 (an
IL-8 receptor) stimulation is crucial for maintaining the
proliferation of human pluripotent stem cells (hPSCs)
[34, 35]. Therefore, we hypothesized that IL-8 activates
the proliferation of hHSCs in a manner similar to that of
hPSCs, resulting in more efficient mobilization. To confirm this hypothesis, we performed an in vitro experiment to determine the effect of IL-8 on hHSCs in a
simulated BM environment using conditioned medium
from healthy hBMSCs; we observed an expansion of
CD34+ and CD34+/CD45- cells. We also observed the
concomitant significant enhancement in CXCR2, mTOR,
and c-MYC expression in CD34+ cells following IL-8
stimulation.
Our finding that IL-8 stimulated CXCR2 and mTOR
expression is consistent with the results of our studies
on hPSCs [37], and with the observation that mTOR activates c-MYC [38]. With respect to the role of c-MYC
in hematopoiesis, Wilson et al. reported that c-MYC
controls the balance between stem cell self-renewal and
differentiation, presumably by regulating the interaction
between HSCs and their niche [39]. Laurenti et al. demonstrated that the loss of c-MYC alone resulted in the
inability of HSCs to differentiate into progenitors; furthermore, the majority of the early and late progenitors
stopped proliferating, resulting in HSC accumulation in
the BM niche [40]. A study by Ehninger et al. showed
that although HSCs express low levels of the c-MYC
protein, its expression increases steadily during progenitor differentiation [41]. In a recent study, it was reported
that IL-8 activates mTOR and increases endogenous cMYC production, thereby inducing PDL1 expression in
gastric cancer [42]. In the present study, IL-8 significantly increased not only the number of CD34+ cells but
also that of CD34+/CD45- cells. The results of our previous studies that demonstrated the role of CXCR2 in
supporting hPSC proliferation [34, 35], suggest that the
activation of CXCR2 by IL-8 may have enhanced hHSC
proliferation; however, further studies are necessary to
confirm this hypothesis. Therefore, etoposide may induce IL-8 secretion from hBMSCs, which stimulates
CXCR2 in HSCs, thereby activating mTOR and c-MYC
and leading to HSCs proliferation and progenitor cell
differentiation. To our knowledge, this is the first HSC
mobilization study to report such a mechanism. Furthermore, this mechanism may also explain the excellent
yield at PBSCC during chemo-mobilization induced
using etoposide that was also associated with a modest
change in WBC count in the PB.
In clinical practice, it is difficult to observe changes in
the BM niche in patients undergoing PBSCC. Moreover,
cytokine measurements in the PB do not always accurately
reflect levels in the BM niche due to systemic confounding
Kang et al. BMC Cancer
(2020) 20:619
Page 12 of 15
Fig. 6 Matrix metalloprotease (MMP) 2, MMP9, and stromal cellderived factor-1 (SDF-1) expression in the mouse model of peripheral
blood hematopoietic stem cell mobilization. a MMP2, MMP9, and SDF1 expression in the peripheral blood did not differ significantly among
the groups (G-CSF only, n = 4; cyclophosphamide + G-CSF, n = 4;
etoposide + G-CSF, n = 4). b, c, d In the bone marrow, the etoposide +
G-CSF group showed a significant increase in MMP9 and decrease in
SDF-1 expression, compared to the G-CSF only and cyclophosphamide
+ G-CSF groups (G-CSF only, n = 7; cyclophosphamide + G-CSF, n = 7;
etoposide + G-CSF, n = 7). Note: ** p < 0.01 after Bonferroni correction;
* p < 0.05 after Bonferroni correction. Note: Values are reported as the
mean ± SEM. Abbreviations: G-CSF, granulocyte colony-stimulating
factor; CY, cyclophosphamide; ETO, etoposide; n.s., not significant
factors. To overcome these obstacles, we established standardized animal mobilization models that excluded such
confounding factors. We were able to simulate the cyclophosphamide and etoposide mobilization patterns observed
in clinical practice in two distinct mouse models. Using
these models, we confirmed the significantly increased expression of IL-8 homologs and MMP9 and decreased expression of SDF-1 in the BM during etoposide-induced
chemo-mobilization, compared to that during G-CSF onlyand cyclophosphamide-induced chemo-mobilization. The
levels of IL-8 homologs in the PB during G-CSF-induced
mobilization were comparable to those during etoposideinduced chemo-mobilization. Watanabe et al. had previously reported that G-CSF increased the WBC counts and
IL-8 levels during mobilization. Increased IL-8 levels were
correlated with higher numbers of CD34+ cells in the PB
[43]. G-CSF was associated with polymorphonuclear neutrophils, which leads to increased IL-8 levels, and potentially, mobilization [44–46]. Moschella et al. had reported
that cyclophosphamide induced the transcriptional modulation of PB MNCs and IFN-1-related sterile inflammatory
responses. In that study, the levels of IL-8, an IFN-1induced proinflammatory mediator in the PB [47], also increased significantly. Thus, inflammatory response could be
the reason underlying the increase in IL-8 levels in the PB
after etoposide treatment; however, few studies have addressed this issue [48, 49]. Previous studies have reported
that IL-8 is produced by phagocytes and mesenchymal cells
exposed to inflammatory stimuli [50], and that etoposide
affects the BMSCs [16, 51]. Therefore, increased IL-8 levels
in the PB may be due to inflammatory responses as well as
hBMSCs. Additionally, IL-8 may enhance MMP9 production [52], leading to SDF-1 degradation and subsequent
mobilization [34, 53, 54]. The results of our animal study
revealed that etoposide increases the expression of IL-8 homologs (KC, MIP-2, and LIX) and MMP9 and decreases
SDF-1 expression in the BM, although the levels of these
molecules in the PB were similar in all the groups. These
findings suggested that the origin of IL-8 in the PB during
etoposide-induced chemo-mobilization was predominantly
the BM niche rather than systemic inflammation.
Kang et al. BMC Cancer
(2020) 20:619
Synthetically, etoposide stimulated hBMSCs to secrete IL-8,
which activated CXCR2, mTOR, and c-MYC in the HSCs,
resulting in their proliferation. Moreover, MMP9 levels increased and SDF-1 decreased in the BM niche, resulting in
HSC mobilization.
The results of this study demonstrate that etoposide
causes long-term hBMSC toxicity associated with cellcycle arrest at the G0/G1 phase. Hare et al. had reported
that exposure of hBMSCs to sub-lethal doses of etoposide resulted in an increased proportion of cells arrested
at the G0/G1 phase [55]. Moreover, BMSCs could not
activate non-homologous end-joining repair following
etoposide-induced stress after successive passages [55].
Clinical data also suggest that the toxicity of etoposide
in the BM niche is higher and lasts longer than that of
cyclophosphamide [9, 10]. However, currently no definitive data are available regarding the adverse effects of
etoposide on engraftment or survival. Studies on this
topic need to be conducted in future.
Our present study has several limitations, the first of
which is the absence of plerixafor + G-CSF, which can
induce adequate of the HSCs mobilization with less toxicity. There are two reasons for proceeding without including plerixafor + G-CSF, i.e., (1) plerixafor is often
difficult to use clinically in some countries at it is expensive, and (2) the mechanism of action of plerixafor is
relatively well-known. For these reasons, we focused on
comparing three chemo-mobilization methods (G-CSF
only, cyclophosphamide + G-CSF, or etoposide + GCSF) that have been used in clinical practice but whose
mechanisms of action are unclear. Second, this study focused predominantly on cytokine or enzyme changes in
the BM niche rather than systemic inflammation because previous studies have generally assessed the role
of systemic inflammation in mobilization; moreover, we
suspected that the effect of etoposide on the BM niche
might be the main mechanism underlying HSC
mobilization. To this end, we used healthy hBMSCconditioned medium that reflects the environment of
the normal BM niche, for culturing the CD34+ hHSCs.
A study design investigating both the aspects of
mobilization would be very complex. Nevertheless, to
our knowledge, this is the first study on the mechanism
of etoposide-induced chemo-mobilization that focuses
on the BM niche. Additionally, this study describes the
establishment of the first mouse model of etoposideinduced chemo-mobilization that reflects the conditions
encountered in clinical practice.
Conclusion
In conclusion, etoposide-induced chemo-mobilization is
highly effective for harvesting HSCs from the PB. The
mechanism of action of etoposide is associated with increased IL-8 secretion by hBMSCs, which induces the
Page 13 of 15
expansion of HSCs in a manner dependent on CXCR2,
mTOR, and c-MYC activation as well as increase and
decrease of MMP9 and SDF-1 levels, respectively in the
BM niche. Finally, our results suggest that etoposide
exposure should be minimized before and after PBSCT
because of its long-term toxicity to hBMSCs. These findings emphasize the need for further studies to develop
more efficient and safe chemo-mobilization strategies.
Supplementary information
Supplementary information accompanies this paper at />1186/s12885-020-07102-x.
Additional file 1.
Additional file 2.
Additional file 3.
Additional file 4.
Additional file 5.
Additional file 6.
Abbreviations
Auto-PBSCT: Autologous peripheral blood stem cell transplantation;
BM: Bone marrow; CFU: Colony-forming unit; Cmax: Maximum reported
serum concentration; G-CSF: Granulocyte colony-stimulating factor;
hBMSCs: Human bone marrow stromal cells; hHSCs: Human hematopoietic
stem cells; HPC: Hematopoietic progenitor cells; hPSC: Human pluripotent
stem cell; IHC: Immunohistochemical; KC: Keratinocyte-derived cytokine;
LIX: Lipopolysaccharide-inducible CXC chemokine; MIP-2: Macrophage
inflammatory protein 2; MMP: Matrix metalloproteinase; MMP2: Matrix
metalloproteinase-2; MMP9: Matrix metalloprotease-9; MNC: Mononuclear
cells; NHL: Non-Hodgkin’s lymphoma; PB: Peripheral blood; PBSCC: Peripheral
blood stem cell collection; SDF-1: Stromal cell-derived factor-1; WBC: White
blood cell
Acknowledgements
Not applicable.
Authors’ contributions
B.S.K. designed the study. K.W.K., S.J.L., and J.H.K. performed the experiments.
B.H.L., S.J.K., Y.P., and B.S.K. critically reviewed the data analysis. K.W.K.
analyzed the data. K.W.K. and B.S.K. wrote the manuscript. All authors
approved the final version of the manuscript.
Funding
This research was supported by a grant from the Korea Health Technology
R&D Project from the Korea Health Industry Development Institute (KHIDI),
funded by the Ministry of Health & Welfare, South Korea (Grant number:
HI17C2072). The funding bodies had no role in the design of the study, data
collection, analysis, interpretation of data or writing the manuscript.
Availability of data and materials
All data generated or analyzed during this study are included in this
published article and its supplementary information files.
Ethics approval and consent to participate
A retrospective chart review of patients was approved by an internal board
of the Korea University Anam Hospital (IRB No. 2019AN0386) and the
Samsung Medical Center (IRB No. 2019–09–085-001), and the requirement
for informed consent was waived by each institutional review board. All the
procedures for primary hBMSC culture were approved by the internal review
board of the Korea University Anam Hospital (IRB No. 2015AN0267), and
informed consent was obtained from all individual participants. All
experimental procedures using animals complied with the guidelines of the
Laboratory Animal Research Center of the Korea University College of
Medicine (IRB No. KOREA-2017-0176).
Kang et al. BMC Cancer
(2020) 20:619
Consent for publication
Not applicable.
Competing interests
The authors declare that they have no competing interests.
Author details
1
Division of Hematology-Oncology, Department of Internal Medicine, Korea
University School of Medicine, 73, Goryeodae-ro, Seongbuk-gu, Seoul 02841,
South Korea. 2Institute of Stem Cell Research, Korea University, Seoul, South
Korea. 3Department of Biomedical and Science, Graduate School of Medicine,
Korea University, Seoul, South Korea. 4Division of Hematology-Oncology,
Department of Internal Medicine, Sungkyunkwan University School of
Medicine, Seoul, South Korea.
Received: 22 January 2020 Accepted: 23 June 2020
References
1. Duhrsen U, Villeval JL, Boyd J, Kannourakis G, Morstyn G, Metcalf D. Effects
of recombinant human granulocyte colony-stimulating factor on
hematopoietic progenitor cells in cancer patients. Blood. 1988;72:2074–81.
2. Pavone V, Gaudio F, Guarini A, Perrone T, Zonno A, Curci P, et al.
Mobilization of peripheral blood stem cells with high-dose
cyclophosphamide or the DHAP regimen plus G-CSF in non-Hodgkin's
lymphoma. Bone Marrow Transplant. 2002;29:285–90.
3. Haverkos BM, Huang Y, Elder P, O'Donnell L, Scholl D, Whittaker B, et al. A
single center's experience using four different front line mobilization
strategies in lymphoma patients planned to undergo autologous
hematopoietic cell transplantation. Bone Marrow Transplant. 2017;52:561–6.
4. Cottler-Fox MH, Lapidot T, Petit I, Kollet O, DiPersio JF, Link D, et al. Stem cell
mobilization. Hematol Am Soc Hematol Educ Program. 2003;2003:419–37.
5. Levesque JP, Hendy J, Takamatsu Y, Simmons PJ, Bendall LJ. Disruption of
the CXCR4/CXCL12 chemotactic interaction during hematopoietic stem cell
mobilization induced by GCSF or cyclophosphamide. J Clin Invest. 2003;111:
187–96.
6. de Mel S, Chen Y, Lin A, Soh TG, Ooi M, Yap ES, et al. Vinorelbinecyclophosphamide compared to cyclophosphamide in peripheral blood
stem cell mobilization for multiple myeloma. Hematol Oncol Stem Cell Ther.
2018;11:225–32.
7. Jantunen E, Putkonen M, Nousiainen T, Pelliniemi TT, Mahlamaki E, Remes K.
Low-dose or intermediate-dose cyclophosphamide plus granulocyte
colony-stimulating factor for progenitor cell mobilisation in patients with
multiple myeloma. Bone Marrow Transplant. 2003;31:347–51.
8. Reiser M, Josting A, Draube A, Mapara MY, Scheid C, Chemnitz J, et al.
Successful peripheral blood stem cell mobilization with etoposide (VP-16) in
patients with relapsed or resistant lymphoma who failed cyclophosphamide
mobilization. Bone Marrow Transplant. 1999;23:1223–8.
9. Milone G, Leotta S, Battiato K, Murgano P, Mercurio S, Strano A, et al.
Intermediate dose etoposide plus G-CSF 16 g/kg is more effective than
cyclophosphamide 4 g/m (2) plus G-CSF 10 g/kg in PBSC mobilization of
lymphoma patients. Leuk Lymphoma. 2007;48:1950–60.
10. Hyun SY, Cheong JW, Kim SJ, Min YH, Yang DH, Ahn JS, et al. High-dose
etoposide plus granulocyte colony-stimulating factor as an effective
chemomobilization regimen for autologous stem cell transplantation in
patients with non-Hodgkin lymphoma previously treated with CHOP-based
chemotherapy: a study from the consortium for improving survival of
lymphoma. Biol Blood Marrow Transplant. 2014;20:73–9.
11. Wood WA, Whitley J, Goyal R, Brown PM, Sharf A, Irons R, et al. Effectiveness
of etoposide chemomobilization in lymphoma patients undergoing autoSCT. Bone Marrow Transplant. 2013;48:771–6.
12. Wood WA, Whitley J, Moore D, Sharf A, Irons R, Rao K, et al.
Chemomobilization with etoposide is highly effective in patients with
multiple myeloma and overcomes the effects of age and prior therapy. Biol
Blood Marrow Transplant. 2011;17:141–6.
13. Park Y, Kim DS, Jeon MJ, Lee BH, Yu ES, Kang KW, et al. Single-dose
etoposide is an effective and safe protocol for stem cell mobilization in
patients with multiple myeloma. J Clin Apher. 2019. />jca.21734.
Page 14 of 15
14. Kollmannsberger C, Beyer J, Droz JP, Harstrick A, Hartmann JT, Biron P, et al.
Secondary leukemia following high cumulative doses of etoposide in patients
treated for advanced germ cell tumors. J Clin Oncol. 1998;16:3386–91.
15. Relling MV, Boyett JM, Blanco JG, Raimondi S, Behm FG, Sandlund JT, et al.
Granulocyte colony-stimulating factor and the risk of secondary myeloid
malignancy after etoposide treatment. Blood. 2003;101:3862–7.
16. Gibson LF, Fortney J, Landreth KS, Piktel D, Ericson SG, Lynch JP. Disruption
of bone marrow stromal cell function by etoposide. Biol Blood Marrow
Transplant. 1997;3:122–32.
17. Tay J, Levesque JP, Winkler IG. Cellular players of hematopoietic stem cell
mobilization in the bone marrow niche. Int J Hematol. 2017;105:129–40.
18. Livak KJ, Schmittgen TD. Analysis of relative gene expression data using realtime quantitative PCR and the 2−ΔΔCT method. Methods. 2001;25:402–8.
19. Morrison SJ, Wright DE, Weissman IL. Cyclophosphamide/granulocyte
colony-stimulating factor induces hematopoietic stem cells to proliferate
prior to mobilization. Proc Natl Acad Sci U S A. 1997;94:1908–13.
20. Varghese F, Bukhari AB, Malhotra R, De A. IHC profiler: an open source plugin for
the quantitative evaluation and automated scoring of immunohistochemistry
images of human tissue samples. PLoS One. 2014;9:e96801.
21. Grigg AP, Roberts AW, Raunow H, Houghton S, Layton JE, Boyd AW, et al.
Optimizing dose and scheduling of filgrastim (granulocyte colonystimulating factor) for mobilization and collection of peripheral blood
progenitor cells in normal volunteers. Blood. 1995;86:4437–45.
22. Lack NA, Green B, Dale DC, Calandra GB, Lee H, MacFarland RT, et al. A
pharmacokinetic-pharmacodynamic model for the mobilization of CD34+
hematopoietic progenitor cells by AMD3100. Clin Pharmacol Ther. 2005;77:
427–36.
23. Abraham M, Biyder K, Begin M, Wald H, Weiss ID, Galun E, et al. Enhanced
unique pattern of hematopoietic cell mobilization induced by the CXCR4
antagonist 4F-benzoyl-TN14003. Stem Cells. 2007;25:2158–66.
24. Morrison SJ, Scadden DT. The bone marrow niche for haematopoietic stem
cells. Nature. 2014;505:327–34.
25. Balasubramanian P, Desire S, Panetta JC, Lakshmi KM, Mathews V, George B, et al.
Population pharmacokinetics of cyclophosphamide in patients with thalassemia
major undergoing HSCT. Bone Marrow Transplant. 2012;47:1178–85.
26. Hassan M, Ljungman P, Ringden O, Hassan Z, Oberg G, Nilsson C, et al. The
effect of busulphan on the pharmacokinetics of cyclophosphamide and its
4-hydroxy metabolite: time interval influence on therapeutic efficacy and
therapy-related toxicity. Bone Marrow Transplant. 2000;25:915–24.
27. Wurthwein G, Klingebiel T, Krumpelmann S, Metz M, Schwenker K, Kranz K,
et al. Population pharmacokinetics of high-dose etoposide in children
receiving different conditioning regimens. Anti-Cancer Drugs. 2002;13:101–10.
28. Mross K, Bewermeier P, Kruger W, Stockschlader M, Zander A, Hossfeld DK.
Pharmacokinetics of undiluted or diluted high-dose etoposide with or
without busulfan administered to patients with hematologic malignancies. J
Clin Oncol. 1994;12:1468–74.
29. Laterveer L, Lindley IJ, Hamilton MS, Willemze R, Fibbe WE. Interleukin-8
induces rapid mobilization of hematopoietic stem cells with radioprotective
capacity and long-term myelolymphoid repopulating ability. Blood. 1995;85:
2269–75.
30. Fibbe WE, Pruijt JF, Velders GA, Opdenakker G, van Kooyk Y, Figdor CG, et al.
Biology of IL-8-induced stem cell mobilization. Ann N Y Acad Sci. 1999;872:
71–82.
31. Hol J, Wilhelmsen L, Haraldsen G. The murine IL-8 homologues KC, MIP-2,
and LIX are found in endothelial cytoplasmic granules but not in WeibelPalade bodies. J Leukoc Biol. 2010;87:501–8.
32. Singer M, Sansonetti PJ. IL-8 is a key chemokine regulating neutrophil
recruitment in a new mouse model of Shigella- induced colitis. J Immunol.
2004;173:4197–206.
33. Hang L, Frendeus B, Godaly G, Svanborg C. Interleukin-8 receptor knockout
mice have subepithelial neutrophil entrapment and renal scarring following
acute pyelonephritis. J Infect Dis. 2000;182:1738–48.
34. Fibbe WE, Pruijt JF, van Kooyk Y, Figdor CG, Opdenakker G, Willemze R. The
role of metalloproteinases and adhesion molecules in interleukin-8-induced
stem-cell mobilization. Semin Hematol. 2000;37:19–24.
35. Shirvaikar N, Marquez-Curtis LA, Janowska-Wieczorek A. Hematopoietic stem
cell mobilization and homing after transplantation: the role of MMP-2,
MMP-9, and MT1-MMP. J Biochem Res Intnl. 2012;2012:11.
36. Pelus LM, Fukuda S. Peripheral blood stem cell mobilization: the CXCR2
ligand GRObeta rapidly mobilizes hematopoietic stem cells with enhanced
engraftment properties. Exp Hematol. 2006;34(8):1010–20.
Kang et al. BMC Cancer
(2020) 20:619
37. Jung JH, Kang KW, Kim J, Hong SC, Park Y, Kim BS. CXCR2 inhibition in
human pluripotent stem cells induces predominant differentiation to
mesoderm and endoderm through repression of mTOR, beta-catenin, and
hTERT activities. Stem Cells Dev. 2016;25:1006–19.
38. Luo G, Li B, Duan C, Cheng Y, Xiao B, Yao F, et al. cMyc promotes
cholangiocarcinoma cells to overcome contact inhibition via the mTOR
pathway. Oncol Rep. 2017;38:2498–506.
39. Wilson A, Murphy MJ, Oskarsson T, Kaloulis K, Bettess MD, Oser GM, et al. CMyc controls the balance between hematopoietic stem cell self-renewal
and differentiation. Genes Dev. 2004;18:2747–63.
40. Laurenti E, Varnum-Finney B, Wilson A, Ferrero I, Blanco-Bose WE, Ehninger
A, et al. Hematopoietic stem cell function and survival depend on c-Myc
and N-Myc activity. Cell Stem Cell. 2008;3:611–24.
41. Ehninger A, Boch T, Uckelmann H, Essers MA, Mudder K, Sleckman BP, et al.
Posttranscriptional regulation of c-Myc expression in adult murine HSCs
during homeostasis and interferon-alpha-induced stress response. Blood.
2014;123:3909–13.
42. Sun L, Wang Q, Chen B, Zhao Y, Shen B, Wang H, et al. Gastric cancer
mesenchymal stem cells derived IL-8 induces PD-L1 expression in gastric
cancer cells via STAT3/mTOR-c-Myc signal axis. Cell Death Dis. 2018;9:928.
43. Watanabe T, Kawano Y, Kanamaru S, Onishi T, Kaneko S, Wakata Y, et al.
Endogenous interleukin-8 (IL-8) surge in granulocyte colony-stimulating
factor-induced peripheral blood stem cell mobilization. Blood. 1999;93:
1157–63.
44. Cassatella MA, Bazzoni F, Ceska M, Ferro I, Baggiolini M, Berton G. IL-8
production by human polymorphonuclear leukocytes. The chemoattractant
formyl-methionyl-leucyl-phenylalanine induces the gene expression and
release of IL-8 through a pertussis toxin-sensitive pathway. J Immunol. 1992;
148:3216–20.
45. Cassatella MA. The production of cytokines by polymorphonuclear
neutrophils. Immunol Today. 1995;16:21–6.
46. Pruijt JF, Verzaal P, van Os R, de Kruijf EJ, van Schie ML, Mantovani A, et al.
Neutrophils are indispensable for hematopoietic stem cell mobilization
induced by interleukin-8 in mice. Proc Natl Acad Sci U S A. 2002;99:6228–33.
47. Moschella F, Torelli GF, Valentini M, Urbani F, Buccione C, Petrucci MT, et al.
Cyclophosphamide induces a type I interferon–associated sterile
inflammatory response signature in cancer patients' blood cells: implications
for cancer chemoimmunotherapy. Clin Cancer Res. 2013;19:4249–61.
48. Kawagishi C, Kurosaka K, Watanabe N, Kobayashi Y. Cytokine production by
macrophages in association with phagocytosis of etoposide-treated P388
cells in vitro and in vivo. Biochim Biophys Acta. 2001;1541:221–30.
49. Tokarz P, Błasiak J. Role of DNA methylation in colorectal cancer. Postepy
Biochem. 2013;59:267–79.
50. Baggiolini M, Clark-Lewis I. Interleukin-8, a chemotactic and inflammatory
cytokine. FEBS Lett. 1992;307:97–101.
51. Li J, Law HK, Lau YL, Chan GC. Differential damage and recovery of human
mesenchymal stem cells after exposure to chemotherapeutic agents. Br J
Haematol. 2004;127:326–34.
52. Li A, Dubey S, Varney ML, Dave BJ, Singh RK. IL-8 directly enhanced
endothelial cell survival, proliferation, and matrix metalloproteinases
production and regulated angiogenesis. J Immunol. 2003;170:3369–76.
53. Pruijt JF, Fibbe WE, Laterveer L, et al. Prevention of interleukin-8-induced
mobilization of hematopoietic progenitor cells in rhesus monkeys by
inhibitory antibodies against the metalloproteinase gelatinase B (MMP-9).
Proc Natl Acad Sci USA. 1999;96(19):10863–8. />96.19.10863.
54. Jin F, Zhai Q, Qiu L, Meng H, Zou D, Wang Y, et al. Degradation of BM SDF1 by MMP-9: the role in G-CSF-induced hematopoietic stem/progenitor cell
mobilization. Bone Marrow Transplant. 2008;42:581.
55. Hare I, Gencheva M, Evans R, Fortney J, Piktel D, Vos JA, et al. In vitro
expansion of bone marrow derived mesenchymal stem cells alters DNA
double strand break repair of etoposide induced DNA damage. Stem Cells
Intl. 2016;2016:8270464.
Publisher’s Note
Springer Nature remains neutral with regard to jurisdictional claims in
published maps and institutional affiliations.
Page 15 of 15