The predominant expression of cancer stem cell marker ALDH1A3 in tumor infiltrative area is associated with shorter overall survival of human glioblastoma
Bạn đang xem bản rút gọn của tài liệu. Xem và tải ngay bản đầy đủ của tài liệu tại đây (5.46 MB, 12 trang )
Gan et al. BMC Cancer
(2020) 20:672
/>
RESEARCH ARTICLE
Open Access
The predominant expression of cancer
stem cell marker ALDH1A3 in tumor
infiltrative area is associated with shorter
overall survival of human glioblastoma
Chao Gan1,2, Daniela Pierscianek1, Nicolai El Hindy1,3, Yahya Ahmadipour1, Kathy Keyvani4, Ulrich Sure1 and
Yuan Zhu1*
Abstract
Background: ALDH1A3 is a cancer stem cell marker in neoplasms including glioblastoma (GBM). However, the
comprehensive role of ALDH1A3 in GBM remains unclear. This study attempted to investigate the expression of
ALDH1A3 in human GBM tissues and its association with clinical parameters.
Methods: Thirty primary GBM and 9 control were enrolled in this study. ALDH1A3 mRNA and protein expression
levels were detected by RT2-PCR and western blot, respectively. Immunohistochemistry and immunofluorescence
staining were performed to evaluate the regional and cellular expression manner of ALDH1A3. The association of
ALDH1A3 expression with multiple clinical parameters was analyzed.
Results: ALDH1A3 protein level, but not mRNA level, in a subgroup of GBM was significantly higher than that in
the control group. ALDH1A3 immunoreactivity was detected heterogeneously in individual GBMs. Fifteen of 30
cases showed a positive of ALDH1A3 immunoreactivity which was predominantly observed in the tumor infiltrative
area (TI). Double immunofluorescence staining revealed a co-localization of ALDH1A3 with GFAP in glial-shaped
cells and in tumor cells. ALDH1A3 immunoreactivity was often merged with CD44, but not with CD68. Moreover,
ALDH1A3 expression was positively associated with the tumor edema grade and inversely with overall survival (OS)
(median OS: 16 months vs 10 months), but with neither MGMT promoter methylation status nor Ki67 index in GBM.
An upregulation of ALDH1A3 was accompanied by a reduced expression of STAT3β and p-STAT3β.
Conclusions: Inter- and intra-tumoral heterogeneous expression of ALDH1A3 was exhibited in GBMs. A high
immunoreactivity of ALDH1A3 in tumor infiltrative area was associated with shorter OS, especially in patients with
MGMT promoter methylation. Our findings propose ALDH1A3 not only as a predictive biomarker but also as a
potential target for personalized therapy of GBM.
Keywords: Primary glioblastoma, ALDH1A3, Cancer stem cell marker, Overall survival, Peritumoral edema
* Correspondence:
1
Department of Neurosurgery and Spine Surgery, University hospital Essen,
University of Duisburg-Essen, Hufelandstrasse 55, 45122 Essen, Germany
Full list of author information is available at the end of the article
© The Author(s). 2020 Open Access This article is licensed under a Creative Commons Attribution 4.0 International License,
which permits use, sharing, adaptation, distribution and reproduction in any medium or format, as long as you give
appropriate credit to the original author(s) and the source, provide a link to the Creative Commons licence, and indicate if
changes were made. The images or other third party material in this article are included in the article's Creative Commons
licence, unless indicated otherwise in a credit line to the material. If material is not included in the article's Creative Commons
licence and your intended use is not permitted by statutory regulation or exceeds the permitted use, you will need to obtain
permission directly from the copyright holder. To view a copy of this licence, visit />The Creative Commons Public Domain Dedication waiver ( applies to the
data made available in this article, unless otherwise stated in a credit line to the data.
Gan et al. BMC Cancer
(2020) 20:672
Background
Glioblastoma (GBM), the most common primary malignant brain tumor in adults, is genetically and histopathologically highly heterogeneous. A median survival period
is 15 months despite the advanced treatment including
surgical resection and chemoradiotherapy [1]. Increasing
evidence suggests that cancer stem cells (CSCs) are crucial
for tumorigenesis, therapeutic resistance and recurrence
in GBM [2, 3]. Given that subventricular zone (SVZ) consists of enriched neural stem cells that possess the capacity
to generate neurons and glia throughout adulthood [4, 5].
Gliomas are thus often presumed being initiated by neural
stem cells in SVZ [6–8]. Indeed, expression of multiple
CSC markers in GBM is negatively associated with overall
survival in GBM patients [9, 10]. Therefore, targeting
CSCs is considered as a promising therapeutic strategy.
Aldehyde dehydrogenases (ALDHs) are a group of enzymes consisting of 19 isoforms. Besides the metabolic
functions [11, 12], high ALDH activity is considered as a
hallmark of CSCs in various cancers [13]. Targeting
ALDH inhibits the proliferation of GBM tumor cells and
CSCs [14]. ALDH1A3 is the most upregulated between
ALDH high and low subgroups of glioma cells among
19 isoform of ALDH family [15]. ALDH1A3 prominently
emerges as a CSC marker to be targeted in multiple neoplasms [16–18]. Of note, ALDH1A3 is enriched in mesenchymal subtype (MES) of GBM patients, thereby
being a sensitive and specific marker for MES GBM subtype [15]. ALDH1A3 is crucial for transition from
proneural-CSCs to MES-CSC and is important for the
maintenance of MES subtype [19]. Besides, ALDH1A3
plays also important roles in regulating self-renewal, differentiation and chemo/radio-resistance [20].
Most of the studies of ALDH1A3 expression in dataset
were performed at transcriptional level by microarray in
GBM. However, the comprehensive association of
ALDH1A3 protein expression with clinical outcome remains
elusive. The present study focused on the investigation of
ALDH1A3 protein expression in a cohort of GBM patients
with emphasis on its regional expression pattern and cellular
localization and on its correlation with clinical parameters.
We also explored the STAT3 and Akt/PTEN signaling cascades which might be involved in the regulation of
ALDH1A3 expression and in its functions in GBM as studied by other entities. Through this study, we anticipate providing a broader perspective on this molecule as a prognostic
biomarker as well as a potential therapeutic target for GBM.
Methods
Patient cohort, magnetic resonance imaging (MRI)-based
edema grading and evaluation of the Karnofsky
performance index (KPI)
Surgical specimens (n = 30) were collected from adult
patients with primary GBM who were treated in the
Page 2 of 12
Department of Neurosurgery at our hospital. All enrolled patients were histopathologically diagnosed with
primary GBM (WHO grade IV). Surgical specimens
from patients who suffered temporal lobe epilepsy and
underwent anterior temporal lobe resections without
histopathological findings were used as control (n = 9).
Tumor edema appears as a region with increased T2
signal intensity outside the gadolinium-enhanced portion. Peritumoral edema is classified into four grades
based on preoperative MRI scans [21]. Briefly, grade zero
reflects no edema on preoperative scans; if edema is seen
as less than, or approximately equal to, or greater than
the tumor itself, the edema is graded as I, II, or III,
respectively.
The preoperative KPI as one of the major prognostic
indicators for GBM survival was used to assess all patients enrolled in the present study.
Evaluation of O6-methylguanine-methyltransferase
(MGMT) promoter methylation and IDH1 mutation
For MGMT promoter methylation analysis, genomic
DNA was isolated from paraffin sections of GBM.
MGMT promoter methylation was analyzed by
methylation-specific PCR as described previously [22].
IDH1-R132H, the most common glioma derived mutation, was determined immuno-histochemically in
paraffin-embedded tumor specimens with a specific antibody as described previously [23].
TCGA database analysis of ALDH1A3 gene expression and
OS dataset in GBM
The data of ALDH1A3 gene expression and its association with OS in 525 GBM cases and 10 normal control
from The Cancer Genome Atlas (TCGA-GBM) were obtained from the GlioVis browser [24]. The gene expression profile was measured using the Affymetrix HT
Human Genome U133a microarray platform. Kaplan–
Meier survival curve was generated to show patient survival status between ALDH1A3 high and low group with
optimal cutoff provided by GlioVis itself.
Real time-reverse transcription-polymerase chain reaction
(RT2-PCR)
The extraction of total RNA (Qiagen, Hilden) and cDNA
synthesis (Bio-Rad, Munich) were performed according to
the manufacturer’s instructions. The primer sequences
and annealing temperatures are listed in Table 1. The following condition was used for real-time PCR: initial denaturation at 95 °C for 2 min, 35–45 cycles of
amplification at 95 °C for 5 s and at annealing temperature
for 25 s. Melting curve was obtained using the following
settings: 95 °C for 1 min, and 55 °C for 1 min, and 55–
95 °C with a heating increase rate of 0.5 °C every 10 s.
Relative mRNA expression (fold change) was calculated
Gan et al. BMC Cancer
(2020) 20:672
Page 3 of 12
Table 1 Primer sequences and annealing temperatures for realtime reverse-transcription PCR (RT2-PCR)
Primer
name
Sequence
Annealing temperature
(°C)
Nestin
62
for.
CTCCAAGAATGGAGGCTG
TAGGAA
rev.
CCTATGAGATGGAGCAGG
CAAGA
CD133
60
for.
CAGAAGGCATATGAATCC
rev.
CACCACATTTGTTACAGC
CD44
CCCAGATGGAGAAAGCTCTG
rev.
ACTTGGCTTTCTGTCCTCCA
YKL40
63
for.
GACCACAGGCCATCACAGTCC
rev.
TGTACCCCACAGCATAGTCAGT
GTT
ALDH1A3
60
for.
TCTCGACAAAGCCCTGAAGT
rev.
TATTCGGCCAAAGCGTATTC
OLIG2
60
for.
CTCCTCAAATCGCATCCAGA
rev.
AGAAAAAGGTCATCGGGCTC
SOX2
for.
rev.
Double immunofluorescence staining and imaging
60
for.
scored as 0–3: 0 = negative; 1 = weak; 2 = moderate; 3 =
strong. The percentage of positive cells in microscopic images (magnification × 200) was counted using ImageJ, and
four categories (0–3) were defined: category 0, < 1%; category 1, 1–5%; category 2, 5–10%; category 3, > 10%. The
immunoreactive score (IRS) was calculated using the following formula: the score of the immuno-intensity × the
score of positive percentage. According to IRS, the patients were classified to three groups: negative/low: IRS ≤
2; medium: IRS > 2; and high: IRS ≥ 6.
64
ACCGGCGGCAACCAGAAG
AACAG
GCGCCGCGGCCGGTATTTAT
for. forward, rev. reverse
according to the cycle threshold approach (2-ΔΔCT
method), and normalized to the reference gene GAPDH
as described [25].
Immunohistochemistry staining and analysis
Immunohistochemistry was performed on formalin-fixed
and paraffin-embedded (FFPE) GBM sections (n = 30).
Briefly, after deparaffinization in gradient ethanol, heatinduced epitope retrieval and blocking the unspecific
binding, sections were incubated with rabbit antiALDH1A3 primary antibody (1:250, Novus Biologicals)
overnight at 4 °C. After the incubation with a HRPconjugated secondary antibody (1:1000, Cell Signaling
Technology), the sections were incubated with the substrate 3,3’-diaminobenzidine kit (Invitrogen) followed by
hematoxylin counter staining. Negative control staining
was done omitting primary antibody instead of a nonspecific rabbit immunoglobulin fraction (DAKO).
The ALDH1A3 immunoreactivity in all stained sections
was quantified according to previous description [26].
Briefly, the intensity of ALDH1A3 immunoreactivity was
For FFPE tissue sections, deparaffinization, heat-induced
epitope retrieval, and blocking steps were performed as
described previously [22]. Thereafter, the sections were
incubated overnight at 4 °C in the primary antibody mixtures containing rabbit anti-ALDH1A3 (1:250) and a cell
type specific marker antibody, i.e., mouse anti-GFAP (1:
250, Sigma Aldrich) or mouse anti-CD68 (1:100, gift
from Neuropathology in our hospital) or rat anti-CD44
(1:100, Invitrogen). The sections were incubated with
the mixture of biotinylated goat anti-rabbit IgG and
Texas red conjugated horse anti-mouse IgG at room
temperature for 1 h followed by the substrate reaction
with FITC-conjugated avidin. Counter staining was done
with Hoechst-33,342. Images were acquired using Axio
Imager M2 microscope (Zeiss) with the ApoTome.2 system for optical sections.
Western blot
Total protein extraction and electrophoresis were performed as before [21]. The primary antibody reaction
was done overnight at 4 °C with the following primary
antibodies (excepting ALDH1A3 antibody, all from Cell
Signaling Technology): anti-ALDH1A3 (1:1000, Novus
Biologicals), anti-STAT3 (1:1000), anti-phospho-STAT3
(Tyr705) (p-STAT3) (1:2000), anti-GAPDH (1:1000),
anti-phospho-Akt (Ser437) (p-Akt) (1:1000), anti-PTEN
(1:1000). After the second antibody reaction, the blots
were incubated with ECL solution (GE Healthcare) and
the image was acquired by using ImageQuant LAS 500
(GE Healthcare, Freiburg).
Statistical analysis
The experimental data were presented as the mean ±
standard deviation (SD). All statistical analysis were performed using the GraphPad Prism 5 and SPSS 23.0. Student t test with Welch’s correction was used for data
analysis between two groups; one way ANOVA followed
by Bonferroni’s multiple comparison test was applied for
multi-group comparison. The survival curve was plotted
using the Kaplan-Meier method and analyzed using logrank test. A P value less than 0.05 was considered statistically significant.
Gan et al. BMC Cancer
(2020) 20:672
Results
Baseline characteristics of patient
The mean age of GBM patients at the first diagnosis was
60.1 ± 13.3 years. The ratio of male to female was 1: 1.1
(14 to16). Among 30 GBMs, 60% (18/30) patient had a
gross total resection of tumor. Twenty-six patients
(86.7%) showed KPI ≥ 70. Fourteen of 30 cases (46.7%)
had a positive methylation status of MGMT promoter.
A R132H point mutation of IDH1 was detected in 3 of
20 cases, whereas IDH mutation information was not
assessed in the other 10 cases. A standard chemoradiotherapy [1] after surgical resection was applied to 63.3%
(19/30) of patients. The mean of OS was 13.3 ± 9.9
months. Given that SVZ is suggested as one of the prognostic factors in GBM [6], GBM patients were grouped
upon their tumor location, whether the tumor contacted
SVZ (+) or not (SVZ−). In 20 of 30 (66.7%) cases GBM
tumors were found at the SVZ+ location.
ALDH1A3 mRNA expression was downregulated in GBM:
TCGA database and own data
Microarray-based TCGA database revealed a statistically
reduced ALDH1A3 mRNA in GBM compared to control
group (P < 0.05, Fig. 1a) and a negative correlation between the ALDH1A3 mRNA and the OS of GBM patients, i.e., higher ALDH1A3 mRNA expression and
shorter OS with optimal cutoff of ALDH1A3 mRNA
value at 4.22 (P < 0.01, Fig. 1b).
To validate the finding from the TCGA datasets, RTPCR was performed and found a significant downregulation of ALDH1A3 mRNA expression in our patient
cohort (P < 0.05, Fig. 1c). To compare SVZ+ GBM with
SVZ− GBM in the matter of CSCs characteristics, not
only ALDH1A3 but also some other known CSC
markers including Nestin, CD133, CD44, YKL40, OLIG2
and SOX2 were examined. Interestingly, the ALDH1A3
mRNA level was 2.59-fold higher in SVZ+ group compared to SVZ−. However, neither ALDH1A3 nor other
detected CSC markers showed significant difference between SVZ+ and SVZ− groups (Fig. 1d).
Characterization of regional and cell type specific
expression of ALDH1A3 in GBM
Immunohistochemistry (IHC) revealed a heterogeneous
expression of ALDH1A3 in different GBM sections and
in the different regions of individual cases. To
characterize its expression pattern upon area of focus,
we classified tumor regions into three: tumor center
(TC), tumor infiltrative area (TI) and tumor distant area
(TD) (Fig. 2a, lines). TI showed a gradually lower tumor
cell density in comparison to TC, whereas TD exhibited
normal cells as well as some scattered tumor cells. An
apparent expression of ALDH1A3 was found in 50% of
GBM specimens (15/30). Figure 2b and c were
Page 4 of 12
representative of a negative and a positive ALDH1A3 expression case, respectively. In the cases showing
ALDH1A3 expression, ALDH1A3 immunoreactivity was
dominantly detected in TI (Fig. 2c, d, g-j), whereas scattered ALDH1A3 positive cells were also found in both
TC (Fig. 2e) and TD (Fig. 2f). For quantitative analysis of
ALDH1A3 expression, IRS was determined upon area of
focus in tumor and classified patient cases into three
subgroups: negative/low (IRS ≤ 2), medium (IRS > 2) and
high (IRS ≥ 6). According to IRS of 30 patient cases, 24,
3 and 3 cases in TC and 15, 4 and 11 in TI were subgrouped, respectively (Fig. 4a), indicating that TI had a
significantly higher expression of ALDH1A3 than TC
(P < 0,001).
We observed ALDH1A3 expression in tumor cells
(Fig. 2g, arrows), in outermost layer cells of some glomeruloid tufts (Fig. 2h, arrows), as well as in vessels
(Fig. 2i, arrows). Some multiple-nucleus cells with
dendritic-like structures (Fig. 2j, arrows) and small
cells displaying glial-shaped morphology (Fig. 2j, arrowheads) also appeared ALDH1A3 positive. Of note,
ALDH1A3 immunoreactivity was not detected in
pseudopalisades (Fig. 2k, arrows) and necrosis centers
(Fig. 2k, asterisk) in all investigated sections in this
study. There was no apparent ALDH1A3 positive cells
in control (Fig. 2l).
In order to identify ALDH1A3 expressing cells, immunofluorescence staining of ALDH1A3 in combination with cell type specific markers was performed.
Some glial-shaped cells and tumor cells were found
double positive for ALDH1A3 and GFAP (Fig. 3a, b,
arrows, respectively). Interestingly, the immunoreactivity of ALDH1A3 and GFAP was merged also in
the dendritic-processed cells (Fig. 3c, arrows) and in
cells with multiple nuclei (Fig. 3d, arrows). Cells expressing ALDH1A3 are often found positive for a
stem cell surface marker CD44 (Fig. 3f, arrows), but
not for a macrophage marker CD68 (Fig. 3e,
arrowheads).
Correlation of ALDH1A3 expression with clinical
parameters
According to IRS of ALDH1A3 in TI, the cohort of
GBM patients was subgrouped as follows: negative/
lower and medium/high expression of ALDH1A3
(Fig. 4a). The association of ALDH1A3 expression
with clinical parameters in each subgroup was analyzed and summarized in Table 2. No statistical significance was found for the correlation of ALDH1A3
expression with all these analyzed parameters except
OS and peritumoral edema. A higher expression of
ALDH1A3 was significantly associated with a shorter
median OS (P < 0.01, HR = 3.170, 95% CI: 1.328–
7.566) (Fig. 4b). The median survival time of patients
Gan et al. BMC Cancer
(2020) 20:672
Page 5 of 12
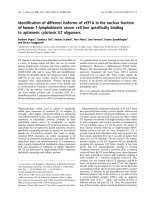
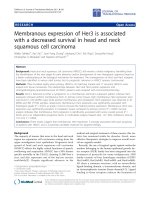
Fig. 1 mRNA expression of ALDH1A3 in GBM. a TCGA database showed a lower expression of ALDH1A3 mRNA in GBM (n = 525) compared with
the control (n = 10). b The higher expression of ALDH1A3 mRNA was associated with the shorter overall survival (OS) of GBM patients at optimal
cutoff based on TCGA database. c mRNA expression of ALDH1A3 detected in the present study by real-time RT-PCR in primary GBM (n = 30) and
control (n = 9) supported the data from TCGA database. d Subgroup analysis of mRNA expression of ALDH1A3 and other stem cell markers in
subventricular zone (SVZ+) and in non-subventricular zone (SVZ−). Student’s t test with Welch’s correction was utilized between two groups in a,
c, d (*P < 0.05)
with medium/high ALDH1A3 expression was 10
months, while that of patients with negative/low
ALDH1A3 group was 16 months. Furthermore, the
higher expression of ALDH1A3 was also associated
with a higher grade of peritumoral edema (P < 0.05,
Fig. 4c). We further analyzed the association of
MGMT promoter methylation status with OS, and
no significant association was found in our patient
cohort. The median survival in both MGMT promoter methylation positive (MGMT+, n = 14) and
negative (MGMT−, n = 14) patients was 12 months.
Next, we also studied association of OS with a combination of MGMT methylation status and
ALDH1A3 expression. Of note, the median survival
in the subgroup of MGMT+ with low ALDH1A3 IRS
was found significantly longer than that in the subgroup of MGMT+ with higher ALDH1A3 IRS (17
months vs 7 months, respectively; P < 0.01). However,
there was no significant difference in OS seen between low and higher ALDH1A3 expression in the
subgroup of MGMT− patients (13.5 months vs 10.5
months).
In addition, Ki67 index, a proliferation parameter, was
16.3 and 17.3% in low and higher ALDH1A3 subgroup,
respectively (Table 2), and appeared as not associated
with ALDH1A3 expression.
Association of the expression of ALDH1A3 and signaling
proteins in GBM
Figure 5a shows representative blots detecting
ALDH1A3, STAT3 and p-STAT3, p-Akt, PTEN and
GAPDH in GBM and in control. Western blot confirmed distinct expression level of ALDH1A3 in subgroups of GBMs (P < 0.01). As expected, an
upregulation of ALDH1A3 was confirmed in the
GBM cases with higher IRS (IRS > 2, lane 6–9),
whereas a low protein level of ALDH1A3 was detected in the GBM cases with lower IRS (IRS ≤ 2, lane
3–5). Semi-quantitative analysis of the blots revealed
a significant upregulation of p-STAT3α, p-STAT3β
and p-Akt accompanied by a downregulation of
PTEN in GBMs compared to control. Interestingly,
the expression of STAT3β (P < 0.01) and p-STAT3β
(P < 0.05), but not STAT3α and p-STAT3α, was
Gan et al. BMC Cancer
(2020) 20:672
Page 6 of 12
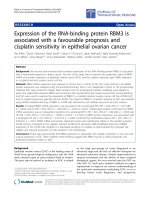
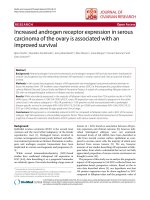
Fig. 2 Immunohistochemistry of ALDH1A3 in GBM. a H&E staining defined the different regions in GBM sections. TC: tumor center; TI: tumor
infiltrative area; and TD: tumor distant area. b, c Immunostaining of ALDH1A3 in GBM sections revealed heterogeneous expression of ALDH1A3 in
different GBM patient sections (n = 30). The representative photos show the absence of ALDH1A3 expression b and the positive expression of
ALDH1A3 c, respectively, in two GBM cases. The positive ALDH1A3 expressing cells were mainly detected in TI, and much less in TC. d-f Images
are representative of the expression of ALDH1A3 in the different regions of GBM tissue. g-k Expression of ALDH1A3 in typical tumor cells (arrows
in g), in out-layer of glomeruloid tufts (arrows in h), in some vessels (arrows in i), in multi-nuclear cells (arrow in j) and in glial-shaped cells
(arrowheads in j). ALDH1A3 immunoreactivity was not detected in the necrosis core (asterisk in k) and the pseudopalisade structure (arrows in k).
l ALDH1A3 immunoreactivity was not detected in the non-tumoral control brain section. a-c, original magnification × 100; d-j, original
magnification × 400; k-l, original magnification × 200
inversely associated with the protein level
ALDH1A3 in two subgroups of GBM (Fig. 5b).
of
Discussion
Increasing evidence indicates ALDH1A3 as an important
molecule that influences a diverse range of biological
processes in CSCs and in tumor cells, thereby being associated with the initiation, progression, and prognosis
of various cancers including GBM [27]. The present
study investigated the expression pattern of ALDH1A3
at both mRNA and protein levels in human GBM specimens with emphasis on its association with clinical parameters of the patients.
Analysis of the microarray based TCGA-GBM dataset
revealed that the mean level of ALDH1A3 mRNA in the
total cohort was lower than that in control. However,
when considered in genomic subtypes of GBM [28, 29],
its mRNA level appeared significantly higher in the MES
than in the classical and proneural subtypes; even in the
MES of GBM, the mean level of ALDH1A3 mRNA was
comparable with that in control (Supplementary Fig. S2).
On the other hand, the TCGA-GBM dataset showed an
inverse association of ALDH1A3 mRNA expression with
OS of GBM. These findings from the TCGA data encouraged us to further investigate implication of
ALDH1A3 in GBM. In the present study, we demonstrated a significant downregulation of ALDH1A3
mRNA expression in our GBM cohort in comparison to
control, consistent with the findings derived from the
TCGA dataset. As the cellular, biological functions of a
Gan et al. BMC Cancer
(2020) 20:672
Page 7 of 12
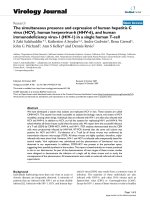
Fig. 3 Double staining of ALDH1A3 with different markers in GBM sections. a-d Double staining of ALDH1A3 with GFAP. In both TC and TI, the
co-expression of ALDH1A3 (green) and GFAP (red) was detected in some glial-shaped cells (arrows in a), tumor cells (arrows in b) and multinucleated cells (arrows in c and d). e Double staining of ALDH1A3 with CD68. ALDH1A3 immunoreactivity (green) detected in the outer layer of
glomeruloid tuft (arrows in e) was negative for the macrophage marker CD68 (red, arrowheads). f Double staining revealed a coexpression
(arrows) of ALDH1A3 (red) with the stem cell marker CD44 (green). a-f, original magnification × 400
molecule are ultimately determined by its translational/
post-translational levels, not by its transcriptional level,
we next focused on ALDH1A3 expression at protein
levels in individual GBM tissues of our cohort. As shown
in Fig. 2l, the immunoreactivity of ALDH1A3 was not
detected in the control (normal) brain tissue. Furthermore, by western blot we also demonstrated a 4.66-fold
higher protein expression of ALDH1A3 in the subgroup
of GBMs with IRS > 2 than that in the control group
(Fig. 5b). These findings allow us to postulate that a
higher mRNA level of ALDH1A3 does not necessarily
refer to its higher protein level. Indeed, several potential
mechanisms regulating the translational and posttranslation of ALDH1A3 have been identified: the hypermethylation status of ALDH1A3 promoter predicts a
low expression of ALDH1A3 protein accompanied by a
better prognosis of GBM patients [30]; USP9X-mediated
deubiquitinase plays an important role in ALDH1A3
protein stabilization [31]; temozolomide (TMZ) treatment at high concentrations does not alter ALDH1A3
mRNA levels, but protein levels through autophagy [32].
Thus, it is more reliable to analyze the association of
clinical parameters with ALDH1A3 protein levels.
GBM tumor is composed of heterogeneous cell
populations including a small population, glioma
CSCs [2], which is related to therapeutic resistance of
GBM [3, 33]. As the subventricular zone (SVZ) is
often proposed to be the source of CSCs [6, 8], we
evaluated mRNA expression levels of ALDH1A3 as
well as other well-known CSC markers including Nestin, CD133, CD44, YKL40, OLIG2, SOX2 in GBM.
Despite a 2.5-fold higher ALDH1A3 mRNA detected
in the SVZ+ group, none of these investigated CSC
markers showed a statistically significant alteration in
mRNA levels (Fig. 1d). These results are consistent
with previous reports [34, 35], the mechanism under
which need to be further investigated.
The ALDH superfamily is the most important aldehyde metabolic enzyme family in human cells and has
been linked to metabolism reprogramming in the
Gan et al. BMC Cancer
(2020) 20:672
Page 8 of 12
Fig. 4 Association of ALDH1A3 expression with clinical parameters.
a Quantitative analysis of ALDH1A3 immunoreactivity in TC and in TI
of GBMs. The immunoreactive score (IRS) was evaluated in TC and TI
as described in the method (n = 30). Based on IRS, TI had a
significantly higher ALDH1A3 expression than TC (P < 0.001). In
according to TI, GBM with IRS ≤ 2 was grouped as negative/low (n =
15), whereas GBM with IRS > 2 was defined as high and medium
group (n = 15). b The association of ALDH1A3 expression with the
OS period of patients. A higher expression of ALDH1A3 was
significantly associated with a shorter OS time. c The representative
MRI images show the different grades of edema. Peritumoral edema
grade II had a higher IRS of ALDH1A3 compared with edema grade
I. Paired t test was performed to compare IRS between TI and TC in
a (***P < 0.001). One way ANOVA followed by Bonferroni’s multiple
comparison test, comparing each column to all the other columns,
was employed for multi-groups comparison in c (*P < 0.05)
initiation, metastasis, and recurrence of cancer [36].
Among the 19 members, the ALDH1A3 isoform has
been served as the major source of total ALDH activity
in GBM [15]. Thus, it is important to check not only
ALDH1A3 mRNA levels but also its protein levels that is
more relevant to its enzymatic activity. Our immunohistochemistry study revealed a distinct expression of
ALDH1A3 in individual GBM patients and a high intertumoral heterogeneity. A clear positive immunoreactivity
of ALDH1A3 was detected only in 15 of 30 (50%)
GBMs. Among these positive cases, 4 and 11 cases
showed medium (IRS > 2) and high (IRS ≥ 6) expression
of ALDH1A3, respectively. ALDH1A3 positive cells were
mostly located at the tumor infiltrative area, suggesting
that ALDH1A3 may participate in tumor cell invasiveness and metastasis. In fact, knockdown of ALDH1A3
expression in vitro models also suppressed cancer cell
invasion in different entities [37, 38]. We demonstrated
that a higher ALDH1A3 IRS was significantly associated
with a short OS. As supporting, the expression of
ALDH1A3 was positively associated with the grade of
peri-tumoral edema that is also a prognostic parameter
for GBM patients [39, 40]. Regardless of treatment,
MGMT promoter methylation is an independent and favorable prognostic factor in GBM [41]. MGMT encodes
a DNA-repair protein that inhibits the effect of treatment through removing alkyl groups from guanine, a
target site for alkylating chemotherapy agents such as
TMZ. MGMT promoter methylation is associated with
higher therapeutic effect of TMZ and longer OS in
GBM patients [42]. However, controversial results are
also observed in several studies [43, 44]. In the present
study, MGMT promoter methylation status was not associated with OS in GBM. Interestingly, when combining MGMT and ALDH1A3 expression together, low
expression of ALDH1A3 may sensitively predict a better
prognosis than those with higher expression of
ALDH1A3 in the subgroup of MGMT+ patients. Hence,
evaluation of ALDH1A3 expression might be a powerful
Gan et al. BMC Cancer
(2020) 20:672
Page 9 of 12
Table 2 Analysis of the association of ALDH1A3 IRS with clinical
parameters
Clinical parameter
Patient ALDH1A3
number
negative/low medium/high
(IRS ≤ 2)
(IRS > 2)
Total patients
30
15
P
15
0,456a
Age
< 60
12
7
5
≥ 60
18
8
10
0,464a
Gender
Male
14
6
8
Female
16
9
7
1,000b
KPI
≥ 70
26
13
13
< 70
4
2
2
0,121a
SVZ
+
20
12
8
−
10
3
7
0,456a
Extent of Resection
GTR
18
8
10
Partial
12
7
5
0,464a
MGMT promotor
methylation
Yes
14
6
8
No
14
9
7
N/A
2
1
1
0,270b
IDH1 mutation
Yes
3
2
1
No
17
5
12
N/A
10
8
2
0,256a
Standard
chemoradiotherapy
Yes
No
Ki67 index (%)
19
11
8
11
4
7
27
16,3 ± 3,1
(n = 12)
17,3 ± 2,0
(n = 15)
0,789c
IRS immunoreactive score, KPI Karnofsky Performance Index, SVZ +/− tumor
contacted to subventricular zone (SVZ+) or contacted to non-subventricular
zone (SVZ−), GTR gross total resection, MGMT O6-methylguaninemethyltransferase, IDH1 isocitrate dehydrogenase 1, N/A not applicable
a
Pearson chi-square test; bFisher’s exact test; cStudent t test with
Welch’s correction
prognostic tool in combination with MGMT promoter
methylation status. IDH1 mutation is another prognostic
maker for GBM. In TCGA database ALDH1A3 mRNA
expression is negatively associated with IDH1 mutation
[15]. In our cohort only 3 of 30 patients were identified
with IDH1 mutation, and nevertheless, we did analysis
of the association of ALDH1A3 expression with IDH1
mutation status. As predicted, no association was found
between the level of ALDH1A3 protein or mRNA with
Fig. 5 Detection of ALDH1A3 and the signaling proteins in GBM by
western blot. a Representative blots detected the expression of
STAT3 and p-STAT3, p-Akt, PTEN and GAPDH in the control (C, lane
1–2) and in GBM cases with lower immunoreactivity score (IRS ≤ 2,
lane 3–5) and with higher immunoreactivity score (IRS > 2, lane 6–9)
(See original images in Supplementary Fig. S1). b Semi-quantification
of the blots. The integrated optical density (IOD) of the individual
bands on blots was measured by ImageJ and the ratio of the target
protein to the housekeeping protein GAPDH was calculated. The
relative expression data were presented when the ratio of the
control group was normalized as 1. One way ANOVA followed by
Bonferroni’s multiple comparison test was employed for multigroups comparison in b. *P < 0.05, **P < 0.01 and ***P < 0.001:
compared with the control (C); #P < 0.05 and ##P < 0.01, compared
with the group “low” (IRS ≤ 2)
IDH1 mutation. Therefore, a larger patient cohort is
needed to verify the association of ALDH1A3 protein
with IDH1 mutation in the future. Finally, we also observed the expression of ALDH1A3 frequently in the
outer layer of different stage of glomeruloid tufts and in
some endothelial cells of tumor vessels. In line with the
pro-angiogenic functions of ALDH1A3 in vitro [45, 46],
our findings by tissue staining also implicate ALDH1A3
in microvascular proliferation and in neo-angiogenesis
in a subgroup of GBM. These clinical associations highlight ALDH1A3 as a potential prognostic biomarker and
Gan et al. BMC Cancer
(2020) 20:672
as a therapeutic target preventing tumor invasion and
angiogenesis.
The TI consists of various cell types including infiltrating tumor cells, CSCs, reactive astrocyte, microglia, oligodendrocytes, inflammatory and immune cells,
endothelial cells, and stromal cells thereby creating a
complex microenvironment feasible for tumor growth
and invasion as well as survival and therapy-resistance
[47, 48]. To identify a cell type expressing ALDH1A3,
we performed double staining of ALDH1A3 with the following cell type specific markers: GFAP, CD68 and
CD44. Among ALDH1A3 positive cells, there were some
GFAP positive cells likely reactive astrocytes or tumor
cells due to their distinct morphology. As the coexpression of ALDH1A3 with the stem cell marker
CD44 was also found, we propose that ALDH1A3 positive tumor cells might possess the stem cell-like properties involved in tumor progression and therapy
resistance. Tumor-associated macrophages (TAMs) are
highlighted in GBM due to the considerable size of their
population (30–50%) [49]. But, the present study did not
observe cells co-expressing ALDH1A3 and CD68. The
possible implication of ALDH1A3 in immunoreaction
mediated by immune cells needs to be further studied.
Along with important roles of ALDH1A3 in cancer
and cancer stem cells, its underlying regulatory mechanism has become of interest. Several non-coding microRNAs including miR-600hg [50], miR-7 [51], miR-187
and miR-125a/b [27] have been identified to recognize
ALDH1A3 as a target gene and to suppress ALDH1A3
expression. Forkhead Box D1 (FOXD1) regulates the
transcriptional activity of ALDH1A3 in glioma stem cells
(GSCs) of MES subtype [52]. The hedgehog pathway can
significantly increase the expression of ALDH1 in cancer
stem cells of ovary, which can also be a possible mechanism in GBM [53]. In a recent study, ALDH1A3 is stabilized upon ubiquitin-specific protease 9X (USP9X) in
the MES GSCs. In contrast, deletion of USP9X induces
degradation of ALDH1A3, and a subsequent decrease in
p-STAT3, whereas overexpression of ALDH1A3 can restore p-STAT3 expression in GSCs in which downregulation of ALDH1A3 was induced by USP9X depletion
[31]. On the other hand, in NSCLC CSCs, activation of
STAT3 pathway significantly increases ALDH1A3 expression while multiple inhibitors of STAT3 signaling
can decreased ALDH1A3 expression [17]. Taken together, we assume that there might be a feedback loop
between ALDH1A3 and STAT3 to promote tumor progression in cancers. Developing STAT3 signaling inhibitors has been a new strategy for anticancer therapy.
However, so far none of them is satisfied in the clinic
studies [54]. STAT3 has two mainly isoforms, STAT3α
and STAT3β, of which the latter is a suppressive factor
of STAT3α due to lacking the transactivation domain
Page 10 of 12
[55]. In the present study, we found that ALDH1A3 protein expression was inversely associated with the levels
of total STAT3β and p-STAT3β but no association was
seen between the expression of ALDH1A3 and STAT3α.
The association and the underlying regulatory mechanism of ALDH1A3 and STAT3 in GBM need to be further elucidated by using gene techniques in the future.
Akt/PTEN is an important signaling implicated in
numerous malignant tumors including GBM. We demonstrated a significant increase in p-Akt levels concomitantly accompanied by a downregulation of PTEN in
GBM. However, the level of PTEN/p-Akt did not appear
to be associated with ALDH1A3 expression in GBMs,
suggesting that PTEN/Akt may not be a direct downstream signaling cascade trigged by ALDH1A3.
Conclusion
The present study revealed a high intra- and intertumoral heterogeneity of ALDH1A3 expression manner
in GBM. ALDH1A3 expression enriched in tumor infiltrative region highlights its crucial role in tumor invasiveness and progression. Moreover, we demonstrated
an inverse association of ALDH1A3 expression with the
prognosis of GBM, supporting ALDH1A3 as a prognostic marker and as a potential target for future GBM
therapy.
Supplementary information
Supplementary information accompanies this paper at />1186/s12885-020-07153-0.
Additional file 1: Supplementary Figure S1. Original blots of western
blotting. Supplementary Figure S2. ALDH1A3 mRNA expression in
subtypes of GBM and normal control based on TCGA database. Among
three subtypes of GBM, ALDH1A3 mRNA level in the classical and
proneural subtypes of GBM was significantly lower than that in the
control and in the mesenchymal GBM. Student t test with Welch’s
correction was used for data analysis between subgroups. **P < 0.01,
***P< 0.001, compared with control; ###P <0.001, compared with
mesenchymal.
Abbreviations
ALDH1A3: Aldehyde dehydrogenase 1 family, member A3; ALDHs: Aldehyde
dehydrogenases; CSCs: Cancer stem cells; FFPE: Formalin-fixed and paraffinembedded; GAPDH: Glyceraldehyde 3-phosphate dehydrogenase;
GBM: Glioblastoma; GFAP: Glial fibrillary acidic protein; IDH1: Isocitrate
dehydrogenase 1; IRS: Immunoreactive score; KPI: Karnofsky performance
index; MES: Mesenchymal subtype; MGMT: O6-methylguaninemethyltransferase; MRI: Magnetic resonance imaging; OS: Overall survival;
PTEN: Phosphatase and tensin homolog; RT2-PCR: Real time reverse
transcriptase polymerase chain reaction; STAT3: Signal transducer and
activator of transcription 3; SVZ: Subventricular zone; TAMs: Tumor-associated
macrophages; TC: Tumor center; TCGA: The cancer genome atlas; TD: Tumor
distant area; TI: Tumor infiltrative area; TMZ: Temozolomide
Acknowledgements
We thank Ms. Rita Haase and Ms. Michaela Hiber for their technical
assistance. CG received a scholarship from the Medical Faculty, University of
Duisburg-Essen. We also thank Dr. Su Na Kim for careful proofreading of the
manuscript.
Gan et al. BMC Cancer
(2020) 20:672
Authors’ contributions
CG contributed to the main experiments, data collection and analysis and
participated in the manuscript preparation; DP, YA and NEH: clinical data
collection and analysis; KK: histopathological diagnosis of GBM, tissue
sectioning and immunostaining; US and YZ: the study conception, design
and manuscript preparation. All authors have read and approved the final
manuscript.
Funding
This study was supported financially by the IFORES-program at the Medical
Faculty, University of Duisburg-Essen to Y.Z. The faculty paid the material necessary to elaborate the research work. Open access funding provided by
Projekt DEAL.
Availability of data and materials
All the data generated or analyzed during this study are included in this
article.
Ethics approval and consent to participate
This study was strictly performed in accordance with the Declaration of
Helsinki and approved by the local ethics committee of the University
Hospital Essen. Informed writing consent was obtained from all the patients
before the sample collection.
Consent for publication
Not applicable.
Competing interests
The authors declare that they have no competing interests.
Author details
1
Department of Neurosurgery and Spine Surgery, University hospital Essen,
University of Duisburg-Essen, Hufelandstrasse 55, 45122 Essen, Germany.
2
Department of Neurosurgery, Tongji Hospital, Tongji Medical College,
Huazhong University of Science and Technology, Wuhan, China. 3Present
Address: Department of Spine- and Peripheral Nerve-Surgery, St.
Christophorus 625 Hospital, Werne, Germany. 4Institute of Neuropathology,
University hospital Essen, University of Duisburg-Essen, Essen, Germany.
Received: 26 May 2020 Accepted: 8 July 2020
References
1. Stupp R, Mason WP, van den Bent MJ, Weller M, Fisher B, Taphoorn MJ,
et al. Radiotherapy plus concomitant and adjuvant temozolomide for
glioblastoma. N Engl J Med. 2005;352(10):987–96.
2. Sharifzad F, Ghavami S, Verdi J, Mardpour S, Mollapour Sisakht M, Azizi Z,
et al. Glioblastoma cancer stem cell biology: potential theranostic targets.
Drug Resist Updat. 2019;42:35–45.
3. Lathia JD, Mack SC, Mulkearns-Hubert EE, Valentim CL, Rich JN. Cancer stem
cells in glioblastoma. Genes Dev. 2015;29(12):1203–17.
4. Alvarez-Buylla A, Garcia-Verdugo JM. Neurogenesis in adult subventricular
zone. J Neurosci. 2002;22(3):629–34.
5. Doetsch F, Garcia-Verdugo JM, Alvarez-Buylla A. Cellular composition and
three-dimensional organization of the subventricular germinal zone in the
adult mammalian brain. J Neurosci. 1997;17(13):5046–61.
6. Lim DA, Cha S, Mayo MC, Chen MH, Keles E, VandenBerg S, et al.
Relationship of glioblastoma multiforme to neural stem cell regions predicts
invasive and multifocal tumor phenotype. Neuro-Oncology. 2007;9(4):424–9.
7. Qin EY, Cooper DD, Abbott KL, Lennon J, Nagaraja S, Mackay A, et al. Neural
Precursor-Derived Pleiotrophin Mediates Subventricular Zone Invasion by
Glioma. Cell. 2017;170(5):845–59 e19.
8. Lee JH, Lee JE, Kahng JY, Kim SH, Park JS, Yoon SJ, et al. Human
glioblastoma arises from subventricular zone cells with low-level driver
mutations. Nature. 2018;560(7717):243–7.
9. Ulasov IV, Mijanovic O, Savchuk S, Gonzalez-Buendia E, Sonabend A, Xiao T,
et al. TMZ regulates GBM stemness via MMP14-DLL4-Notch3 pathway. Int J
Cancer. 2020;146(8):2218–28.
10. Hou C, Ishi Y, Motegi H, Okamoto M, Ou Y, Chen J, et al. Overexpression of
CD44 is associated with a poor prognosis in grade II/III gliomas. J NeuroOncol. 2019;145(2):201–10.
Page 11 of 12
11. Jackson B, Brocker C, Thompson DC, Black W, Vasiliou K, Nebert DW, et al.
Update on the aldehyde dehydrogenase gene (ALDH) superfamily. Hum
Genomics. 2011;5(4):283–303.
12. Marchitti SA, Brocker C, Stagos D, Vasiliou V. Non-P450 aldehyde oxidizing
enzymes: the aldehyde dehydrogenase superfamily. Expert Opin Drug
Metab Toxicol. 2008;4(6):697–720.
13. Moreb JS. Aldehyde dehydrogenase as a marker for stem cells. Curr Stem
Cell Res Ther. 2008;3(4):237–46.
14. Kuo YC, Wang LJ, Rajesh R. Targeting human brain cancer stem cells by
curcumin-loaded nanoparticles grafted with anti-aldehyde dehydrogenase
and sialic acid: Colocalization of ALDH and CD44. Mater Sci Eng C Mater
Biol Appl. 2019;102:362–72.
15. Li G, Li Y, Liu X, Wang Z, Zhang C, Wu F, et al. ALDH1A3 induces
mesenchymal differentiation and serves as a predictor for survival in
glioblastoma. Cell Death Dis. 2018;9(12):1190.
16. Vidovic D, Huynh TT, Konda P, Dean C, Cruickshank BM, Sultan M, et al.
ALDH1A3-regulated long non-coding RNA NRAD1 is a potential novel
target for triple-negative breast tumors and cancer stem cells. Cell Death
Differ. 2020;27(1):363–78.
17. Shao C, Sullivan JP, Girard L, Augustyn A, Yenerall P, Rodriguez-Canales J,
et al. Essential role of aldehyde dehydrogenase 1A3 for the maintenance of
non-small cell lung cancer stem cells is associated with the STAT3 pathway.
Clin Cancer Res. 2014;20(15):4154–66.
18. Perez-Alea M, McGrail K, Sanchez-Redondo S, Ferrer B, Fournet G, Cortes J,
et al. ALDH1A3 is epigenetically regulated during melanocyte
transformation and is a target for melanoma treatment. Oncogene. 2017;
36(41):5695–708.
19. Mao P, Joshi K, Li J, Kim SH, Li P, Santana-Santos L, et al. Mesenchymal
glioma stem cells are maintained by activated glycolytic metabolism
involving aldehyde dehydrogenase 1A3. Proc Natl Acad Sci U S A. 2013;
110(21):8644–9.
20. Durinikova E, Kozovska Z, Poturnajova M, Plava J, Cierna Z, Babelova A, et al.
ALDH1A3 upregulation and spontaneous metastasis formation is associated
with acquired chemoresistance in colorectal cancer cells. BMC Cancer. 2018;
18(1):848.
21. Lambertz N, El Hindy N, Kreitschmann-Andermahr I, Stein KP, Dammann P,
Oezkan N, et al. Downregulation of programmed cell death 10 is associated
with tumor cell proliferation, hyperangiogenesis and peritumoral edema in
human glioblastoma. BMC Cancer. 2015;15:759.
22. El Hindy N, Keyvani K, Pagenstecher A, Dammann P, Sandalcioglu IE, Sure U,
et al. Implications of Dll4-notch signaling activation in primary glioblastoma
multiforme. Neuro-Oncology. 2013;15(10):1366–78.
23. Ahmadipour Y, Jabbarli R, Gembruch O, Pierscianek D, Darkwah Oppong M,
Dammann P, et al. Impact of Multifocality and molecular markers on
survival of Glioblastoma. World Neurosurg. 2019;122:e461–e6.
24. GlioVis: TCGA_GBM dataset. Accessed 20 Feb
2020.
25. Livak KJ, Schmittgen TD. Analysis of relative gene expression data using
real-time quantitative PCR and the 2(−Delta Delta C(T)) method. Methods.
2001;25(4):402–8.
26. Krajewska M, Krajewski S, Epstein JI, Shabaik A, Sauvageot J, Song K, et al.
Immunohistochemical analysis of bcl-2, bax, bcl-X, and mcl-1 expression in
prostate cancers. Am J Pathol. 1996;148(5):1567–76.
27. Duan JJ, Cai J, Guo YF, Bian XW, Yu SC. ALDH1A3, a metabolic
target for cancer diagnosis and therapy. Int J Cancer. 2016;139(5):
965–75.
28. Verhaak RG, Hoadley KA, Purdom E, Wang V, Qi Y, Wilkerson MD, et al.
Integrated genomic analysis identifies clinically relevant subtypes of
glioblastoma characterized by abnormalities in PDGFRA, IDH1, EGFR, and
NF1. Cancer Cell. 2010;17(1):98–110.
29. Wang Q, Hu B, Hu X, Kim H, Squatrito M, Scarpace L, et al. Tumor Evolution
of Glioma-Intrinsic Gene Expression Subtypes Associates with
Immunological Changes in the Microenvironment. Cancer Cell. 2017;32(1):
42–56 e6.
30. Zhang W, Yan W, You G, Bao Z, Wang Y, Liu Y, et al. Genome-wide DNA
methylation profiling identifies ALDH1A3 promoter methylation as a
prognostic predictor in G-CIMP- primary glioblastoma. Cancer Lett. 2013;
328(1):120–5.
31. Chen Z, Wang HW, Wang S, Fan L, Feng S, Cai X, et al. USP9X
deubiquitinates ALDH1A3 and maintains mesenchymal identity in
glioblastoma stem cells. J Clin Invest. 2019;129(5):2043–55.
Gan et al. BMC Cancer
(2020) 20:672
32. Wu W, Schecker J, Wurstle S, Schneider F, Schonfelder M, Schlegel J.
Aldehyde dehydrogenase 1A3 (ALDH1A3) is regulated by autophagy in
human glioblastoma cells. Cancer Lett. 2018;417:112–23.
33. Kahlert UD, Joseph JV, Kruyt FAE. EMT- and MET-related processes in
nonepithelial tumors: importance for disease progression, prognosis,
and therapeutic opportunities. Mol Oncol. 2017;11(7):860–77.
34. Kappadakunnel M, Eskin A, Dong J, Nelson SF, Mischel PS, Liau LM, et al. Stem
cell associated gene expression in glioblastoma multiforme: relationship to
survival and the subventricular zone. J Neuro-Oncol. 2010;96(3):359–67.
35. Jungk C, Mock A, Exner J, Geisenberger C, Warta R, Capper D, et al. Spatial
transcriptome analysis reveals notch pathway-associated prognostic markers
in IDH1 wild-type glioblastoma involving the subventricular zone. BMC
Med. 2016;14(1):170.
36. Vassalli G. Aldehyde dehydrogenases: not just markers, but functional
regulators of stem cells. Stem Cells Int 2019;2019:3904645.
37. Feng H, Liu Y, Bian X, Zhou F, Liu Y. ALDH1A3 affects colon cancer in vitro
proliferation and invasion depending on CXCR4 status. Br J Cancer. 2018;
118(2):224–32.
38. Zhang W, Liu Y, Hu H, Huang H, Bao Z, Yang P, et al. ALDH1A3: a marker of
Mesenchymal phenotype in Gliomas associated with cell invasion. PLoS
One. 2015;10(11):e0142856.
39. Qiu XX, Wang CH, Lin ZX, You N, Wang XF, Chen YP, et al. Correlation of
high delta-like ligand 4 expression with peritumoral brain edema and its
prediction of poor prognosis in patients with primary high-grade gliomas. J
Neurosurg. 2015;123(6):1578–85.
40. Wu CX, Lin GS, Lin ZX, Zhang JD, Liu SY, Zhou CF. Peritumoral edema
shown by MRI predicts poor clinical outcome in glioblastoma. World J Surg
Oncol. 2015;13:97.
41. Hegi ME, Diserens AC, Gorlia T, Hamou MF, de Tribolet N, Weller M, et al.
MGMT gene silencing and benefit from temozolomide in glioblastoma. N
Engl J Med. 2005;352(10):997–1003.
42. Gilbert MR, Wang M, Aldape KD, Stupp R, Hegi ME, Jaeckle KA, et al. Dosedense temozolomide for newly diagnosed glioblastoma: a randomized
phase III clinical trial. J Clin Oncol. 2013;31(32):4085–91.
43. Brell M, Tortosa A, Verger E, Gil JM, Viñolas N, Villá S, et al. Prognostic
significance of O6-methylguanine-DNA methyltransferase determined by
promoter hypermethylation and immunohistochemical expression in
anaplastic gliomas. Clin Cancer Res. 2005;11(14):5167–74.
44. Zawlik I, Vaccarella S, Kita D, Mittelbronn M, Franceschi S, Ohgaki H.
Promoter methylation and polymorphisms of the MGMT gene in
glioblastomas: a population-based study. Neuroepidemiology. 2009;32(1):
21–9.
45. Ohmura-Kakutani H, Akiyama K, Maishi N, Ohga N, Hida Y, Kawamoto T,
et al. Identification of tumor endothelial cells with high aldehyde
dehydrogenase activity and a highly angiogenic phenotype. PLoS One.
2014;9(12):e113910.
46. Hida K, Maishi N, Akiyama K, Ohmura-Kakutani H, Torii C, Ohga N, et al.
Tumor endothelial cells with high aldehyde dehydrogenase activity show
drug resistance. Cancer Sci. 2017;108(11):2195–203.
47. D’Alessio A, Proietti G, Sica G, Scicchitano BM. Pathological and Molecular
Features of Glioblastoma and Its Peritumoral Tissue. Cancers (Basel). 2019;11(4).
48. Darmanis S, Sloan SA, Croote D, Mignardi M, Chernikova S,
Samghababi P, et al. Single-cell RNA-Seq analysis of infiltrating
neoplastic cells at the migrating front of human Glioblastoma. Cell
Rep. 2017;21(5):1399–410.
49. Charles NA, Holland EC, Gilbertson R, Glass R, Kettenmann H. The brain
tumor microenvironment. Glia. 2011;59(8):1169–80.
50. Yao Y, Li N. MIR600HG suppresses metastasis and enhances oxaliplatin
chemosensitivity by targeting ALDH1A3 in colorectal cancer. Biosci Rep.
2020;40(4).
51. Pan M, Li M, You C, Zhao F, Guo M, Xu H, et al. Inhibition of breast cancer
growth via miR-7 suppressing ALDH1A3 activity concomitant with
decreasing breast cancer stem cell subpopulation. J Cell Physiol. 2020;
235(2):1405–16.
52. Cheng P, Wang J, Waghmare I, Sartini S, Coviello V, Zhang Z, et al.
FOXD1-ALDH1A3 signaling is a determinant for the self-renewal and
Tumorigenicity of Mesenchymal Glioma stem cells. Cancer Res. 2016;
76(24):7219–30.
53. Sneha S, Nagare RP, Sidhanth C, Krishnapriya S, Garg M, Ramachandran B,
et al. The hedgehog pathway regulates cancer stem cells in serous
Page 12 of 12
adenocarcinoma of the ovary. Cell Oncol (Dordr). 2020. />007/s13402-020-00504-w.
54. Wong ALA, Hirpara JL, Pervaiz S, Eu JQ, Sethi G, Goh BC. Do STAT3
inhibitors have potential in the future for cancer therapy? Expert Opin
Investig Drugs. 2017;26(8):883–7.
55. Caldenhoven E, van Dijk TB, Solari R, Armstrong J, Raaijmakers JA, Lammers
JW, et al. STAT3beta, a splice variant of transcription factor STAT3, is a
dominant negative regulator of transcription. J Biol Chem. 1996;271(22):
13221–7.
Publisher’s Note
Springer Nature remains neutral with regard to jurisdictional claims in
published maps and institutional affiliations.