Questioning the IGF1 receptor’s assigned role in CRC – a case for rehabilitation
Bạn đang xem bản rút gọn của tài liệu. Xem và tải ngay bản đầy đủ của tài liệu tại đây (1.64 MB, 12 trang )
Heckl et al. BMC Cancer
(2020) 20:704
/>
RESEARCH ARTICLE
Open Access
Questioning the IGF1 receptor’s assigned
role in CRC – a case for rehabilitation?
Steffen M. Heckl1*† , Marie Pellinghaus1,2†, Hans-Michael Behrens2, Sandra Krüger2, Stefan Schreiber1 and
Christoph Röcken2
Abstract
Background: The insulin-like growth factor 1 receptor (IGF1R) is suspected to be involved in colorectal
carcinogenesis and has been associated with worse survival in colorectal cancer (CRC). We hypothesized that the
alleged suspect might be in truth beyond any suspicion. We investigated if the expression of the IGF1R in CRC
correlates with (1) clinicopathological patient characteristics, including survival, and hence is involved in colon
cancer biology; (2) the expression of the IGF1R in CRC is linked to the expression of the insulin receptor (IR).
Methods: We evaluated 4497 CRC samples from 1499 patients for the expression of IGF1R in tumor cells by
immunohistochemistry. Cytoplasmic (cCC-IGF1R) and membranous (mCC-IGF1R) immunostaining was evaluated by
employing a modified HistoScore (HScore), which was dichotomized into low or high IGF1R expressions. The IGF1R
status was correlated with clinicopathological patient characteristics, survival and the IR expression status.
Results: cCC-IGF1R and mCC-IGF1R (HScore> 0) were found in 85.4 and 60.8% of all CRCs. After dichotomization of
the HScores, 54.9 and 48.6% were classified as cCC-IGF1R-high and mCC-IGF1R-high, respectively. IGF1R was
associated with tumor localization, local tumor growth, lymphatic vessel invasion, grading, mismatch repair protein
expression status and IR-expression. We found no significant association with overall or tumor-specific survival, with
a tendency for an even improved overall survival for cCC-IGF1R.
Conclusions: IGF1R expression is frequent and biologically relevant in CRC, but does not correlate with patient
survival. The IGF1R might be beyond suspicion in CRC after all.
Keywords: Colorectal cancer, IGF1 receptor, Cancer risk factor, Cancer prognosis, Cancer therapy
Background
The insulin-like growth factor 1 receptor (IGF1R) is suspected to be involved in colorectal carcinogenesis and
has been associated with worse survival in colorectal
cancer (CRC) [1, 2].
The IGF1R is known to interact with the insulin receptor (IR), thereby constituting the IGF1R−/IR-axis [3].
We recently reported that IR expression is associated
with distinct clinicopathological parameters and survival
* Correspondence:
†
Steffen M. Heckl and Marie Pellinghaus contributed equally to this work.
1
Department of Internal Medicine I, University Hospital Schleswig-Holstein,
Kiel, Germany
Full list of author information is available at the end of the article
in CRC [4]. Surprisingly, CRC patients with IR expression in tumor cells proved to show longer overall and
tumor-specific survival rates than those with IR negative
tumors. We therefore wondered why the IGF1R – which
shares common ligands and signal transduction pathways with the IR – should contribute to worse survival
in CRC? We hypothesized that the alleged suspect might
be in truth beyond any suspicion.
We decided to gather as much evidence as possible,
knowing that previous studies about IGF1R expression
in CRC had been based upon study cohorts of limited
size (Nakamura et al. n = 116 CRC patients [5]; Takahari
et al. n = 91 CRC patients [2]; Shiratsuchi et al. n = 210
© The Author(s). 2020 Open Access This article is licensed under a Creative Commons Attribution 4.0 International License,
which permits use, sharing, adaptation, distribution and reproduction in any medium or format, as long as you give
appropriate credit to the original author(s) and the source, provide a link to the Creative Commons licence, and indicate if
changes were made. The images or other third party material in this article are included in the article's Creative Commons
licence, unless indicated otherwise in a credit line to the material. If material is not included in the article's Creative Commons
licence and your intended use is not permitted by statutory regulation or exceeds the permitted use, you will need to obtain
permission directly from the copyright holder. To view a copy of this licence, visit />The Creative Commons Public Domain Dedication waiver ( applies to the
data made available in this article, unless otherwise stated in a credit line to the data.
Heckl et al. BMC Cancer
(2020) 20:704
CRC patients [6]). Using a study population of 1499 patients we aimed to investigate the effects of IGF1R expression in CRC more extensively. An extensive analysis
of IGF1R expression in CRC might help to further unravel the reasons for the striking ineffectiveness of
IGF1R-directed therapy in CRC clinical trials [7–9].
In this study we tested the following hypotheses: the
expression of IGF1R in CRC correlates with (1) clinicopathological patient characteristics, including survival,
and hence is involved in colon cancer biology; (2) the
expression of IGF1R in CRC is linked to the expression
of the IR.
Methods
Study population and histology
From the archive of the Institute of Pathology, University Hospital Schleswig-Holstein, Kiel, we retrieved all
samples of patients who had undergone oncologic resections of primary CRCs between 1995 and 2011. All tissue samples had been obtained from routine therapeutic
surgeries. After fixation in neutral buffered formalin, all
tissue specimens had been embedded in paraffin. Paraffin sections were subsequently cut and then stained with
hematoxylin and eosin (H&E). The World Health
Organization criteria were employed for histological
classification. Board certified pathologists classified the
tumor-node-metastasis stage according to the criteria of
the union internationale contre le cancer (UICC; 7th edition) [10]. After study inclusion, all patient data were
pseudonymized. Patients were excluded (1) if syn- or
metachronous colon cancer was documented and (2) if
the sample did not contain tumor cells.
Tissue microarray construction.
Tissue microarrays (TMA) were constructed from
formalin-fixed and paraffin-embedded tissue samples as
previously described [11]. H&E-stained tissue slides of
each CRC sample were examined and three separate
representative areas were selected randomly from the
tumor area of the donor paraffin block(s) by a boardcertified pathologist. A core was punched and transferred to the recipient paraffin block, thereby yielding
three representative tissue cores per CRC patient within
our TMAs. Successful transfer of tumor tissue was verified by H&E-staining of serial sections obtained from
the TMAs.
Immunohistochemistry.
Paraffin sections were deparaffinized and boiled in
EDTA buffer (pH 9.0) for 1 min at 125 °C. All tissue
slides were washed with Tris-buffered saline (TBS) and
then blocked with hydrogen peroxide block (Thermo
Fisher Scientific) for 15 min. After washing with TBS
and subsequent incubation with Ultra V Block (Thermo
Fisher Scientific) for 5 min, all slides were incubated
with the primary antibody. The incubation with the
Page 2 of 12
primary antibody was performed for 30 min at room
temperature, followed by an incubation overnight at
4 °C. The IGF1-receptor β antibody (rabbit monoclonal;
clone D406W; Cell Signaling Technologies, Danvers,
USA) was used with a 1:50 dilution. The ImmPRESS reagent peroxidase universal anti-mouse/rabbit Ig-MP7500 (Vector Laboratories, Burlingame CA, USA) served
as the peroxidase conjugated secondary antibody. The
ImmPact NovaRed peroxidase substrate SK-4805 Kit
(Vector Laboratories, Burlingame CA, USA) was used
for the visualization of immunoreactions. All tissue
slides were counterstained with hematoxylin. Negative
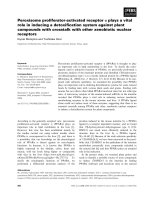
controls were generated by omission of the primary antibody (Fig. 1). Endometrium samples served as positive
controls (Fig. 1).
Evaluation of IGF1 receptor immunostaining
At first, the entire series of 4497 TMA spots was
screened to assess minimum and maximum staining intensities achieved with the staining protocol. Finally, a
three-tired (0, 1+, 2+) scoring system of the staining intensity was considered to be appropriate and samples
representing each staining intensity were selected as references for further assessment (Fig. 1). The evaluation
distinguished between cytoplasmic (cCC-IGF1R) and
membranous immunostaining (mCC-IGF1R) of the
tumor cells. Subsequently, the whole study population
was evaluated in depth. The three cores of each CRC
specimen were treated as a single case. Subsequently, a
modified HistoScore (HScore) was employed for the
evaluation of IGF1R immunostaining. First the intensity
of cytoplasmic and membranous IGF1R immunostaining, respectively, within tumor cells was evaluated and
categorized as absent 0 (=no evidence of staining), weak
(1+) and strong (2+). Secondly, the percentage of tumor
cells with no (0), weak (1+), or strong (2+) immunostaining within each given tumor sample was estimated.
The percentage of immunostained cells always added up
to 100% according to the following formula: % (0) + %
(1+) + % (2+) = 100% tumor cells. Subsequently, an
HScore was calculated using the following formula:
HScore = [0 x percentage of immunonegative tumor
cells] + [1 x percentage of weakly stained tumor cells] +
[2 x percentage of strongly stained tumor cells]. The
maximum possible HScore was 200, if all tumor cells
within a sample showed a strong (2+) immunostaining.
The HScore served to improve the stratification of our
samples, by separating more distinctively samples of low
and of high immunostaining intensities. Finally, the cohort was split at the median HScore in high or low
IGF1R expression. One person scored all samples (MP)
and repeatedly compared the scoring with the study’s
predetermined reference samples (Fig. 1) in order to decrease intra-observer variability. In the case of
Heckl et al. BMC Cancer
(2020) 20:704
Page 3 of 12
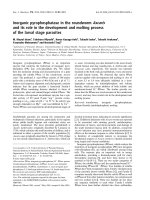
Fig. 1 Insulin-like growth factor 1 receptor (IGF1R) immunoreactivity. Colorectal carcinoma samples showing (a) strong cytoplasmic (2+) and
strong membranous (2+) staining, (b) weak (1+) cytoplasmic and weak (1+) membranous staining, (c) weak cytoplasmic (1+) and no (0)
membranous staining, and (d) neither cytoplasmic nor membranous insulin-like growth factor 1 receptor (IGF1R) staining. IGF1R expression in
endometrial cells (proliferative phase) served as a positive control (e) and the omission of the primary antibody served as the negative control (f).
Original magnification a-d: 400x
ambiguous immunostaining results, a second investigator (CR/SH) from the team was referred to and a consensus was reached. The scoring was reviewed on a
random sample basis by a second investigator (CR/SH)
in order to validate the consistency of the evaluation
process.
Assessment of the insulin receptor status
The IR status was assessed as previously described
[4]. In brief, a monoclonal anti-insulin-receptor antibody (rabbit, clone 4B8; Cell Signaling Technologies,
Danvers, USA; dilution 1:50; manual immunostaining)
was used for immunohistochemistry. IR expression in
vessels and in tumor cells was evaluated. With respect
to IR expression in tumor cells, immunostaining was
classified as either being negative, if no staining was
evident, or positive, if any immunostaining was
present. IR expression in cancer vasculature was
scored ranging from absent (0) to strong (3+). Vascular IR expression was categorized into absent (0),
weak (1+), moderate (2+) and strong (3+). The IR expression data as such has been published elsewhere
[4] and has now been correlated with the new IGF1R
expression data of the present study. The comparative
Heckl et al. BMC Cancer
(2020) 20:704
analysis of IGF1R- and IR-expression was based on
the same TMA cores.
Assessment of DNA mismatch repair protein
immunostaining
The expression of DNA mismatch repair proteins
(MMR) MLH1, PMS2, MSH6 and MSH2 were assessed
according to the algorithm suggested by Remo et al. [12]
as previously described [4]. The algorithm is based upon
the evaluation of nuclear staining within tumor cells.
MMR deficient (dMMR) and MMR proficient CRCs
were discriminated. Occasional cases of inconclusive
MMR staining results were excluded, e.g. due to the absence of a positive internal control, or due to technical
artifacts.
KRAS genotyping
For genotyping one representative tissue section and the
corresponding paraffin block were chosen from the resection specimens. The tumor area was marked on the
H&E-stained slide. The percentage of tumor tissue in
the marked area and the relative amounts of the histoanatomical components of the tumor, i.e. tumor cells and
desmoplastic stroma were estimated visually to guarantee a valid tumor cell content. Genomic DNA was then
extracted from formalin-fixed and paraffin-embedded
tissue with the QIAamp DNA mini kit (Qiagen, Hilden,
Germany) following the manufacturer’s instructions. To
ensure a tumor cell percentage of > 40% in the analyzed
specimens the tissue sections were manually microdissected prior to DNA extraction. For mutational analysis
of codons 12 and 13 of the KRAS gene a 179 bp fragment was amplified by polymerase chain reaction (PCR)
using the primers 5′-AGGCCTGCTGAAAATGAC
TGAATA-3′ (sense) and 5′- CTGTATCAAAGAATGG
TCCT GCAC-3′ (antisense).15 PCR products were purified using the Nucleospin Extract II kit (MachereyNagel, Düren, Germany) and both strands sequenced by
dye terminator cycle sequencing (BigDye Terminator
v1.1 Cycle Sequencing kit, Applied Biosystems, Darmstadt, Germany) with the primers used for PCR amplification. The sequencing products were analyzed on an
ABI Prism 310 Genetic Analyzer (Applied Biosystems).
The results were confirmed by pyrosequencing on a
PyroMark Q24 instrument as described by Ogino et al.
[13]. Mutational analyses of codon 61 of the KRAS gene
were done by pyrosequencing. In brief, specific DNA
fragments of the individual genes were amplified by PCR
using the primers 5′-AATTGATGGAGAAACCTGTC
TCTT-3′ and 5′-TCCTCATGTACTGGTCCCTCATT3′ (KRAS, codon 61). The resulting PCR products were
sequenced on a PyroMark Q24 instrument with the sequencing primers 5′-GGATATTCTCGACACAGC-3′
(KRAS, codon 61), The KRAS-genotyping had been
Page 4 of 12
certified by an external quality assurance program done
by the German Society of Pathology and the Bundesverband Deutscher Pathologen e.V. (www.dgp-berlin.de).
Statistical analyses
For statistical analyses SPSS version 24.0 (IBM Corp.,
Armonk, NY, USA) was employed. Fisher’s exact test
was used to test the correlation between non-ordinal
clinicopathological patient characteristics and the mCCIGF1R-status, or the cCC-IGF1R-status, respectively.
Fisher’s exact test also served to test correlations between the IR status and the mCC-IGF1R-status, or the
cCC-IGF1R-status. Variables of ordinal scale such as the
T category, N category, UICC stage and tumor grading
were tested with Kendall’s tau test. The Kaplan-Meier
method was used to determine median survival with
95% intervals. The log-rank test was employed to test
differences between median survivals. A p-value of ≤0.05
was defined to be significant. All p values are displayed
without correction. We applied the Siemes (BenjaminiHochberg) procedure to compensate a false discovery
rate within the correlations. P-values having lost significance are marked.
Results
Study population
The clinicopathological characteristics of our patient
collective are summarized in Table 1. 730 women and
769 men comprised the patient population with an overall median age of 71 years (range 26–95 years). During
the follow-up 980 out of 1499 patients had died, with a
median follow-up time of 58.7 months.
Immunohistochemistry
We evaluated 4497 CRC samples from 1499 patients for
the expression of IGF1R in tumor cells.
A weak membranous immunostaining of tumor cells
(mCC-IGF1R 1+) was observed in 910 (60.7%) cases and
a strong membranous staining (mCC-IGF1R 2+) in 230
(15.3%) cases. Cells without membranous immunoreactivity (mCC-IGF1R 0) were seen in 1472 (98.2%) of all
cases.
The percentage of immunostained tumor cells ranged
from 0 to 100% and the combination of immunostaining
categories varied in each individual sample. In 588
(39.2%) of all samples no membranous IGF1R expression
was observed. In 2 cases (0.1%) all tumor cells (100%)
showed a mCC-IGF1R 1+ staining and in 2 cases (0.1%)
90% of all tumor cells depicted a mCC-IGF1R 2+ staining. All other CRC samples showed various combinations of each staining intensity. The median HScore for
mCC-IGF1R was 10 (range 0–190). The study population was dichotomized into mCC-IGF1R-low (HScore
≤10) and mCC-IGF1R-high (> 10). 771 (51.4%) of all
1327 (88.5)
MX
1499
172 (11.5)
M-Category
n p-Value (a)
659 (44.5)
689 (51.9)
82 (47.7)
1499
331 (50.2)
429 (52.3)
1480
160 (46.6)
171 (54.1)
429 (52.3)
1480
572 (51.4)
199 (51.4)
1499
124 (49.8)
448 (51.9)
158 (50.0)
41 (57.7)
1499
336 (59.8)
394 (45.8)
1422
393 (51.6)
378 (51.2)
1499
373 (51.1)
398 (51.8)
1499
n(%)
638 (48.1)
90 (52.3)
0.331
328 (49.8)
392 (47.7)
0.464
183 (53.4)
145 (45.9)
392 (47.7)
0.197
540 (48.6)
188 (48.6)
1.000
125 (50.2)
415 (48.1)
158 (50.0)
30 (42.3)
0.678
226 (40.2)
466 (54.2)
< 0.001
368 (48.4)
360 (48.8)
0.877
357 (48.9)
371 (48.2)
0.836
n(%)
597 (45.0)
79 (45.9)
1499
312 (47.3)
354 (43.1)
1480
172 (50.1)
140 (44.3)
354 (43.1)
1480
535 (48.1)
141 (36.4)
128 (51.4)
407 (47.2)
115 (36.4)
26 (36.6)
1499
287 (51.1)
347 (40.3)
1422
353 (46.4)
323 (43.8)
1499
320 (43.8)
356 (46.3)
1499
n(%)
lowHScore
< 90lowHScore
< 90lowHScore
< 90lowHScore < 90
lowHScore ≤ 10lowHScore
≤ 10lowHScore ≤ 10lowHScore ≤ 10
highHScore
> 10highHScore
> 10highHScore
> 10highHScore > 10
Cytoplasmic IGF1R
expression
Membranous IGF1R expression
730 (55.0)
93 (54.1)
0.871
347 (52.7)
467 (56.9)
0.115
171 (49.9)
176 (55.7)
467 (56.9)
0.047*
577 (51.9)
246 (63.6)
< 0.001
121 (48.6)
456 (52.8)
201 (63.6)
45 (63.4)
< 0.001
275 (48.9)
513 (59.7)
< 0.001
408 (53.6)
415 (56.2)
0.324
410 (56.2)
413 (53.7)
0.350
n(%)
highHScore
≥ 90highHScore
≥ 90highHScore
≥ 90highHScore ≥ 90
(2020) 20:704
M1
821 (55.5)
1480
N-Category
N+ (N1a/b/c, N2a/b)
343 (23.2)
N2a/b
N0
316 (21.3)
N1a/b/c
n p-Value (a)
821 (55.5)
N0
1112 (74.2)
1480
n p-Value (b)
N-Category
1499
T-Category (grouped)
T3/T4a/T4b
249 (16.6)
T4a/b
387 (25.8)
863 (57.6)
T3
n p-Value (a)
316 (21.1)
T1/T2
71 (4.7)
T2
T-Category
T1
562 (39.5)
1499
Right-sided
n p-Value (b)
860 (60.5)
1422
Localization
n p-Value (a)
761 (50.8)
Left-sided
738 (49.2)
≥ 71 years
1499
< 71 years
730 (48.7)
Age Group
n p-Value (a)
Female
1499
n(%)
769 (51.3)
n p-Value (a)
Male
Gender
Total
Table 1 Correlation between clinicopathological patient characteristics and the expression of insulin-like growth factor receptor 1 (IGF1R) in tumor cells. (a) Fisher’s exact test (b)
Kendall’s tau test (c) Log-rank test. Abbreviations: n.c. = not calculated. * p values having lost significance according to the Siemes (Benjamini-Hochberg) procedure for multiple
testing
Heckl et al. BMC Cancer
Page 5 of 12
Overall Survival [Months]
p-Value (c)
14 (53.8)
12 (46.2)
KRAS mutation
KRAS mutation status
1495
8 (66.7)
7 (50.0)
26
64 (67.4)
193 (49.2)
487
14 (37.8)
739 (52.0)
1458
144 (52.6)
616 (51.2)
1476
21 (53.8)
338 (53.0)
677
50 (51.0)
721 (51.5)
1498
178 (48.4)
593 (52.4)
1499
81 (47.4)
268 (51.1)
261 (52.8)
161 (51.9)
1499
n(%)
0.648
4 (33.3)
7 (50.0)
0.453
31 (32.6)
199 (50.8)
0.002
23 (62.2)
682 (48.0)
0.097
130 (47.4)
586 (48.8)
0.738
18 (46.2)
300 (47.0)
1.000
48 (49.0)
679 (48.5)
1.000
190 (51.6)
538 (47.6)
0.187
90 (52.6)
256 (48.9)
233 (47.2)
149 (48.1)
0.358
n(%)
1495
5 (41.7)
4 (28.6)
26
55 (57.9)
171 (43.6)
487
14 (37.8)
640 (45.0)
1458
147 (53.6)
521 (43.3)
1176
15 (38.5)
281 (44.0)
677
50 (51.0)
721 (51.5)
1498
192 (52.2)
484 (42.8)
1499
78 (45.6)
251 (47.9)
231 (46.8)
116 (37.4)
1499
n(%)
lowHScore
< 90lowHScore
< 90lowHScore
< 90lowHScore < 90
lowHScore ≤ 10lowHScore
≤ 10lowHScore ≤ 10lowHScore ≤ 10
highHScore
> 10highHScore
> 10highHScore
> 10highHScore > 10
Cytoplasmic IGF1R
expression
Membranous IGF1R expression
0.051
7 (58.3)
10 (71.4)
0.683
40 (42.1)
221 (56.4)
0.016*
23 (62.2)
781 (55.0)
0.408
127 (46.4)
681 (56.7)
0.002
24 (61.5)
357 (56.0)
0.512
48 (49.0)
679 (48.5)
0.834
176 (47.8)
647 (57.2)
0.002
93 (54.4)
273 (52.1)
263 (53.2)
194 (62.6)
0.025*
n(%)
highHScore
≥ 90highHScore
≥ 90highHScore
≥ 90highHScore ≥ 90
(2020) 20:704
KRAS wild-type
95 (19.5)
26
MMR deficient
n p-Value (a)
392 (80.5)
487
Mismatch repair protein (MMR) status
n p-Value (a)
37 (2.5)
MMR proficient
1421 (97.5)
R1/R2
R-Status
R0
274 (18.6)
1458
High grade (G3/G4)
n p-Value (a)
1202 (81.4)
1476
Grading
n p-Value (a)
39 (5.8)
Low grade (G1/G2)
638 (94.2)
Pn1
677
Pn0
98 (6.5)
Pn-Category
n p-Value (a)
V1
1498
1400 (93.5)
n p-Value (a)
V-Category
V0
368 (24.5)
L-Category
1131 (75.5)
1499
IVA/B
L1
171 (11.4)
IIIA/B/C
L0
494 (33.0)
524 (35.0)
IIA/B/C
n p-Value (a)
1499
n(%)
310 (20.6)
n p-Value (b)
I
UICC Stage
Total
Table 1 Correlation between clinicopathological patient characteristics and the expression of insulin-like growth factor receptor 1 (IGF1R) in tumor cells. (a) Fisher’s exact test (b)
Kendall’s tau test (c) Log-rank test. Abbreviations: n.c. = not calculated. * p values having lost significance according to the Siemes (Benjamini-Hochberg) procedure for multiple
testing (Continued)
Heckl et al. BMC Cancer
Page 6 of 12
114.8–125.2
95% C.I.
1481/501/980
n.c.
141.6–152.1
Total / Events / Censored
Median Survival
95% C.I.
p-Value (c)
92.4
Median Survival
Tumour Specific Survival [Months]
1495/737/758
Total / Events / Censored
n(%)
Total
n.c.
n.c.
763/246/517
1481
n.c.
95.5
770/378/392
n(%)
n.c.
n.c.
718/255/463
0.193
n.c.
85.8
725/359/366
n(%)
665/240/425
n.c.
n.c.
n.c.
n.c.
816/261/555
0.093
n.c.
48.2–92.7 (+ − 11.4)
1481
119.6
823/385/438
n(%)
highHScore
≥ 90highHScore
≥ 90highHScore
≥ 90highHScore ≥ 90
70.4
672/352/320
n(%)
lowHScore
< 90lowHScore
< 90lowHScore
< 90lowHScore < 90
lowHScore ≤ 10lowHScore
≤ 10lowHScore ≤ 10lowHScore ≤ 10
highHScore
> 10highHScore
> 10highHScore
> 10highHScore > 10
Cytoplasmic IGF1R
expression
Membranous IGF1R expression
Table 1 Correlation between clinicopathological patient characteristics and the expression of insulin-like growth factor receptor 1 (IGF1R) in tumor cells. (a) Fisher’s exact test (b)
Kendall’s tau test (c) Log-rank test. Abbreviations: n.c. = not calculated. * p values having lost significance according to the Siemes (Benjamini-Hochberg) procedure for multiple
testing (Continued)
Heckl et al. BMC Cancer
(2020) 20:704
Page 7 of 12
Heckl et al. BMC Cancer
(2020) 20:704
CRCs were mCC-IGF1R-low and 728 (48.6%) were
mCC-IGF1R-high.
A strong cytoplasmic immunostaining of tumor cells
(cCC-IGF1R 2+) was observed in 202 (13.5%) and a
weak cytoplasmic immunostaining (cCC-IGF1R 1+) in
1280 (85.4%) CRCs. Tumor cells lacking cytoplasmic
IGF1R immunostaining (cCC-IGF1R 0) were found in
927 (61.8%) cases. The three cytoplasmic immunostaining categories covered different percentage areas within
each CRC sample, ranging from 0% up to 100% respectively. In 219 (14.6%) CRC samples, no cytoplasmic immunostaining was detectable in any of the tumor cells.
In 402 (26.8%) cases all tumor cells showed a weak
(cCC-IGF1R 1+) immunostaining and in 4 (0.3%) cases
90% of all tumor cells within a given sample showed a
strong cytoplasmic IGF1R expression (cCC-IGF1R 2+
).The median HScore for cCC-IGF1R was 90 (range 0–
190). The study population was dichotomized into cCCIGF1R-low (HScore < 90) and cCC-IGF1R-high (≥90).
676 (45.1%) CRCs were cCC-IGF1R-low and 823 (54.9%)
CRCs were cCC-IGF1R-high.
Correlation of IGF1R – expression with clinicopathological
data
To evaluate the biological relevance of IGF1R expression
in CRC, we correlated cCC-IGF1R and mCC-IGF1R
with clinicopathological patient characteristics (Table 1),
respectively. Tumors of CRC patients with cCC-IGF1Rhigh were significantly more frequently of a left-sided
origin and of a lower (G1/G2) tumor grade. cCC-IGF1Rhigh was significantly associated with a lower T category
in CRC. cCC-IGF1R-high was significantly more frequent in CRCs without lymph vessel invasion.
mCC-IGF1R-high was significantly associated with the
MMR proficient phenotype as well as a left-sided location of the CRC. With respect to membranous IGF1R
expression, no other associations were found.
The associations between cCC-IGF1R-high and a
MMR proficient phenotype, a lower UICC stage and a
diminished nodal spread lost their significance according
to the Siemes (Benjamini-Hochberg) procedure for multiple testing.
Survival analysis
The mean overall survival (OS) of the whole CRC study
population was 119.9 months and the mean tumorspecific survival (TSS) was 146.8 months. Prognosis was
significantly associated with gender, age, T-, N-, Mcategory, UICC-stage, L-, V-, Pn-, R- category and grading
(data not shown). CRC patients with cCC-IGF1R-high
showed a strong tendency for longer overall survival,
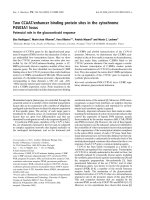
which missed statistical significance (p = 0.051). No significant associations between IGF1R expression and survival
were found (Fig. 2).
Page 8 of 12
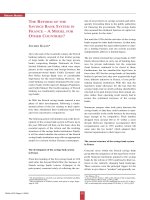
In order to achieve an improved comparability with
the results of other study groups [1, 6], we correlated
IGF1R expression with survival by only evaluating the
percentage of positively stained tumor cells. In this
sense, CRC samples with cytoplasmic or membranous
IGF1R expression in ≥10% of all tumor cells were classified as IGF1R positive. CRC samples which exhibited
cytoplasmic as well as membranous IGF1R expression in
less than 10% of all tumor cells were regarded as IGF1R
negative. IGF1R positive CRCs tended to show an improved overall as well as tumor-specific survival, which
missed significance (p = 0.076 and p = 0.076 respectively;
Fig. 3).
Correlation of IGF1R-expression with insulin receptor
expression
IR expression data was available for 1457 out of 1499
CRC patients examined in the present study. The comparative analysis of IGF1R- and IR-expression therefore
enclosed 1457 patients. cCC-IGF1R-high correlated significantly with IR expression in tumor cells (p < 0.001)
and tumor vessels (p < 0.001) (Table 2).
Membranous IGF1R-expression in tumor cells correlated significantly with IR expression in tumor vessels
(p < 0.001) but not with IR status in tumor cells (p =
0.07). However, cytoplasmic IGF1R-expression correlated significantly with the IR status in tumor cells (p <
0.001) (Table 2), albeit.
Discussion
On the basis of a large study population, our investigative cohort analysis of IGF1R expression in CRC leads to
new results contrasting former studies.
Up to now, the common belief was that the IGF1R
promotes CRC progression and is associated with worse
survival. Takahari et al. had associated IGF1R expression
with shorter survival in a cohort consisting of 91 CRC
patients [2]. Shiratsuchi et al. had studied a cohort of
210 CRC patients and reported that IGF1R expression
was more frequently seen in tumors of larger size [6]. In
experimental CRC models, IGF1R inhibition exhibited
antitumor effects in combination with chemotherapy
[14]. Therefore IGF1R inhibition had been pursued in
several clinical trials. Nevertheless, clinical trials failed to
show efficacy of IGF1R inhibiting antibodies in CRC [7–
9]. Cohn et al. tested the combination of the IGF1Rblocking antibody Ganitumab with a FOLFIRI chemotherapy regimen [8] and found no benefit of the additional IGF1R-inhibition.
In our study, we wanted to scrutinize the IGF1R’s role
in CRC pathophysiology more elaborately by basing our
investigation upon a large study population. We knew
that only a large study population could prevent a
Heckl et al. BMC Cancer
(2020) 20:704
Page 9 of 12
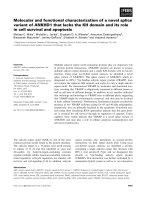
Fig. 2 Kaplan-Meier curves. Kaplan-Meier curves demonstrating correlations between membranous IGF1 receptor expression in tumor cells and
overall (a; p = 0.648) as well as tumor specific survival (b; p = 0.193). Kaplan-Meier curves demonstrating correlations between cytoplasmic IGF1
receptor expression in tumor cells and overall (c; p = 0.051) as well as tumor specific survival (d; p = 0.093). Numbers at risk are provided below
each Kaplan-Meier curve
potential type II error, which could have misled former
investigators.
In our analysis of 1499 CRCs, we found no significant correlation of IGF1R expression with survival. We even observed a tendency for prolonged overall survival in CRC
patients with high cytoplasmic IGF1R expression. Our survival data appear to be consistent with our associations between IGF1R expression and clinicopathological parameters:
IGF1R expression was associated with more differentiated
tumors, less lymphatic vessel invasion and a lower tumor size
at diagnosis. We therefore postulate that the IGF1R has been
suspected wrongfully to promote worse survival in CRC.
Our results oppose not only former, but even a more
recent study published by Han et al. in 2016 involving
121 CRC patients [1]. Han et al. described an association
between IGF1R expression and worse survival in CRC
and correlated IGF1R expression with higher tumor
stages, poor differentiation and lymphatic metastasis.
Heckl et al. BMC Cancer
(2020) 20:704
Page 10 of 12
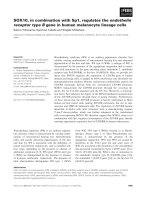
Fig. 3 Kaplan-Meier curves based on the percentage of stained cells. Kaplan-Meier curves demonstrating correlations between IGF1 receptor
expression in tumor cells and overall (a; p = 0.076) and tumor-specific (b; p = 0.076) survival based on the evaluation of the percentage of stained
cells. CRCs with < 10% IGF1R positive tumor cells were declared as IGF1R negative and CRCs bearing ≥10% IGF1R positive tumor cells were
classified as IGF1R positive. Neither the staining intensity nor the compartmental localization of the IGF1R were incorporated. Numbers at risk are
provided below each Kaplan-Meier curve
Although we think that our study is based on a
broad foundation, we have to consider potential confounders: Different evaluation schemes may explain
the discrepant results. Different from Han et al. and
other groups we used the HScore for the assessment
of immunostaining and we distinguished between
cytoplasmic and membranous IGF1R expression: The
HScore aimed to improve stratification between
tumor cells with low and high IGF1R expression, as
we observed heterogeneity in IGF1R expression. Low
IGF1R expressing tumor cells with a faint, but evident, immunostaining were not to shift the balance to
the same extent as unambiguously high IGF1R expressing cells. The distinction between membranous
and cytoplasmic IGF1R expression served to acknowledge
IGF1R’s biological characteristics even furthermore, as we
appreciated that a cytoplasmic localization of the IGF1R
reflects a state of activation [15]. Our evaluation scheme
therefore represents a further development beyond the
black and white scheme, which we used for the evaluation of tumor cells in our former study about IR expression in CRC [4]. We are aware that the different
evaluation schemes limit comparability between the
former IR and the present IGF1R study. We are optimistic that the large sample size of our studies and
the fact that the same TMA cores were used for both
studies, should level potential effects arising from different approaches.
Table 2 Correlation between the expression of the insulin-like growth factor receptor 1 (IGF1R) and the insulin receptor (IR) in
tumor cells
IR expression in tumor cells
IR expression in tumor vessels
negative
positive
low
high
n (%)
n (%)
n (%)
n (%)
p-Value
low (HScore < 90)
217 (33.0)
440 (67.0)
287 (43.7)
370 (56.3)
< 0.001
high (HScore ≥ 90)
188 (23.5)
613 (76.5)
230 (28.7)
570 (71.3)
low (HScore ≤ 10)
224 (29.9)
526 (70.1)
319 (42.5)
431 (57.5)
high (HScore > 10)
181 (25.6)
527 (74.4)
198 (28.0)
509 (72.0)
Cytoplasmic IGF1R expression
Membranous IGF1R expression
< 0.001
Heckl et al. BMC Cancer
(2020) 20:704
Other groups have not yet employed such an approach
for the evaluation of IGF1R expression in CRC: The
study conducted by Han et al. only evaluated the percentage of IGF1R expressing tumor cells, but not staining intensity [1]. Furthermore, membranous and
cytoplasmic staining were not distinguished. Shiratsuchi et al. [6], who associated IGF1R expression with
larger tumor sizes, employed a cut-off value of 10%
IGF1R immunopositive tumor cells irrespective of the
staining intensity without providing a rational for the
cut-off value. In order to rule out different evaluation
schemes as the reason for discrepant results, we performed a new survival analysis based on the evaluation of the percentage of stained cells only. Our new
survival analysis, though now being readily comparable, still opposes the results of the aforementioned
studies. Up to our knowledge, only a single study
pointed in the same direction, when Nakamura et al.
described a correlation between high IGF1R expression and a decreased risk of recurrence in Dukes C
CRC [5]. Unfortunately, the study population was
small (n = 161 CRC patients) and no correlations were
found with any other clinicopathological patient characteristics [5].
Interestingly, our study revealed a previously unknown association between IGF1R expression and the
MMR expression status in CRC. It might seem surprising to observe an association with IGF1R expression, as the MMR proficient CRC phenotype had
been associated with worse survival by some study
groups [16]. It has to be kept in mind that other
study groups have found no association with survival
such as Gkekas et al. [17] and that even our own data
only shows a tendency - without reaching significance
- for an improved survival of CRC patients with
dMMR [4]. The MMR proficient CRC phenotype and
IGF1R expressing CRCs basically share two key characteristics, which might explain their association: both
reflect a higher degree of differentiation and both are
associated with left-sidedness.
Up to now, IGF1R directed antibody therapy of tumor
entities other than CRC showed no promising results in
clinical trials. Several hypotheses exist, which try to explain the cause for the trials’ failures. One major hypothesis stated that IR expression might be upregulated upon
IGF1R inhibition [18] - the IR might compensate IGF1R
blockage, as IGF1R ligands also bind the IR, in particular
the IR’s mitogenic isoform A [18]. We proved in a
former study that IR isoform A is upregulated in CRC
[4]. We now show for the first time that IGF1R- and IRexpression are associated in CRC. It is therefore hypothetically conceivable that IGF1R-inhibition might be
compensated by IR signaling in CRC in the context of
the IR−/IGF1R-axis. Future studies have to evaluate if a
Page 11 of 12
therapeutic approach, which combines the inhibition of
IGF1R and IR isoform A in CRC, might prove to be
more successful. As the IGF1R and IR were predominantly expressed in lower tumor stages, this therapeutic
approach would be limited to early CRCs. Then again, as
no association between IGF1R expression and survival
was found in the present study and IR expressing CRCs
were found to have an even improved survival [4], it remains questionable, if even an IGF1R / IR-A-targeted
dual therapy is suitable for this tumor type. The IGF1R
seems to be beyond suspicion in CRC after all.
Conclusions
IGF1R expression is frequent and biologically relevant in
CRC and was associated with tumor localization, an
MMR proficient CRC phenotype, more differentiated tumors, less lymphatic vessel invasion and a lower tumor
size at diagnosis. We found no association between
IGF1R expression and survival in CRC, although a
strong tendency for longer overall survival was seen for
cytoplasmic IGF1R expression. We conclude that IGF1R
expression has been suspected wrongfully to promote
worse survival in CRC.
Abbreviations
IGF1R: insulin-like growth factor 1 receptor; CRC: colorectal cancer; IR: insulin
receptor; TMA: tissue microarrays; TBS: Tris-buffered saline;
HScore: HistoScore; OS: Overall survival; TSS: Tumor-specific survival; cCCIGF1R: Cytoplasmic IGF1R immunostaining of cancer cells; mCCIGF1R: Membranous IGF1R immunostaining of cancer cells; MMR: Mismatch
repair protein
Acknowledgements
Not applicable.
Authors’ contributions
SH, CR and SS designed the study. SS and CR funded the study. SH and CR
supervised the experiments. MP, SK, and SH performed the experiments. MP
obtained the data. H.-M.B performed the statistical analysis. SH, CR, MP and
SS interpreted the results. SH and CR wrote the manuscript. All authors read
and approved the final manuscript.
Funding
The study was financed by SS, who is the director of the Department of
Internal Medicine I, University Hospital Schleswig-Holstein, Kiel, Germany, and
by CR, who is the director of the Department of Pathology, ChristianAlbrechts-University, Kiel, Germany. Both funders are authors of the study.
Open access funding provided by Projekt DEAL.
Availability of data and materials
The datasets generated during and/or analyzed during the current study are
included in this published article and are otherwise available from the
corresponding author on reasonable request.
Ethics approval and consent to participate
All procedures followed were in accordance with the ethical standards of
the responsible ethical review board and with the Helsinki Declaration of
1964 and later versions. Ethical approval was received from the local ethical
review board (D416/19) of the University Hospital Schleswig-Holstein, Kiel,
Germany, which allowed us to use patient material from those patients who
had given written informed consent for a future scientific use of their samples and data. Accordingly, all patients included in this study had given written informed consent for their therapeutic surgery as well as for the
prospective future scientific use of their patient material and data.
Heckl et al. BMC Cancer
(2020) 20:704
Consent for publication
Not applicable.
Competing interests
The authors declare that they have no competing interests.
Author details
1
Department of Internal Medicine I, University Hospital Schleswig-Holstein,
Kiel, Germany. 2Department of Pathology, Christian-Albrechts-University, Kiel,
Germany.
Received: 7 April 2020 Accepted: 13 July 2020
References
1. Han L, Zhang GF, Cheng YH, Zhao QC. Correlations of insulin-like growth
factor I and insulin-like growth factor I receptor with the clinicopathological
features and prognosis of patients with colon cancer. Jpn J Clin Oncol.
2016;46(12):1127–34.
2. Takahari D, Yamada Y, Okita NT, Honda T, Hirashima Y, Matsubara J, et al.
Relationships of insulin-like growth factor-1 receptor and epidermal growth
factor receptor expression to clinical outcomes in patients with colorectal
cancer. Oncology. 2009;76(1):42–8.
3. Pandini G, Frasca F, Mineo R, Sciacca L, Vigneri R, Belfiore A. Insulin/insulinlike growth factor I hybrid receptors have different biological characteristics
depending on the insulin receptor isoform involved. J Biol Chem. 2002;
277(42):39684–95.
4. Heckl SM, Pellinghaus M, Kruger S, Bosselmann C, Wilhelm F, Behrens HM,
et al. Epithelial insulin receptor expression-prognostic relevance in
colorectal cancer. Oncotarget. 2018;9(101):37497–508.
5. Nakamura M, Miyamoto S, Maeda H, Zhang SC, Sangai T, Ishii G, et al. Low
levels of insulin-like growth factor type 1 receptor expression at cancer cell
membrane predict liver metastasis in Dukes' C human colorectal cancers.
Clin Cancer Res. 2004;10(24):8434–41.
6. Shiratsuchi I, Akagi Y, Kawahara A, Kinugasa T, Romeo K, Yoshida T, et al.
Expression of IGF-1 and IGF-1R and their relation to clinicopathological
factors in colorectal cancer. Anticancer Res. 2011;31(7):2541–5.
7. Becerra CR, Salazar R, Garcia-Carbonero R, Thomas AL, Vazquez-Mazon FJ,
Cassidy J, et al. Figitumumab in patients with refractory metastatic
colorectal cancer previously treated with standard therapies: a
nonrandomized, open-label, phase II trial. Cancer Chemother Pharmacol.
2014;73(4):695–702.
8. Cohn AL, Tabernero J, Maurel J, Nowara E, Sastre J, Chuah BY, et al. A
randomized, placebo-controlled phase 2 study of ganitumab or
conatumumab in combination with FOLFIRI for second-line treatment of
mutant KRAS metastatic colorectal cancer. Ann Oncol. 2013;24(7):1777–85.
9. Van Cutsem E, Eng C, Nowara E, Swieboda-Sadlej A, Tebbutt NC, Mitchell E,
et al. Randomized phase Ib/II trial of rilotumumab or ganitumab with
panitumumab versus panitumumab alone in patients with wild-type KRAS
metastatic colorectal cancer. Clin Cancer Res. 2014;20(16):4240–50.
10. Sobin LH, Gospodarowicz M, Wittekind C. TNM Classification of Malignant
Tumours. 7 ed. Chichester: Wiley-Blackwell; 2009.
11. Kononen J, Bubendorf L, Kallioniemi A, Barlund M, Schraml P, Leighton S,
et al. Tissue microarrays for high-throughput molecular profiling of tumor
specimens. Nat Med. 1998;4(7):844–7.
12. Remo A, Fassan M, Lanza G. Immunohistochemical evaluation of mismatch
repair proteins in colorectal carcinoma: the AIFEG/GIPAD proposal.
Pathologica. 2016;108(3):104–9.
13. Ogino S, Kawasaki T, Brahmandam M, Yan L, Cantor M, Namgyal C, et al.
Sensitive sequencing method for KRAS mutation detection by
pyrosequencing. J Mol Diagn. 2005;7(3):413–21.
14. Ii M, Li H, Adachi Y, Yamamoto H, Ohashi H, Taniguchi H, et al. The efficacy
of IGF-I receptor monoclonal antibody against human gastrointestinal
carcinomas is independent of k-ras mutation status. Clin Cancer Res. 2011;
17(15):5048–59.
15. Romanelli RJ, LeBeau AP, Fulmer CG, Lazzarino DA, Hochberg A, Wood TL.
Insulin-like growth factor type-I receptor internalization and recycling
mediate the sustained phosphorylation of Akt. J Biol Chem. 2007;282(31):
22513–24.
16. Klingbiel D, Saridaki Z, Roth AD, Bosman FT, Delorenzi M, Tejpar S. Prognosis
of stage II and III colon cancer treated with adjuvant 5-fluorouracil or
Page 12 of 12
FOLFIRI in relation to microsatellite status: results of the PETACC-3 trial. Ann
Oncol. 2015;26(1):126–32.
17. Gkekas I, Novotny J, Pecen L, Strigard K, Palmqvist R, Gunnarsson U.
Microsatellite instability as a prognostic factor in stage II Colon Cancer
patients, a meta-analysis of published literature. Anticancer Res. 2017;37(12):
6563–74.
18. Beckwith H, Yee D. Minireview: were the IGF signaling inhibitors all bad?
Mol Endocrinol. 2015;29(11):1549–57.
Publisher’s Note
Springer Nature remains neutral with regard to jurisdictional claims in
published maps and institutional affiliations.