The unique C- and N-terminal sequences of Metallothionein isoform 3 mediate growth inhibition and Vectorial active transport in MCF-7 cells
Bạn đang xem bản rút gọn của tài liệu. Xem và tải ngay bản đầy đủ của tài liệu tại đây (1.11 MB, 13 trang )
Voels et al. BMC Cancer (2017) 17:369
DOI 10.1186/s12885-017-3355-9
RESEARCH ARTICLE
Open Access
The unique C- and N-terminal sequences of
Metallothionein isoform 3 mediate growth
inhibition and Vectorial active transport in
MCF-7 cells
Brent Voels1,2†, Liping Wang1,3†, Donald A. Sens1, Scott H. Garrett1, Ke Zhang1 and Seema Somji1*
Abstract
Background: The 3rd isoform of the metallothionein (MT3) gene family has been shown to be overexpressed in
most ductal breast cancers. A previous study has shown that the stable transfection of MCF-7 cells with the MT3
gene inhibits cell growth. The goal of the present study was to determine the role of the unique C-terminal and
N-terminal sequences of MT3 on phenotypic properties and gene expression profiles of MCF-7 cells.
Methods: MCF-7 cells were transfected with various metallothionein gene constructs which contain the insertion
or the removal of the unique MT3 C- and N-terminal domains. Global gene expression analysis was performed on
the MCF-7 cells containing the various constructs and the expression of the unique C- and N- terminal domains of
MT3 was correlated to phenotypic properties of the cells.
Results: The results of the present study demonstrate that the C-terminal sequence of MT3, in the absence of the
N-terminal sequence, induces dome formation in MCF-7 cells, which in cell cultures is the phenotypic manifestation
of a cell’s ability to perform vectorial active transport. Global gene expression analysis demonstrated that the
increased expression of the GAGE gene family correlated with dome formation. Expression of the C-terminal
domain induced GAGE gene expression, whereas the N-terminal domain inhibited GAGE gene expression and that
the effect of the N-terminal domain inhibition was dominant over the C-terminal domain of MT3. Transfection with
the metallothionein 1E gene increased the expression of GAGE genes. In addition, both the C- and the N-terminal
sequences of the MT3 gene had growth inhibitory properties, which correlated to an increased expression of the
interferon alpha-inducible protein 6.
Conclusions: Our study shows that the C-terminal domain of MT3 confers dome formation in MCF-7 cells and the
presence of this domain induces expression of the GAGE family of genes. The differential effects of MT3 and
metallothionein 1E on the expression of GAGE genes suggests unique roles of these genes in the development and
progression of breast cancer. The finding that interferon alpha-inducible protein 6 expression is associated with the
ability of MT3 to inhibit growth needs further investigation.
Keywords: Breast cancer, MT3, MT1E, MCF-7, GAGE genes, PIP6, Dome formation, Vectorial active transport
* Correspondence:
†
Equal contributors
1
Department of Pathology, University of North Dakota, School of Medicine
and Health Sciences, 1301 N. Columbia Road, Stop 9037, Grand Forks, ND
58202, USA
Full list of author information is available at the end of the article
© The Author(s). 2017 Open Access This article is distributed under the terms of the Creative Commons Attribution 4.0
International License ( which permits unrestricted use, distribution, and
reproduction in any medium, provided you give appropriate credit to the original author(s) and the source, provide a link to
the Creative Commons license, and indicate if changes were made. The Creative Commons Public Domain Dedication waiver
( applies to the data made available in this article, unless otherwise stated.
Voels et al. BMC Cancer (2017) 17:369
Background
The metallothioneins (MTs) are a class of low-molecular
weight (Mr = 6000–7000), cysteine-rich, inducible, intracellular proteins best known for their high affinity to
bind heavy metals and mediate cell toxicity [1, 2]. In rodents, there are 4 isoforms of the MT protein designated
as MT1 through MT4 that can be characterized on the
basis of charge and sequence. These 4 MT isoforms are
each encoded by a single gene. The MT1 and MT2
isoforms have been extensively studied for their role in
mediating heavy metal toxicity. They have as a hallmark
their rapid transcriptional induction in almost all tissues
following exposure to metals, such as zinc and cadmium
[3]. In the mouse, the genes encoding MT1 and MT2
are approximately 6 kb apart on chromosome 8 and are
coordinately regulated and functionally equivalent [4, 5].
Two additional members of the MT gene family have
been identified and designated as MT3 and MT4 which
are closely linked to, but not coordinately regulated with
the other MT genes on mouse chromosome 8 [6, 7]. The
MT3 and MT4 family members have not received the
extensive study that characterized the MT1 and MT2
isoforms as mediators of cellular toxicity. While humans
possess the four major isoforms of MT (1, 2, 3, and 4)
that are present in rodents, due to a gene duplication
event, the human MT1 locus encodes additional MT1
isoforms that are not present in rodents. In humans, the
MTs are encoded by a family of genes located at 16q13
that encode 11 functional and 6 non-functional MT isoforms. The functional MT genes include 8 functional
MT1’s (1A, 1B, 1E, 1F, 1G, 1H, 1 M and 1X) and one
functional gene for MT2, MT3 and MT4 [8–10]. The
human MT1, MT2 and MT4 genes display a very high
level of sequence homology, which prevents the generation of an antibody specific for each of the MT1, 2 or 4
isoforms [11]. A mouse monoclonal, anti-horse MT antibody (E9) is commercially available that is easy to use and
has been shown to interact with the human MT1, MT2
and MT4 isoforms. This antibody has been used extensively on archival formalin-fixed, paraffin-embedded patient samples to define the immunohistochemical
expression of MT1, 2 and 4 in a variety of human cancers
[12, 13]. Overall, these studies have shown an association
of MT1 and MT2 overexpression with the type and grade
of the tumor, with aggressive cancers having the highest
levels of MT1/2 expression.
This laboratory is interested in examining the expression of MT3 in human disease since the MT3 isoform
has several unique features that distinguish it from the
MT1 and MT2 isoforms. The MT3 isoform has a very
limited distribution in normal tissues compared to the
MT1 and MT2 isoforms and was initially characterized
as a brain-specific MT family member [7]. This isoform
is not induced by exposure to metals or other factors
Page 2 of 13
shown to elicit large increases of gene transcription for
the MT1 and MT2 isoforms. The MT3 protein was
originally named growth inhibitory factor, but was subsequently renamed MT3 when it was shown to possess
many of the characteristic features of the traditional
MTs, including transition metal binding [14, 15]. The
MT3 isoform has two structurally unique features
compared to all other MT family members. It possesses
7 additional amino acids that are not present in any
other member of the MT gene family, a 6 amino acid
C-terminal sequence and a threonine (Thr) in the Nterminal region [7, 14, 15]. The unique C-terminal
sequence has allowed this laboratory to generate a
MT3 specific antibody [16]. Functionally, MT3 has
been shown to possess a neuronal cell growth inhibitory activity which is not duplicated by the other
human MT classes [15, 17]. This non-duplication of
function occurs despite a 63–69% homology in amino
acid sequence among MT3 and the other human MT
isoforms [11]. The neuronal growth inhibitory activity
of MT3 has been shown to require the unique Nterminal Thr sequence and not the unique 6 amino
acid C-terminal sequence [11]. To date, no function
has been assigned to the unique C-terminal sequence
of MT3.
The present study was designed to further define the
role of MT3 expression in human breast cancer. This
laboratory has shown that MT3 mRNA and protein is
not expressed in normal human breast tissue [18]. A
corresponding immunohistochemical analysis of MT3
expression in a small archival set of patient samples of
human breast cancers showed that all breast cancers
stained positive for the MT3 protein and that the level
of expression was associated with cancers having a poor
prognosis. An expansion of this study to a much larger
archival set of patient samples showed that few of the
breast cancers did not express MT3, but that the
absence of MT3 expression was a favorable marker for
disease outcome [19]. A high frequency of MT3 staining
was also demonstrated for in situ breast cancer, suggesting MT3 might be an early biomarker for disease development. It was also shown in the above study that the
MCF-10A breast cell line had no expression of MT3,
but the expression could be induced following treatment
with a histone deacetylase inhibitor and that the MT3
metal regulatory elements were potentially active binders
of transcription factors following treatment. In addition,
the laboratory has shown that the MCF-7 breast cancer
cell line does not express MT3 and that stable transfection and expression of the MT3 gene inhibits the growth
of the MCF-7 cells. The expression of MT3 in breast
cancer has also been observed in other studies [20–22]
and in triple negative breast cancers, it has been suggested that its expression is associated with poor
Voels et al. BMC Cancer (2017) 17:369
Page 3 of 13
prognosis [22]. In pediatric acute myeloid leukemia, the
promoter of the MT3 gene is hypermethylated suggesting that it may function as a tumor suppressor [23].
The goal of the present study was to determine the
role of the C-terminal and N-terminal sequences of
MT3 on phenotypic properties and gene expression
profiles of MCF-7 cells.
Transfected cells were allowed to reach confluency in
one well of a 6-well plate and then sub-cultured at a
1:10 ratio into a 6-well plate. Transfected cells were
propagated in media containing 10 μg/mL blasticidin
(Invitrogen, CA). Selected colonies were expanded and
harvested for RNA isolation. Positive clones were expanded and used for downstream applications.
Methods
Real-time PCR and Western blot analysis
Cell culture
The level of expression of mRNA from the MCF-7 cells
transfected with wild type MT3 and the various C- and
N-terminal mutations was determined using specific
primers to the V5 region of the expression vector. The
sequences of the primers are: forward 5- TTCGAAGGTAAGCCTATCCCT -3 and reverse 5- AGTCATTACTAACCGGTACGC -3. The primers used for the GAGE
antigen were obtained from Qiagen and are as follows:
GAGE2C (Cat no. QT01001035), GAGE2E-1 (Cat no.
QT01018696), GAGE2E-2 (Cat no. QT01672202), GAGE4
(Cat no. QT00197015), GAGE5 (Cat no. QT01001042),
GAGE6 (Cat no. QT01001049), GAGE12G (Cat no.
QT01530627) and GAGE12H (Cat no. QT01664495).
Real-time PCR was performed utilizing the SYBR Green
kit (Bio-Rad, CA) with 2 μl of cDNA, 1 μl primers in a
total volume of 20 μl in CFX real-time detection system
(Bio-Rad, CA). The denaturation was performed at 94 °C,
followed by annealing at 60 °C and extension at 72 °C. The
amplification was monitored by SYBR Green fluorescence.
The data was compared with that of a standard curve
consisting of serial dilutions of cDNA from the pcDNA
6.2/V5 transfected cells. The expression of mRNA for the
G antigen (GAGE) genes was assessed using gene-specific
primers (Bio-Rad, CA). GAGE gene expression is
expressed as fold change compared to the MCF-7 cells
tranfected with the blank pcDNA 6.2/V5 vector. Western
blot analysis of the GAGE gene family was performed
using protocols described previously [26]. The primary
GAGE7 antibody was purchased from Thermo Fisher
Scientific (Rockford, IL).The antibody was made against
amino acids 87–116 of the C-terminal region of human
GAGE7. A blast search has shown that this sequence is
present in all GAGE isoforms and can detect all isoforms
of the GAGE protein. The blots were visualized using
Clarity Western ECL (Bio-Rad Laboratories).
The MCF-7 cell line (Cat. No. ATCC® HTB22™) was obtained from the American Type Culture Collection
(Rockville, MD), grown in Dulbecco’s Modified Eagles’
medium supplemented with 5% (v/v) fetal calf serum,
and routinely passaged at a 1:4 ratio upon attaining
confluence. Growth curves were generated following
subculture of confluent cultures of wild type MCF-7
cells and their stable transformants at a 1:100 ratio into
six-well plates. The increase in cell growth was determined every 24 h by measuring the capacity of the cells
to reduce MTT (3-(4,5-dimethylthiazol-2-yl)-2,5-diphenyltetrazolium bromide) to formazan [24]. The absorbance was determined at 570 nm using a plate reader
with acidic propanol as the blank. Triplicate cultures
were analyzed at each time point and doubling times
calculated from the linear region of the exponential
portion of the growth curve.
Stable transfection of MCF-7 cells
The various gene constructs that were made by the
alteration of the unique MT3 N- and C-terminal region
have been described in detail previously [25]. These constructs were stably transfected into the MCF-7 cells and
are designated as wild type MT3 (MT3), MT3 with an
N-terminal mutation where the two essential prolines
were converted to threonines (MT3ΔNT), MT3 with a
C-terminal deletion where the unique EAAEAE Cterminal sequence was deleted (MT3ΔCT), wild type
MT1E (MT1E), MT1E where the MT3 N-terminal
sequence was inserted into the corresponding position
of MT1E (MT1E-NT), and MT1E where the C-terminal
sequence EAAEAE of MT3 was inserted into the corresponding position of MT1E (MT1E-CT). The constructs
were blunt end ligated into the 6.2/V5 Destination vector (Invitrogen, NY) and were linearized using BspHI
(New England Biolabs, MA) prior to transfection using
the Effectene reagent (Qiagen, CA). Sequence design for
ligation was done utilizing the Vector NTI® computer
software (Life Technologies, NY). Generation of the mutant sequences and ligation of the genes was conducted
by GenScript (Piscataway, NJ) using the wild type MT3
gene sequence. Plasmids were transformed using One
Shot® TOP10/P3 E. coli cells (Life Technologies, NY)
and purified using a Qiagen midi prep kit (Qiagen, CA).
Dome formation by MCF-7 cell lines
The various MCF-7 cell lines were grown in triplicates
in T-25 flasks. Cells were fed fresh growth media every
three days and cultures were observed for dome formation at confluency. A dome is defined microscopically
when a group of cells appears out-of-focus in relation to
the in-focus monolayer, and conversely when the dome
is in-focus, the rest of the monolayer appears out-offocus. The number of domes in a field of view was
Voels et al. BMC Cancer (2017) 17:369
determined for each culture and a field of view is defined by the area examined through a 100× field of view.
Twenty-one field of views were observed for each T-25
culture flask.
Transepithelial resistance
Measurement of transepithelial resistance (TER) was
performed as described previously [27]. Briefly, cells
were seeded at a 2:1 ratio in triplicate onto 30 mm diameter cellulose ester membrane inserts (Corning, NY)
placed in six-well trays. Beginning on the fifth day postseeding, TER was measured on day 5, 6 and 7 with the
EVOM Epithelial Voltohmmeter (World Precision
Instruments, Sarasota, FL) with a STX2 electrode set according to the manufactures instructions. The resistance
of the bare filter containing medium was subtracted
from that obtained from filters containing cell monolayers. Two sets of four readings were taken at two
different locations on each filter. Parallel cultures of the
cells were also monitored for dome formation. The
experiment was performed in triplicates and the final
result reported as the mean ± SE.
Preparation of RNA for microarray analysis
The Qiagen RNeasy Mini Kit was used to prepare RNA
samples from the various MCF-7 cell lines for use in
microarray analysis. RNA was harvested from confluent
cultures of cells during periods where dome formation
was present in cultures previously shown to form domes.
The cells were lysed in RLT buffer containing βmercaptoethanol. The QiaShredder column was used to
homogenize the lysates and the RNA was isolated
following the manufacturers protocols.
Microarray analysis
RNA samples were sent to the University of Minnesota
Genomics Center for microarray analysis. The Human
HT-12v4 Expression BeadChip (Illumina, CA) was utilized to determine genome wide gene expression levels.
The Bioinformatics core facility at the University of
North Dakota School of Health and Medicine Sciences
analyzed the resulting data for differentially expressed
genes. Differentially expressed probe sets (DEGs) were
identified using Significance Analysis of Microarrays
(SAM) method [28] and the p-values were adjusted
using false discovery rate. The analyses were carried out
using R programming language.
A new clustering method, overlap hierarchical clustering (OHC) was developed to assess the similarity and
variation across isolates. In order to reflect the gene expression changes, a new dissimilarity measure, overlap
distance, was introduced to hierarchical clustering. Overlap distance measures are based on the number of genes
that have large fold changes in both transformed cell
Page 4 of 13
lines comparing with parental MCF-7 cells. The fold
change of each probe in each array from a transformed
cell line was calculated over its average expression level
in the parental MCF-7 cell line. If the fold change was
greater than 2 in the transformed cell line A, the probe
was selected for the gene set A. The overlap distance
between cell lines A and B was calculated as follows:
∣A∩B∣
DðA; BÞ ¼ 1− ∣A∪B∣
.
The distance between two clusters was calculated by
Ward’s linkage method.
Statistics
All experiments were performed in triplicates and the
results are expressed as the standard error of the mean.
Statistical analyses were performed using GraphPad
Prism® software using separate variance t-tests, ANOVA
with Tukey post-hoc testing.
Results
Measurement of dome formation, an indicator of
vectorial active transport in MCF-7 cells
Domes are a hallmark of cultured epithelial cells that
retain the in situ property of vectorial active transport
[29–31]. As detailed in these reports, these out-of-focus
areas of the cell monolayer seen upon light microscopic
examination represent raised areas where fluid is
trapped underneath the monolayer owing to active
transport of ions and water across the cell monolayer in
an apical to basolateral direction. This in turn traps a
bubble of fluid between the cell layer and the culture
dish, forcing local detachment of the monolayer from
the plastic surface forming a raised area with an underneath reservoir of accumulated fluid. The three requirements for dome formation by a cell is the presence of
basolateral Na+,K+-ATPase, apical tight junctions and
electrogenic active transport. There is no evidence in
our study that wild type MCF-7 cells form domes in cell
culture. An unexpected result in the present study was
the finding that MCF-7 cells stably transfected with selected MT gene constructs containing the C-terminal
domain of MT3 gained the ability to form domes. In the
present study, the number of domes in a 100× microscopic field was used to quantify dome formation by the
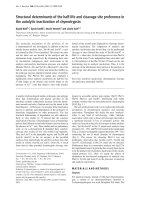
stably transfected MCF-7 cell lines. To illustrate the
structure counted, a typical dome formed by transporting renal epithelial cells is shown at 100× magnification
for a human proximal tubule cell culture from this
laboratory [31], as well as one from a MCF-7 cell line
expressing the C-terminal domain of MT3 (MT1E-CT),
both at 100× magnification (Fig. 1a and b). There were 2
experimental conditions where the MCF-7 cells gained
Voels et al. BMC Cancer (2017) 17:369
Page 5 of 13
Fig. 1 Light level morphology of domes. a. Dome formation in human proximal tubule cells. b. Dome formation in MCF-7 cells expressing the Cterminal domain of MT3 (MT1E-CT). Arrows indicate the presence of domes (both at 100× magnification)
the ability to form domes (Table 1). The first was when
the MCF-7 cells were stably transfected with the MT1E
gene modified to contain the C-terminal sequence of
MT3 (MT1E-CT). The second was when the MCF-7 cells
were stably transfected with the MT3 gene sequence with
a mutated N-terminal domain (MT3ΔNT). The MCF-7
cells stably transfected with the wild type MT3 (MT3)
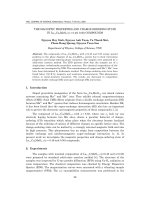
formed very few small domes. Real time PCR was
performed on each stably transfected MCF-7 cell line to
confirm the expression of the constructs and the results
showed that each construct was expressed as expected in
each of the respective MCF-7 cell lines (Fig. 2).
The TERs of monolayer cultures of the parental MCF7 cell line and their stably transformed counterparts
were measured on days 5, 6 and 7 after the cells attained
confluence. Transepithelial resistance is an established
method to determine the presence of tight junctions
between cells along with the cells ionic permeability.
The results demonstrated that all the MCF-7 cell
lines generated a measurable TER of similar magnitude (Table 2). This level of TER would be indicative
of a cell line having tight junctions between cells, but
with a high permeability to ion movement and it
would be classified as a monolayer with “leaky tight
junctions”. Thus, these results suggest that the Cand N-terminal domain have no influence on TER,
since the TER did not change when the MCF-7 cells
were transfected with any of the constructs.
Effect of MT-3 C- and -N terminal sequence alteration on
gene expression patterns in MCF-7 cells
Total RNA was isolated from triplicate samples of the
wild type MCF-7 cells and the constructs and the samples were subjected to global gene expression analysis
employing the Illumia human HT-12v4 expression bead
chip. The relationship of the resulting gene expression
patterns among all the samples was assessed using the
overlap hierarchical clustering (OHC) method. This
Table 1 Number of domes observed in various MCF-7 MT3
mutants
MCF-7 Cell Lines Domes
observed
Average number of Average number of
domes observed
domes observed
per field of view
per 21 fields of view
MT3
Yes/No
0.1
2.1
MT3ΔCT
Yes
2.72
57.22
MT3ΔNT
No
0
0
MT1E
No
0
0
MT1E-CT
Yes
2.69
56.44
MT1E-NT
No
0
0
MCF-7 (parent)
No
0
0
pcDNA 6.2/V5
Blank vector
No
0
0
Fig. 2 Expression of MT3 mutants in MCF-7 cells. Real time PCR
analysis was performed to determine the expression of the pcDNA
6.2/V5vector through the amplification of the common V5 sequence
in the 3 prime end of the expressed sequence. The results are
expressed per 106 transcripts of 18S ribosomal RNA. The data is
plotted as the mean ± SEM of 3 independent determinations
Voels et al. BMC Cancer (2017) 17:369
Page 6 of 13
Table 2 TERs measured in various MCF-7 MT3 mutants
MCF-7 Cell Lines
Average TER Day 5
(Ω/cm2)
Average TER Day 6
(Ω/cm2)
Average TER Day 7
(Ω/cm2)
Average TER Day 5, 6 and 7
(Ω/cm2)
MT3
35.32 +/− 5.81
53.57 +/− 13.88
52.27 +/− 12.11
48.72
MT3ΔCT
41.99 +/− 9.26
53.08 +/− 9.57
47.67 +/− 5.16
47.58
MT3ΔNT
26.39 +/− 1.99
44.06 +/− 3.37
28.16 +/− 5.87
32.87
MT1E
32.68 +/− 7.26
35.92 +/− 6.98
30.91 +/− 8.41
33.17
MT1E-CT
22.96 +/− 11.94
29.34 +/− 9.40
37.98 +/− 7.07
30.09
MT1E-NT
37.58 +/− 10.23
34.3 +/− 9.4
32.28 +/− 12.61
34.72
MCF-7 (parent)
38.80 +/− 12.10
22.21 +/− 4.63
32.4 +/− 1.92
31.13
pcDNA 6.2/V5 Blank vector
41.99 +/− 5.38
27.38 +/− 10.76
36.80 +/− 6.48
35.39
Average TER for each mutant cell line was measured on days 5, 6 and 7 and is expressed as Ω/cm2 +/− the SEM. The combined average TER for days 5, 6 and 7
was used to determine the relationship between TER and the presence or absence of the N- and C- terminal region of MT3. No statistical significance using the
one-way ANOVA test and Dunnet’s post-test for multiple comparisons using the pcDNA 6.2/V5 cell line as control
analysis allowed an initial assessment of the overall relationship of global gene expression patterns to the presence of the two unique domains of MT3, the C-terminal
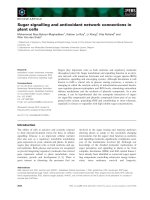
and the N-terminal domains. The results of this analysis
demonstrated that the relationship in overall gene
expression patterns among all the RNA samples is highly
dependent on the presence or absence of the C- and Nterminal domains of the MT3 molecule (Fig. 3). The
RNA samples from transfectants possessing the Nterminal domain resided in the upper cluster of the dendrogram and those possessing the C-terminal domain
resided in the low cluster of the dendrogram. The triplicate isolates of MCF-7 cells stably transfected with the
MT3 wild type gene were split between the two clusters,
with 2 of the 3 isolates in the upper N-terminal cluster
of the dendrogram and the remaining isolate in the
lower C-terminal cluster. The segregation of the triplicate wild type MT3 MCF-7 cells into the two clusters
renders it unclear which domain of the MT3 molecule
exhibits dominant activity.
Correlation of global gene expression profiles and the
induction of dome formation by MT3 C-terminal
sequences in stably transfected MCF-7 cells
The ability of the MT1E gene, when modified to contain
the C-terminal sequence of MT3, to induce dome formation by MCF-7 cells provides a phenotypic alteration
that can be correlated to global gene expression profiles.
Three paired comparisons were analyzed to determine
potential correlations between dome formation and the
C- and N-terminal domains of MT3. The first was a
comparison of MCF-7 transfected by the wild type
MT1E gene (MT1E) with that of the cells transfected
with MT1E modified to contain the C-terminal sequence
of MT3 (MT1E-CT). The second was a comparison of
MCF-7 cells transfected with MT1E compared with
that of the cells transfected with MT1E modified to
contain the N-terminal sequence (MT1E-NT). The
Fig. 3 Dendogram showing the relatedness of global gene expression
patterns among MCF-7 cells stably expressing each metallothionein
construct. Constructs contain either wild-type MT3, MT3 with the
N-terminal domain mutated (MT3ΔNT), the C-terminal domain
mutated (MT3ΔCT), wild type MT1E, MT1E containing the N-terminal
domain of MT3 (MT1E-NT), MT1E with the C-terminal domain of MT3
(MT1E-CT), or the blank vector (pcDNA 6.2/V5). The effect of each
construct was assessed in triplicate with each triplicate shown
individually as either (a), (b), or (c). The clustering was assessed by
overlap hierarchical clustering
Voels et al. BMC Cancer (2017) 17:369
final comparison was the MCF-7 cells transfected
with the wild type MT3 gene (MT3) compared with
that of cells transfected with the MT3 gene with a
mutated N-terminal sequence (MT3ΔNT). The results of
these comparisons are presented in Additional files 1, 2
and 3 respectively.
The results of the paired comparisons with one another demonstrates a strong correlation of GAGE family
gene expression with the ability of the MCF-7 cells to
form domes. GAGE family genes were up-regulated and
the MCF-7 cells were able to dome when the MCF-7
cells were transfected with the MT1E gene containing
the C-terminal sequence of MT3 (MT1E vs MT1E-CT,
Additional file 1) and when the MCF-7 cells were transfected with an MT3 construct containing a mutated Nterminal sequence (MT3 vs MT3ΔNT, Additional file 3).
In contrast, the GAGE family of genes were downregulated and the cells did not form domes, when the
MCF-7 cells were transfected with MT1E containing the
N-terminal sequence of MT3 (MT1E vs MT1E-NT,
Additional file 2). Thus, the paired comparisons implicate the GAGE family of genes in the ability of the Cterminal sequence of MT3 to induce dome formation in
MCF-7 cells transfected with the MT1E or MT3 gene.
Page 7 of 13
Validation of GAGE gene expression in MCF-7 cells
transfected with C- and N-terminal sequence of MT3
Based on the results of the above microarray comparison,
the expression of the GAGE family of genes was confirmed using real-time PCR. Due to sequence homology,
the genes that were validated were: GAGE2C; GAGE2E-1;
GAGE2E-2; GAGE4; GAGE5; GAGE6; GAGE12G; and,
GAGE12H. GAGE12F was not validated since a suitable
primer sequence could not be identified for use. Several
general patterns of gene expression were observed for the
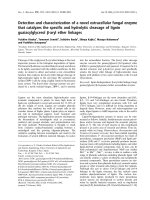
GAGE gene family (Figs 4 and 5). The first was when total
RNA from MCF-7 cells carrying a blank vector control
(pc DNA 6.2/V5) was analyzed against total RNA from
the WTMT3, MT3ΔCT and, MT1E-NT cell lines. The
results from this analysis showed that all the three cell
lines had significantly lower expression of GAGE2C,
GAGE2E-1, GAGE2E-2, GAGE5, GAGE6 and GAGE12H
genes and there was a trend for reduced expression of the
GAGE4 and CAGE12 genes. A second pattern of expression was found when GAGE gene expression was compared between the blank vector control and the MT1E cell
lines. In this analysis, the expression of 6 of the 8 GAGE
family members was increased in MCF-7 cells stably
transfected with the MT1E gene (GAGE2C, GAGE2E-2,
Fig. 4 Expression of GAGE genes in MCF-7 cells transfected with various MT3 mutants. Real time PCR analysis of GAGE2C (a), GAGE2E-1 (b),
GAGE2E-2 (c) and GAGE4 (d) genes. The results are expressed as fold change compared to the vector pcDNA 6.2/V5. *denotes significantly
different from vector control (p < 0.05). **denotes significantly different from vector control (p < 0.01). ***significantly different from vector control
(p < 0.001). The data is plotted as the mean ± SEM of 3 independent determinations
Voels et al. BMC Cancer (2017) 17:369
Page 8 of 13
Fig. 5 Expression of GAGE genes in MCF-7 cells transfected with various MT3 mutants. Real time PCR analysis of GAGE5 (a), GAGE6 (b), GAGE12G
(c) and GAGE12H (d) genes. The results are expressed as fold change compared to the vector pcDNA 6.2/V5. **denotes significantly different from
vector control (p < 0.01). ***significantly different from vector control (p < 0.001). The data is plotted as the mean ± SEM of 3
independent determinations
GAGE4, GAGE5, GAGE12G, GAGE12H). The remaining
2 GAGE genes (GAGE2E-1, GAGE6) showed no difference
in expression. In addition, 7 of the 8 GAGE genes were
also increased when MT1E-CT was compared to the blank
vector control or the MT1E construct, the exception being
the GAGE2E-1 gene. Finally, confirming the results of the
above microarray analysis, all the MCF-7 cell lines containing an N-terminal sequence (MT3, MT3ΔCT, MT1E-NT)
had reduced expression of all the GAGE genes when compared to the MCF-7 cell lines containing a C-terminal sequence (MT3ΔNT, MT1E-CT) or MT1E.
The GAGE gene family displays a very high sequence
homology, which has prevented the generation of antibodies against the individual GAGE family members. A
polyclonal antibody that recognized multiple members
of the GAGE family is available. This antibody was used
in Western blot analysis to determine the combined
expression of the GAGE family proteins (Fig. 6). The
results showed an overall trend of GAGE protein expression that followed the mRNA expression pattern for the
individual GAGE genes, that is, all the MCF-7 cell lines
containing an N-terminal sequence (MT3, MT3ΔCT,
MT1E-NT) had reduced expression of the GAGE proteins when compared to the MCF-7 cell lines containing
a C-terminal sequence (MT3ΔNT, MT1E-CT) or MT1E.
There was a decrease in expression of GAGE proteins in
the MCF-7 cells containing the MT3ΔCT and MT1ENT constructs when compared to the cells expressing
the blank vector pcDNA 6.2/V5, whereas the cells containing the MT3ΔNT and MT1E-CT constructs showed
significant increases in GAGE protein expression when
compared to the cells expressing the blank vector
pcDNA 6.2/V5. The fact that the antibody recognizes
the protein from multiple GAGE family members limits
the significance of the findings to individual family
members.
Correlation of global gene expression profiles and
the inhibition of cell growth by MT3 C-terminal and
N-terminal sequences in stably transfected MCF-7 cells
As detailed in the introduction, the laboratory has previously shown that stable transfection of MCF-7 cells with
the MT3 coding sequence inhibits the growth of the
MCF-7 cell line. The doubling times of MCF-7 cells in
their logarithmic growth phase was determined for wild
type MCF-7 cells and MCF-7 cells stably transfected
with the various constructs containing the addition and
deletions of the C- and N-terminals. The results showed
Voels et al. BMC Cancer (2017) 17:369
Page 9 of 13
Fig. 7 Doubling times of MCF-7 cells transfected with various MT3
mutants. The doubling times of the transfected cells were compared
to that of the blank vector control pcDNA 6.2/V5. ***significantly
increased compared to pcDNA 6.2/V5 (p < 0.001). The data is plotted
as the mean ± SEM of 3 independent determinations
Fig. 6 Western blot analysis of GAGE gene expression in MCF-7 cells
transfected with various MT3 mutants. (a and b). The integrated
optical density (IOD) of each band was normalized to the IOD of
β-actin. **denotes significantly different from vector control
(p < 0.01). *** Significantly different from vector control
(p < 0.001).The data is plotted as the mean ± SEM of 3 independent
experiments. The image shown is representative of one of the three
Western blots performed
that the wild type MCF-7 cells (Parent), MCF-7 cells stably transfected with the MT1E coding sequence (MT1E),
and MCF-7 cells stably transfected with a blank vector
control had similar doubling times (Fig. 7). The doubling
times were 32.5 ± 4.4, 35.8 ± 4.7 and 39.5 ± 5.9 h respectively. In contrast, the MCF-7 cells stably transfected with MT3, MT3ΔNT, MT3ΔCT, MT1E-NT, and
MT1E-CT all displayed significantly higher doubling
times (Fig. 7). The doubling times were 53.1 ± 2.2,
57.3 ± 3.8, 64.7 ± 5.2, 60.9 ± 3.3, and 55.2 ± 11.2 h,
respectively. There were no significant differences of
doubling times within the members of each of the two
groups. These results indicate that both the C-terminal
and N-terminal sequences of MT3 reduce the rate of
growth of MCF-7 cells.
In order to determine if the mechanism of action
involved in the growth inhibition elicited by the C- and
N-terminal domains were similar, the global gene
expression profiles were examined and a comparison was
made between MCF-7 cells transfected with MT1E versus
MT1E-CT and MT1E-NT, respectively (Additional files 1
and 2). The results demonstrated that there were 5 genes
common to both sets. Phosphoglucomutase-like protein 5
(PGM5) and insulin like growth factor binding protein 5
(IGFBP5) were upregulated whereas interferon alphainducible protein 6 (IFI6), DnaJ heat shock protein family
(Hsp40) member C12 (DNAJC12) and protein S (alpha)
(PROS1) were downregulated in MT1E-CT and MT1ENT. The expression of these genes were then determined
in the other sets that also showed reduced growth rates. A
comparison was made between the MCF-7 cells (blank
vector control) versus MT3 (Additional file 4), MT3ΔCT
(Additional file 5), and MT3ΔNT (Additional file 6). The
only gene common among the 5 sets of comparisons that
correlated to reduced cell growth was the downregulation of IPI6 in cells containing the C- or N-terminal
sequence of MT3.
Discussion
As detailed in the introduction, this laboratory has
shown that stable transfection of MCF-7 cells with MT3
results in the inhibition of cell growth. The original goal
of the present study was to determine if the unique Nterminal sequence of MT3 was necessary for the inhibition of MCF-7 cell growth, similar to that found for the
N-terminal sequence in the neural system [11]. The
strategy employed involved the stable transfection of the
Voels et al. BMC Cancer (2017) 17:369
MCF-7 cells with various MT constructs deleting or adding the unique C- and N-terminal sequences of MT3.
The human MT1E gene was chosen as the vector for
transfection of the MCF-7 cells with additions of the
unique C- and N-terminal sequences of MT3 because
this laboratory has previously shown that the MT1E
gene is not expressed in MCF-7 cells [32]. The results of
these stable transfections, coupled with an analysis of
global gene expression profiles, provided several new
insights on the contributions of the C- and N-terminal
sequences to the function of MT3 well beyond the
possible role of the N-terminal sequence in the inhibition of MCF-7 cell growth.
A unique finding in the present study was the elucidation of an MCF-7 cell phenotype that could be correlated with the C-terminal sequence of MT3. This cell
phenotype was the ability of the MCF-7 cells to form
domes in culture, a manifestation of vectorial active
transport, a process that requires electrogenic active sodium transport, a functional Na+,K+-ATPase and apical
tight junctions between cells. The results demonstrated
very convincingly that MCF-7 cells transfected with the
MT1E gene, modified to contain the C-terminal
sequence of MT3, gained the ability to form domes in
culture. It was also demonstrated that MCF-7 cells
transfected with MT3 having a mutated N-terminal
sequence, but containing an unmodified C-terminal sequence, also allowed the cells to form domes in culture.
Overall, the stable transfection strategy showed that the
presence of the C-terminal sequence, in the absence of
the N-terminal sequence, allowed MCF-7 cells to gain
the function of vectorial active transport. However, when
the N-terminal sequence was present it was dominant
over the C-terminal sequence and the ability to induce
vectorial active transport was inhibited in the MCF-7
cells. The series of stable transfectants was subjected to
global gene expression analysis and the results suggested
that an increase in the expression of the GAGE gene
family was correlated with the ability of the C-terminal
sequence to induce dome formation and the N-terminal
sequence in preventing dome formation. However, the
differences in global gene expression patterns were not
large and the results were successfully validated by realtime PCR for the GAGE2C; GAGE2E-1; GAGE2E-2;
GAGE4; GAGE5; GAGE6; GAGE12G; and GAGE12H
family members. The results of the validation were consistent with the N-terminal sequence of MT3 suppressing the expression of the GAGE gene family in MCF-7
cells, and when absent, with the ability of the C-terminal
sequence to induce GAGE gene expression in the cells.
Due to the extensive sequence homology between members of the GAGE gene family, the antibody used for this
study cross-reacts with several of the family members
and the data obtained from the Western blot analysis
Page 10 of 13
showed overall GAGE protein expression in agreement
with the mRNA expression of the individual GAGE family members.
There is only limited information available on the
GAGE gene family. The GAGE antigens are a member
of the cancer/testis (CT) antigen group of proteins
expressed only in germ cells of healthy individuals. Currently there are eighty-nine CT antigens all of which are
encoded on the X chromosome [33]. The GAGE antigens are a family of CT antigens consisting of 13 to 39
copies of nearly identical genes on chromosome x at
p11.23 [34]. The promoters of the GAGE antigen family
have no TATA box, and have only one or two different
base pairs in the first fourteen hundred base pairs of the
promoter [33]. The lack of a TATA box site for initiation
allows transcription to start from several different sites
leading to transcripts of varying lengths [35]. The exact
biological function of the GAGE antigens is unknown,
but recent evidence suggests that they may direct cell
proliferation, differentiation, and the survival of germ
line cells [36]. Anti-apoptotic properties have been attributed to GAGE antigens [35]. Expression of the
GAGE antigens normally occurs in a subset of oocytes
in the adult ovary [37], adult male germ cells, and for a
few weeks in fetal Leydig and Sertoli cells during the
third trimester [38].
Despite the very limited distribution of GAGE antigens
in the germ cells of healthy individuals, they have been
found to gain expression in a variety of human cancers.
The expression of GAGE antigens in stomach cancer,
neuroblastoma, and esophageal carcinoma has been
correlated with a poor prognosis and aggressive tumor
type [39–41]. The activation of the GAGE antigens in a
variety of cancers, as well as the cancer/testis antigens in
general, has been the subject of a recent review [42]. Important to the current study is that two studies do show
an alteration of GAGE gene expression in breast cancer
[37, 43]. The first showed an increase in GAGE gene
transcripts in 26% of breast cancers and the second, in
17% of breast cancers. The expression of GAGE was
localized primarily in the cytoplasm with rare profiles of
nuclear localization. Moderate expression was found in
9 of 54 tumor samples and strong staining in 8 of the 54
cases. GAGE expression was negative in grade 1 tumor
samples with positivity restricted to grade 2 and 3
tumors. There was a trend for, but not a statistically
significant, negative effect of GAGE expression on
disease-free survival and overall survival [43]. These
findings are important for the present study since the
expression of MT3 in the MCF-7 cell line inhibits the
expression of the GAGE genes. Further studies to define
the expression of the GAGE proteins in breast cancer
and the mechanism by which MT3 inhibits GAGE gene
expression in MCF-7 cells are currently hindered by the
Voels et al. BMC Cancer (2017) 17:369
lack of antibodies specific to the individual GAGE family
members. In addition, the high degree of sequence homology within the family and the lack of a TATA box in
the promoter may further complicate the generation of
GAGE specific reagents.
A second interesting and unexpected finding in the
present study was that GAGE gene expression increased
when the MCF-7 cells were stably transfected to express
the MT1E isoform. The MT1E gene was chosen as a
vector in the present study to determine the effect of the
unique C- and N-terminal sequences of MT3 since it is
not expressed in the MCF-7 cell line [32]. However, the
MCF-7 cell line does express other isoforms as the
MT2A and MT1X genes have been shown to have basal
expression [32]. The induction of GAGE gene expression
by the MT1E isoform is interesting since there is some
evidence that the expression of MT1E is altered in
breast cancer and breast cancer cell lines. The above referenced study that showed MT1E not being expressed in
MCF-7 cells also showed that the expression of MT1E
was absent in an additional estrogen receptor positive
cell line T-47D. In contrast, both Hs578T and MDAMB-231, which are estrogen receptor negative cell lines,
were shown to express the MT1E isoform. These results
suggested a possible relationship between estrogen
receptor status and MT1E gene expression. Evidence
that this finding might translate to human specimens of
breast cancer tumors is provided by a study on a series
of fresh breast cancers which showed that the MT1E
isoform was highly expressed in estrogen receptor negative compared to estrogen receptor positive breast cancers [44]. Exploring a potential relationship between the
GAGE gene family and the MT1 and MT2 gene family
would be of interest, since the expression of MT1/2 has
been studied extensively decades ago in ductal breast
cancer. The overexpression has been shown to occur
early in the disease and is associated with the more malignant, higher-grade tumors, and therefore with poor
patient prognosis [45–51]. The expression of MT1/2 has
been shown to predict resistance to tamoxifen [52]. The
literature suggests that there is no marker that is more
consistently elevated in human cancer, and that is also
associated with a poor prognosis than MT1/2 [13]. To
the authors’ knowledge there has been no study in other
breast cancer cell lines or tissues on the relationship
between MT and GAGE gene expression.
The final interesting finding in the present study was an
extension of the laboratory’s earlier study that showed
MT3 expression decreased that growth of MCF-7 cells
[53]. The stable transfection of the MCF-7 cells with the
MT1E gene modified to contain either the C- or Nterminal unique sequence of MT3 elicited a decrease in
cell growth similar to that noted for MCF-7 cells stably
transfected with MT3. Similarly, the stable transfection of
Page 11 of 13
MCF-7 cells with MT3 modified to have a deletion of either the C- or N-terminal sequence produced an identical
inhibition of cell growth to that of cells transfected with
wild type MT3. To the author’s knowledge this is the first
time the C-terminal sequence of MT3 has been associated
with the inhibition of cell growth. The previous study in
the neural system implicated only the N-terminal sequence in growth inhibition [11]. A consequence of this
finding is that both the C- and N-terminal sequences of
MT3 would have to be rendered inactive to remove the
ability of MT3 to inhibit cell growth. As detailed in the results, global expression patterns showed that the only gene
that correlated to the ability of MT3 to inhibit the growth
of MCF-7 cells was IPI6. This gene also known as G1P3
or IFI-6-16 is suggested to play a role in the regulation of
apoptosis [54]. Although information about the function
of the protein and its tissue distribution is limited, there is
one study which shows that overexpression of this gene
confers survival advantage to estrogen receptor positive
breast cancers and confers tamoxifen resistance [55]. In
addition, this study also suggests that the anti-apoptotic
activity of IFI6 has a more pronounced effect on adverse
outcomes in estrogen receptor positive breast cancers.
Although the role of IFI6 in slowing the growth of MT3
expressing breast cancers is not known, the fact that it is
overexpressed will provide a starting point to define the
mechanism underlying MT3’s ability to inhibit the growth
of MCF-7 cells.
Conclusions
In conclusion, our study shows that the C-terminal
domain of MT3 confers dome formation in the MCF-7
breast cancer cells, whereas both the N-and the Cterminal domain of the molecule can confer growth inhibition in MCF-7 cells. The presence of the C-terminal
domain of MT3 induced the expression of the GAGE
family of genes whereas the N-terminal domain inhibited the expression of the GAGE genes. The differential
effect of MT3 and MT1E on the expression of GAGE
genes suggests unique roles of these genes in the development and progression of breast cancer. The finding
that IFI6 expression is associated with the ability of
MT3 to inhibit growth needs to be investigated further
to determine the associated mechanism.
Additional files
Additional file 1: Differential Expression Profile of MCF-7 Cells
Transfected with MT1E or MT1E-CT. Table comparing gene expression
profiles of MCF-7 cells transfected with the MT1E gene with MCF-7 cells
transfected with MT1E-CT construct. (DOC 224 kb)
Additional file 2: Differential Expression Profile of MCF-7 Cells Transfected
with MT1E or MT1E-NT. Table comparing gene expression profiles of MCF-7
cells transfected with MT1E gene with MCF-7 cells transfected with MT1ENT construct. (DOC 35 kb)
Voels et al. BMC Cancer (2017) 17:369
Additional file 3: Differential Expression Profile of MCF-7 Cells Transfected
with MT3 or MT3ΔNT. Table comparing gene expression profiles of MCF-7
cells transfected with the MT3 gene with MCF-7 cells transfected with
MT3ΔNT construct. (DOC 28 kb)
Additional file 4: Differential Expression Profile of MCF-7 Cells Transfected
with MT3. Table comparing gene expression profiles of MCF-7 cells
transfected with MT3 gene with MCF-7 cells transfected with pcDNA 6.2/V5
blank vector. (DOC 126 kb)
Additional file 5: Differential Expression Profile of MCF-7 Cells Transfected
with MT3ΔCT. Table comparing gene expression profiles of MCF-7 cells
transfected with pcDNA 6.2/V5 blank vector with MCF-7 cells transfected
with MT3ΔCT construct. (DOC 698 kb)
Additional file 6: Differential Expression Profile of MCF-7 Cells Transfected
with MT3ΔNT. Table comparing gene expression profiles of MCF-7 cells
transfected with pcDNA 6.2/V5 blank vector with MCF-7 cells transfected
with MT3ΔNT construct. (DOC 28 kb)
Abbreviations
C/T antigen: Cancer/testis antigen; DEGs: Differentially expressed probe sets;
DNAJC12: DnaJ heat shock protein family (Hsp40) member C12; GAGE: G
antigens; IFI6: Interferon alpha-inducible protein 6; IGFBP5: Insulin like growth
factor binding protein 5; MT: Metallothionein; MT1E-CT: MT1E containing the
C-terminal region of MT3; MT1E-NT: MT1E mutated to contain the N-terminal
region of MT3; MT1E-NT-CT: MT1E mutated to contain the C- and N-terminal
of MT3; MT3ΔCT: MT3 with a C-terminal deletion; MT3ΔNT: MT3 with an
N-terminal mutation; MTT: 3-(4,5-dimethylthiazol-2-yl)-2,5-diphenyltetrazolium
bromide; OHC: Overlap hierarchical clustering; PGM5: Phosphoglucomutaselike protein 5; PROS1: Protein S (alpha); SAM: Significance analysis of
microarrays; Thr: Threonine, TER: transepithelial resistance
Acknowledgements
Not applicable.
Funding
The Department of Pathology at the University of North Dakota provided
funds for the supplies utilized in the study. The bioinformatics core facility
utilized in this study is supported by funds provided by the North Dakota
INBRE IDeA program P20 GM103442 from the National Institute of General
Medical Sciences, NIH. The funding sources were not involved in the design
of the study, collection, analysis, and interpretation of data, or in the writing
the manuscript.
Availability of data and materials
The microarray data is available at Gene Expression Omnibus GSE98344. All
data generated or analyzed during this study are included in this published
article and its supplementary information files.
Authors’ contributions
BV and LW aided in the experimental design, performed all the experiments,
assisted in data analysis and writing of the manuscript. SHG was involved in
the designing of the experiments, analysis of the data and writing of the
manuscript. KZ assisted in the experimental design, bioinformatics and
statistical analysis and writing of the manuscript. DAS assisted in the
experimental design, data analysis and writing of the manuscript. SS aided in
experimental design, data analysis and writing of the manuscript. All authors
read and approved the final manuscript.
Competing interests
The authors declare that they have no competing interests.
Consent for publication
Not applicable.
Ethics approval and consent to participate
Not applicable.
Publisher’s Note
Springer Nature remains neutral with regard to jurisdictional claims in
published maps and institutional affiliations.
Page 12 of 13
Author details
1
Department of Pathology, University of North Dakota, School of Medicine
and Health Sciences, 1301 N. Columbia Road, Stop 9037, Grand Forks, ND
58202, USA. 2Departments of Science, Cankdeska Cikana Community College,
214 1st Avenue, Fort Totten, ND 58335, USA. 3Present address: Department
of Medical Ultrasound, Tongji Hospital, Tongji Medical College, Huangzhong
University of Science and Techology, Wuhan 430030, People’s Republic of
China.
Received: 25 October 2016 Accepted: 15 May 2017
References
1. Hamer DH. Metallothionein. Annu Rev Biochem. 1986;55:913–51.
2. Klaassen CD, Liu J, Choudhuri S. Metallothionein: an intracellular protein to
protect against cadmium toxicity. Annu Rev Pharmacol Toxicol.
1999;39:267–94.
3. Andrews GK. Regulation of metallothionein gene expression by oxidative
stress and metal ions. Biochem Pharmacol. 2000;59(1):95–104.
4. Searle PF, Davison BL, Stuart GW, Wilkie TM, Norstedt G, Palmiter RD.
Regulation, linkage, and sequence of mouse metallothionein I and II genes.
Mol Cell Biol. 1984;4(7):1221–30.
5. Kagi JH, Kojima Y. Chemistry and biochemistry of metallothionein.
Experimentia Suppl. 1987;52:25–61.
6. Quaife CJ, Findley SD, Erickson JC, Froelick GJ, Kelly EJ, Zambrowicz BP, et al.
Induction of a new metallothionein isoform (MT-IV) occurs during
differentiation of stratified squamous epithelia. Biochemistry.
1994;33(24):7250–9.
7. Palmiter RD, Findley SD, Whitmore TE, Durnam DM. MT-III, a brain-specific
member of the metallothionein gene family. Proc Natl Acad Sci U S A.
1992;89(14):6333–7.
8. Sadhu C, Gedamu L. Regulation of human metallothionein (MT) genes.
Differential expression of MTI-F, MTI-G, and MTII-A genes in the
hepatoblastoma cell line (HEPG2). J Biol Chem. 1988;263(6):2679–84.
9. West AK, Stallings R, Hildebrand CE, Chiu R, Karin M, Richards R. Human
metallothionein genes: structure of the functional locus at 16q13.
Genomics. 1990;8(3):513–8.
10. Stennard FA, Holloway AF, Hamilton J, West AK. Characterization of six
additional human metallothionein genes. Biochim Biophys Acta.
1994;1218(3):357–65.
11. Sewell AK, Jensen LT, Erickson JC, Palmiter RD, Winge DR. The bioactivity of
metallothionein-3 correlates with its novel β domain sequence rather than
metal binding properties. Biochemistry. 1995;34(14):4740–7.
12. Jasani B, Schmid KW. Significance of metallothionein overexpression in
human tumours. Histopathology. 1997;31(3):211–4.
13. Theocharis SE, Margeli AP, Klijanlenko JT, Kouraklis GP. Metallothionein
expression in human neoplasia. Histopathol. 2004;45(2):103–18.
14. Tsuji S, Kobayashi H, Uchida Y, Ihara Y, Miyatake T. Molecular cloning of
human growth inhibitory factor cDNA and its down-regulation in
Alzheimer’s disease. EMBO J. 1992;11(13):4843–50.
15. Uchida Y, Takio K, Titani K, Ihara Y, Tomonaga M. The growth inhibitory
factor that is deficient in Alzheimer’s disease is a 68 amino acid
metallothionein-like protein. Neuron. 1991;7(2):337–47.
16. Garrett SH, Sens MA, Todd JH, Somji S, Sens DA. Expression of MT3 protein
in the human kidney. Toxicol Lett. 1999;105(3):207–14.
17. Amoureux MC, Wurch T, Pauwels PJ. Modulation of metallothionein-III mRNA
content and growth rate of rat C6-glial cells by transfection with human
5-HT1D receptor genes. Biochem Biophys Res Comm. 1995;214(2):639–45.
18. Sens MA, Somji S, Garrett SH, Sens DA. Metallothionein isoform 3 (MT3)
overexpression is associated with breast cancers having a poor prognosis.
Am J Pathol. 2001;159(1):21–6.
19. Somji S, Garrett SH, Zhou XD, Zheng Y, Sens DA, Sens MA. Absence of
metallothionein 3 expression in breast cancer is a rare, but favorable marker
of outcome that is under epigenetic control. Toxicol Environ Chem.
2010;92(9):1673–95.
20. Dziegiel P, Pula B, Kobierzycki C, Stasiolek M, Podhorska-Okolow M.
Metallothioneins in normal and cancer cells. Adv Anat Embryol Cell Biol.
2016;218:1–117.
21. Gomulkiewicz A, Jablonska K, Pula B, Grzegrzolka J, Borska S, PodhorskaOkolow M, et al. Expression of metallothionein 3 in ductal breast cancer.
Int J Oncol. 2016;49(6):2487–97.
Voels et al. BMC Cancer (2017) 17:369
22. Kmiecik AM, Pula B, Suchanski J, Olbromski M, Gomulkiewicz A, Owczarek T,
et al. Metallothionein-3 increases triple negative breast cancer cell
invasiveness via induction of metalloproteinase expression. PLoS One.
2015;10(5):e0124865.
23. Tao YF, Xu LX, Lu J, Cao L, Li ZH, Hu SY, et al. Metallothionein III (MT3) is a
putative tumor suppressor gene that is frequently inactivated in pediatric
acute myeloid leukemia by promoter hypermethylation. J Transl Med.
2014;12:182.
24. Denizot F, Lang R. Rapid colorimetric assay for cell growth and survival.
Modifications to the tetrazolium dye procedure giving improved sensitivity
and reliability. J Immunol Methods. 1986;89(2):271–7.
25. Slusser A, Bathula CS, Sens DA, Somji S, Sens MA, Zhou XD, et al. Cadherin
expression, vectorial active transport, and metallothionein isoform 3
mediated EMT/MET responses in cultured primary and immortalized human
proximal tubule cells. PLoS One. 2015;10(3):e0120132.
26. Sandquist EJ, Somji S, Dunlevy JR, Garrett SH, Zhou X, Slusser-Nore A, et al.
Loss of N-cadherin expression in tumor transplants produced from as+3and cd+2-transformed human urothelial (UROtsa) cell lines. PLoS One.
2016;11(5):e0156310.
27. Bathula CS, Garrett SH, Zhou XD, Sens MA, Sens DA, Somji S. Cadmium,
vectorial active transport, and MT3-dependent regulation of cadherin
expression in human proximal tubule cells. Toxicol Sci. 2008;102(2):310–8.
28. Tusher VG, Tibshirani R, Chu G. Significance analysis of microarrays applied
to the ionizing radiation response. Proc Natl Sci U S A. 2001;98(9):5116–21.
29. Lever JE. Inducers of dome formation in epithelial cell cultures including
agents that cause differentiation. In: Taub M, editor. Tissue culture of
epithelial cells. New York: Plenum Press; 1985. p. 3–22.
30. Blackburn JG, Hazen-Martin DJ, Detrisac DJ, Sens DA. Electrophysiology and
ultrastructure of cultured human proximal tubule cells. Kidney Int.
1988;33(2):508–16.
31. Sens DA, Detrisac CJ, Sens MA, Rossi MR, Wenger SL, Todd JH. Tissue culture
of human renal epithelial cells using a defined serum-free growth
formulation. Exper Nephrol. 1999;7(5–6):344–52.
32. Friedline JA, Garrett SH, Somji S, Todd JH, Sens DA. Differential expression of
the MT-1E gene in estrogen-receptor-positive and -negative human breast
cancer cell lines. Am J Pathol. 1998;152(1):23–7.
33. Gjerstorff MF, Ditzel HJ. An overview of the GAGE cancer/testis antigen
family with the inclusion of newly identified members. Tissue Antigens.
2008;71(3):187–92.
34. Killen MW, Taylor TL, Stults DM, Jin W, Wang LL, Moscow JA, et al.
Configuration and rearrangement of the human GAGE gene clusters.
Am J Transl Res. 2011;3(3):234–42.
35. Cilensek ZM, Yehiely F, Kular RK, Deiss LP. A member of the GAGE family of
tumor antigens is an anti-apoptotic gene that confers resistance to fas/
CD95/APO-1, interferon-gamma, taxol and gamma-irradiation. Cancer Biol
Ther. 2002;1(4):380–7.
36. Simpson AJ, Caballero OL, Jungbluth A, Chen YT, Old LJ. Cancer/testis
antigens, gametogenesis and cancer. Nat Rev Cancer. 2005;5(8):615–25.
37. Gjerstorff MF, Johansen LE, Nielsen O, Kock K, Ditzel HJ. Restriction of GAGE
protein expression to subpopulations of cancer cells is independent of
genotype and may limit the use of GAGE proteins as targets for cancer
immunotherapy. Br J Cancer. 2006;94(12):1864–73.
38. Gjerstorff MF, Kock K, Nielsen O, Ditzel HJ. MAGE-A1, GAGE and NY-ESO-1
cancer/testis antigen expression during human gonadal development.
Hum Reprod. 2007;22(4):953–60.
39. Cheung IY, Chi SN, Cheung NK. Prognostic significance of GAGE detection
in bone marrows on survival of patients with metastatic neuroblastoma.
Med Pediatr Oncol. 2000;35(6):632–4.
40. Kong U, Koo J, Choi K, Park J, Chang H. The expression of GAGE gene can
predict aggressive biologic behavior of intestinal type of stomach cancer.
Hepato-Gastroenterology. 2004;51(59):1519–23.
41. Zambon A, Mandruzzato S, Parenti A, Macino B, Dalerba P, Ruol A, et al.
MAGE, BAGE, and GAGE gene expression in patients with esophageal
squamous cell carcinoma and adenocarcinoma of the gastric cardia. Cancer.
2001;91(10):1882–8.
42. Whitehurst AW. Cause and consequence of cancer/testis antigen activation
in cancer. Ann Rev Pharmacol Toxicol. 2014;54:251–72.
43. Balafoutas D, Hausen A, Mayer S, Hirschfeld M, Jaeger M, Denschlag D, et al.
Cancer testis antigens and NY-BR-1 expression in primary breast cancer:
prognostic and therapeutic implications. BMC Cancer. 2013;13:271.
Page 13 of 13
44. Jin R, Bay BH, Chow VTK, Tan PH, Lin VC. Metallothionein 1E mRNA is highly
expressed in oestrogen receptor-negative human invasive ductal breast
cancer. Br J Cancer. 2000;83(3):319–23.
45. Schmid KW, Ellis IO, Gee JMW, Darke BM, Lees WE, Kay J, et al. Presence and
possible significance of immunocytochemically demonstratable
metallothionein over-expression in primary invasive ductal carcinoma of the
breast. Virchows Arch A Pathol Anat Histopathol. 1993;422(2):153–9.
46. Fresno M, Wu W, Rodriguez JM, Nadji M. Localization of metallothionein in
breast carcinomas. An immunohistochemical study. Virchows Arch A Pathol
Anat Histopathol. 1993;423(3):215–9.
47. Bier B, Douglas-Jones A, Totsch M, Dockhorn-Dworniczak B, Bocker W,
Janani B, et al. Immunohistochemical demonstration of metallothionein in
normal human breast tissue and benign and malignant lesions. Breast
Cancer Res Treat. 1994;30(3):213–21.
48. Haerslev T, Jacobsen K, Nedergaard L, Zedeler K. Immunohistochemical
detection of metallothionein in primary breast carcinomas and their axillary
lymph node metastases. Path Res Pract. 1994;190(7):675–81.
49. Douglas-Jones AG, Schmid KW, Bier B, Horgan K, Lyons K, Dallimore ND,
et al. Metallothionein expression in duct carcinoma in situ of the breast.
Human Pathol. 1995;26(2):217–22.
50. Goulding H, Jasani B, Pereira H, Reid A, Galea M, Bell JA, et al.
Metallothionein expression in human breast cancer. Br J Cancer.
1995;72(4):968–72.
51. Oyama T, Takei H, Hikino T, Iino Y, Nakajima T. Immunohistochemical
expression of metallothionein in invasive breast cancer in relation to
proliferative activity, histology and prognosis. Oncology. 1996;53(2):112–7.
52. Surowiak P, Malkowski R, Materna V, Gyorffy B, Wojnar A, Pudelko M, et al.
Elevated metallothionein (MT) expression in invasive ductal breast cancer
predicts tamoxifen resistance. Histol Histopathol. 2006;20(4):1037–44.
53. Gurel V, Sens DA, Somji S, Garrett SH, Nath J, Sens MA. Stable transfection
and overexpression of metallothionein isoform 3 inhibits the growth of
MCF-7 and Hs578T cells but not that of T-47D or MDA-MB-231 cells. Breast
Cancer Res Treat. 2003;80(2):181–91.
54. Tahara E Jr, Tahara H, Kanno M, Naka K, Takeda Y, Matsuzaki T, et al. G1P3,
an interferon inducible gene 6-16, is expressed in gastric cancers and
inhibits mitochondrial-mediated apoptosis in gastric cancer cell line TMK-1
cell. Cancer Immunol Immunother. 2005;54(8):729–40.
55. Cheriyath V, Kuhns MA, Jacobs BS, Evangelista P, Elson P, Downs-Kelly E,
et al. G1P3, an interferon- and estrogen-induced survival protein contributes
to hyperplasia, tamoxifen resistance and poor outcomes in breast cancer.
Oncogene. 2012;31(17):2222–36.
Submit your next manuscript to BioMed Central
and we will help you at every step:
• We accept pre-submission inquiries
• Our selector tool helps you to find the most relevant journal
• We provide round the clock customer support
• Convenient online submission
• Thorough peer review
• Inclusion in PubMed and all major indexing services
• Maximum visibility for your research
Submit your manuscript at
www.biomedcentral.com/submit