Glyoxalase 1 expression is associated with an unfavorable prognosis of oropharyngeal squamous cell carcinoma
Bạn đang xem bản rút gọn của tài liệu. Xem và tải ngay bản đầy đủ của tài liệu tại đây (1.31 MB, 9 trang )
Kreycy et al. BMC Cancer (2017) 17:382
DOI 10.1186/s12885-017-3367-5
RESEARCH ARTICLE
Open Access
Glyoxalase 1 expression is associated with
an unfavorable prognosis of oropharyngeal
squamous cell carcinoma
Nele Kreycy1†, Christiane Gotzian1†, Thomas Fleming2, Christa Flechtenmacher3, Niels Grabe4, Peter Plinkert1,
Jochen Hess5 and Karim Zaoui1*
Abstract
Background: Glyoxalase 1 is a key enzyme in the detoxification of reactive metabolites such as methylglyoxal and
induced Glyoxalase 1 expression has been demonstrated for several human malignancies. However, the regulation
and clinical relevance of Glyoxalase 1 in the context of head and neck squamous cell carcinoma has not been
addressed so far.
Methods: Argpyrimidine modification as a surrogate for methylglyoxal accumulation and Glyoxalase 1 expression in
tumor cells was assessed by immunohistochemical staining of tissue microarrays with specimens from oropharyngeal
squamous cell carcinoma patients (n = 154). Prognostic values of distinct Glyoxalase 1 staining patterns were
demonstrated by Kaplan-Meier, univariate and multivariate Cox proportional hazard model analysis. The impact of
exogenous methylglyoxal or a Glyoxalase 1 inhibitor on the viability of two established tumor cell lines was monitored
by a colony-forming assay in vitro.
Results: Glyoxalase 1 expression in tumor cells of oropharyngeal squamous cell carcinoma patients was positively
correlated with the presence of Argpyrimidine modification and administration of exogenous methylglyoxal induced
Glyoxalase 1 protein levels in FaDu and Cal27 cells in vitro. Cal27 cells with lower basal and methylglyoxal-induced
Glyoxalase 1 expression were more sensitive to the cytotoxic effect at high methylgyoxal concentrations and both cell
lines showed a decrease in colony formation with increasing amounts of a Glyoxalase 1 inhibitor. A high and nuclear
Glyoxalase 1 staining was significantly correlated with shorter progression-free and disease-specific survival, and served
as an independent risk factor for an unfavorable prognosis of oropharyngeal squamous cell carcinoma patients.
Conclusions: Induced Glyoxalase 1 expression is a common feature in the pathogenesis of oropharyngeal squamous
cell carcinoma and most likely represents an adaptive response to the accumulation of cytotoxic metabolites.
Oropharyngeal squamous cell carcinoma patients with a high and nuclear Glyoxalase 1 staining pattern have a high
risk for treatment failure, but might benefit from pharmacological targeting Glyoxalase 1 activity.
Keywords: Argpyrimidine, Colony-forming assay, Disease-specific survival, Glyoxalase 1, Head and neck cancer,
Methylglyoxal, Oropharyngeal squamous cell carcinoma, Reactive metabolites, Tissue microarray
* Correspondence:
†
Equal contributors
1
Department of Otolaryngology, Head and Neck Surgery, University Hospital
Heidelberg, Im Neuenheimer Feld 400, D-69120 Heidelberg, Germany
Full list of author information is available at the end of the article
© The Author(s). 2017 Open Access This article is distributed under the terms of the Creative Commons Attribution 4.0
International License ( which permits unrestricted use, distribution, and
reproduction in any medium, provided you give appropriate credit to the original author(s) and the source, provide a link to
the Creative Commons license, and indicate if changes were made. The Creative Commons Public Domain Dedication waiver
( applies to the data made available in this article, unless otherwise stated.
Kreycy et al. BMC Cancer (2017) 17:382
Background
The Warburg effect describes a condition in which cells
with high proliferative activity rely on glycolysis as a
major source of energy rather than oxidative phosphorylation [1]. High glycolytic activity is a characteristic feature of tumor cells in pre-malignant lesions as an
adaptation to intermitted hypoxia and is particularly
marked in invasive tumors [2]. As a consequence of accelerated glycolysis cancer cells accumulate endogenous
dicarbonyl compounds such as methylglyoxal (MG), a
highly reactive and potent glycating agent [3]. Insufficient metabolism of MG causes stable modifications of
proteins, e.g. modification at arginine residues known as
argpyrimidine (AP), nucleotides and lipids, leading to accelerated levels of advanced glycation end products
(AGEs). These modifications cause serious damage to the
functional integrity of the genome and the proteome [4].
The carbonyl stress related to MG has been primarily described in the pathology of diabetes, where accumulation
of AGEs is a common event in the manifestation and
maintenance of late complications [5, 6]. MG is a potent
cytotoxic compound and its accumulation exerts antitumor activity suggesting its potential use as therapeutic
agent in distinct cancers [7]. However, several studies also
reported a putative pro-tumorigenic effect of MG mainly
due to post-translational modification of cancer-related
proteins, indicating an impact of the global cellular
context.
In mammalian cells, MG is detoxified by the glyoxalase system, an ubiquitous cellular defense mechanism
comprising glyoxalase 1 (GLO1), glyoxalase 2 (GLO2/
HAGH) and a catalytic amount of reduced glutathione
[3]. The glyoxalase system has been considered to maintain tumor cell activity and viability by preventing cellular suicide due to MG accumulation. Indeed, GLO1 gene
amplification and elevated expression is a common feature in the progression of multiple human malignancies,
including gastric cancer [8], colorectal cancer [9], breast
cancer [10], liver cancer [11, 12], skin tumors [13, 14],
and prostate cancer [15]. In some tumor entities GLO1
expression was associated with advanced tumor stages
or drug resistance [3, 8, 10, 16]. The increase in GLO1
expression and activity most likely resembles a strategy
adopted by aggressive cancer cells as a defense mechanism against glycation damage induced by high intracellular MG levels as a consequence of elevated glycolytic
activity or under therapeutic conditions [3]. Thus, GLO1
plays a vital role in tumor initiation, malignant progression as well as treatment failure, and could serve as
promising target for anti-cancer therapy.
So far, neither the expression of GLO1 nor its impact
on malignant progression or prognosis have been addressed for head and neck squamous cell carcinoma
(HNSCC). HNSCC is one of the most common human
Page 2 of 9
malignancies with an annual incidence of 600,000 new
cases worldwide [17]. Traditional risk factors are tobacco
and alcohol abuse and more recently, infection by highrisk types of human papilloma virus (HPV), especially
HPV16, has been related to an escalating incidence of oropharyngeal squamous cell carcinoma (OPSCC) [18, 19].
Despite aggressive and multimodal therapy mainly consisting of surgery, radiotherapy and platinum-based
chemotherapy, the survival of patients with advanced
HNSCC has only marginally improved during the past decades. Consequently, appropriate treatment of HNSCC
patients is still a major challenge and there is an urgent
demand for new concepts of more effective and less toxic
therapy.
Methods
Patient samples and tissue microarray
Tumor specimens for this retrospective study were obtained from patients with primary OPSCC, who have
given informed consent to participate and were treated
at the University Hospital Heidelberg between 1990 and
2008. Formaldehyde fixed and paraffin embedded tissue
specimens were provided by the tissue bank of the National Center for Tumor Disease (Institute of Pathology,
University Hospital Heidelberg) after approval by the
local institutional review board (ethic vote: 176/2002
and 206/2005). The study was performed according to
the ethical standards of the Declaration of Helsinki. For
all tumor samples, clinical and follow-up data were available from the Department of Otolaryngology, Head and
Neck Surgery at the University Hospital Heidelberg and
are listed in Additional file 1: Table S1. HPV16 DNA
and viral transcript status was determined previously
[20] and generation of tissue microarrays has been described elsewhere [21].
Immunohistochemical staining and scoring system
Tissue microarrays were assembled with independent
cores from distinct areas of a formalin-fixed and paraffin
embedded pre-treatment tumor tissue and for most tumors at least two independent probes were available.
Tissue microarrays were incubated with anti-AP or antiGLO1 antibodies that are listed in Additional file 2: Table
S2. Immunostaining was visualized with the TSA Amplification Kit (Perkin Elmer, Rodgau, Germany) and DAB peroxidase substrate (Vector Laboratories, Burlingame, USA)
according to the manufacturers instructions. Counterstaining was done by hematoxylin to visualize tissue integrity.
Stained tissue microarrays were scanned using the Nanozoomer HT Scan System (Hamamatsu Photonics, Japan).
Protein expression was evaluated by three independent observers using the NDP Viewer software (version 1.1.27). For
AP the staining intensity (score 1 = no, score 2 = low, score
3 = moderate, score 4 = high) was evaluated. For GLO1 the
Kreycy et al. BMC Cancer (2017) 17:382
relative amount of positive tumor cells (score 1 = no
positive cell, score 2 ≤ 33%, 33% > score 3 ≤ 66%, score
4 > 66%) and the staining intensity (score 1 = no, score
2 = low, score 3 = moderate, score 4 = high) was evaluated (Additional file 3: Table S3). Both scores were significantly correlated (Pearson correlation coefficient
0.696, p < 0.005 and Spearman correlation coefficient
0.586, p < 0.005) and multiplied to calculate the final
immunoreactivity score (IRS, range 1–16). The cut-off
value for further analysis was: GLO1high > 8 and GLO1low
≤ 8. The intracellular staining of GLO1 was evaluated as predominant nuclear (GLO1nuc) versus
cytoplasmic (GLO1cyt) (Additional file 4: Table S4).
Cell culture experiments
Human cell lines (FaDu and Cal27) were purchased
from ATCC (; catalog
numbers: HTB-43™ and CRL-2095™) and were maintained in (Sigma, Germany)
supplemented with 10% fetal bovine serum (Invitrogen,
Germany), 2 mM L-Glutamine (Invitrogen, Germany) and
50 μg/ml Penicillin-Streptomycin (Invitrogen, Germany)
in a humidified atmosphere of 6% CO2 at 37 °C. Authentication of both cell lines was confirmed by the Multiplex
Human Cell Line Authentication Test (Multiplexion,
Germany). For Western blot analysis 1 × 10⁶ FaDu or
Cal27 cells were seeded on 96 mm TC plates and cultured
over night. Cells were treated with indicated concentrations of MG and 24 h following administration cells were
harvested for protein lysates. MG was synthesized by acid
hydrolysis as described [22], and the concentration of the
stock solution was determined by derivatization with
aminoguanidine [23]. The cell permeable GLO1 inhibitor, S-p-bromobenzylglutathione cyclopentyl diester
(BrBzGSHCp2) was prepared and characterized as described [24, 25]. For colony formation assays 100 and
300 FaDu cells or 300 and 1000 Cal27 cells were seeded
per 6-well plate, respectively. Cells were treated with
the indicated concentration of MG or the GLO1 inhibitor every second day. 10 days upon seeding cells were
PFA-fixed and the amount of colonies was determined
after crystal violet staining as described in [26]. The
survival fraction was computed according to [27].
Protein isolation and Western blot analysis
Whole cell protein lysate was extracted using RIPA
(Radioimmunoprecipitation assay) buffer [28] and protease and phosphatase inhibitor cocktails (Sigma-Aldrich).
20 μg of denatured protein were separated by
Sodiumdodecylsulfate-polyacrylamide gel electrophoresis
(SDS-PAGE) and transferred to polyvinyl difluoride
(PVDF) membranes (Millipore, Germany). After blocking
with 5% milk (Roth, Germany), membranes were incubated with primary and horseradish peroxidase coupled-
Page 3 of 9
secondary antibodies, which are listed in Supplementary
Table S2. Membranes were incubated in enhanced chemiluminiscence solution (Thermo Scientific, Germany) and
developed with an E.O.S. developer (Agfa, Germany).
Quantification of MG levels by HPLC
The concentrations of MG in supernatant of cultured cells
were determined by derivatization with 1,2-diamino-4,5dimethoxybenzene and HPLC of the quinoxaline adduct
by fluorescence detection as described elsewhere [22, 29].
Statistical analysis
Statistical analysis was conducted with the IBM SPSS Statistics software (version 21). Differences between subgroups were assessed using Chi square or Fisher’s exact
tests. The method of Kaplan–Meier was used to estimate
survival distributions and differences between groups were
determined by log-rank tests. Univariate and multivariate
Cox proportional hazard model was used to assess the association between patient subgroups and progression-free
or disease-specific survival. In all statistical tests, a p-value
of 0.05 or below was considered as statistically significant.
Results
Detection of AP modification and correlation with GLO1
expression in primary oropharyngeal squamous cell
carcinoma
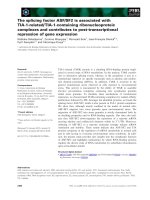
Tissue microarrays were analyzed by immunohistochemistry with an anti-AP antibody as a surrogate marker for
MG accumulation in tumor cells of primary OPSCC. In
parallel, GLO1 protein levels were analyzed by immunohistochemistry on serial sections of tissue microarrays.
Data on AP and GLO1 immunoreactivity were available
for tumor specimens of 134 patients, and revealed no
AP staining in 3.7% (n = 5), low staining pattern in
20.9% (n = 28), moderate staining pattern in 31.4%
(n = 42), and a high staining pattern in 44% (n = 59)
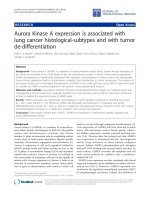
(Fig. 1A, C, E and G). A heterogeneous staining pattern
was also evident for GLO1 considering the staining intensity as well as the relative amount of positive tumor
cells (Fig. 1B, D, F and H). It is worth noting that in
addition to the expected positive staining in the cytoplasm of tumor cells (Fig. 1F), we also detected a prominent nuclear GLO1 staining in a substantial amount of
OPSCC samples (Fig. 1H). Comparison of the relative
GLO1 immunoreactivity score in subgroups of OPSCC
patients with no, low, moderate or high AP staining
demonstrated a significant positive correlation (Fig. 1I).
Impact of MG on GLO1 expression and viability of tumor
cell lines
The data presented so far suggested that induced GLO1
expression is a compensatory mechanism of OPSCC
tumor cells to counteract and survive the accumulation
Kreycy et al. BMC Cancer (2017) 17:382
Page 4 of 9
Fig. 1 Detection of AP modifications and GLO1 protein expression in tumor cells of OPSCC. Representative pictures of an immunohistochemical
staining with an anti-AP antibody (brown staining) demonstrate tumor sections with low (a), moderate (c) or high staining (e and g). Serial sections were analyzed with an anti-GLO1 antibody and revealed a heterogeneous staining pattern (brown signal) with low (b), moderate (d) and
high immunoreactivity scores (f and h), considering staining intensity and relative amount of positive tumor cells. GLO1 staining was detected either in the cytoplasm (f) or the nucleus (h) of tumor cells. i Boxplot displays the median and 25% to 75% percentile of the GLO1 immunoreactivity score in subgroups of OPSCC patients (n = 134) with no, low, moderate or high AP staining. *p ≤ 0.05, **p ≤ 0.005 and ***p ≤ 0.0005.
Counterstaining was done with hematoxylin to visualize tissue architecture; white bar indicates 200 μm
of MG. To further support this assumption FaDu and
Cal27, two well-established head and neck cancer cell
lines, were cultured in the presence of increasing
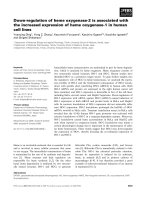
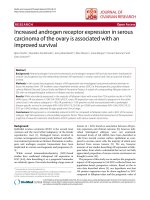
amounts of MG. In both cell lines, administration of exogenous MG increased GLO1 protein levels as determined by Western blot analysis (Fig. 2A). It is worth
noting that GLO1 levels were lower in Cal27 as compared to FaDu cells under control conditions as well as
the presence of exogenous MG.
Next, the cytotoxic profile of MG treatment on tumor
cell viability was analyzed by a colony-forming assay. No
major difference between both cell lines was found at
lower MG concentrations (≤ 40 μM, Additional file 5: Fig.
S1). However, at higher MG concentrations FaDu cells
displayed an improved survival as compared to Cal27
cells, which was statistical significant at a MG concentration of 160 μM (p ≤ 0.049, Fig. 2B). These data
indicated a better tolerance of tumor cells with higher
basal or inducible GLO1 expression under conditions
of MG accumulation.
Impact of GLO1 inhibition on tumor cell survival
To assess the consequence of GLO1 inhibition on tumor
cell survival we cultured both cell lines in the presence
of the cell permeable inhibitor S-p-bromobenzylglutathione cyclopentyl diester [3]. Quantification of MG
levels in cell culture supernatant after treatment with
the GLO1 inhibitor revealed a concentration dependent
increase in FaDu but not Cal27 cells (Additional 6: Fig.
S2). However, both cell lines showed a comparable decrease in the survival fraction with increasing amount of
the GLO1 inhibitor (Fig. 2C-D). These data strongly suggested that the cytotoxic effect of GLO1 inhibition does
not exclusively rely on an accumulation of MG levels.
Prognostic value of the GLO1 staining pattern
To evaluate the clinical relevance of GLO1 staining patterns in the cohort of OPSCC patients, subgroups with a
low (GLO1low, n = 67) or a high immunoreactivity score
(GLO1high, n = 89) were identified. Furthermore, we
considered a cytoplasmic (GLO1cyt, n = 94) or a
Kreycy et al. BMC Cancer (2017) 17:382
Page 5 of 9
Fig. 2 Impact of MG and a GLO1 inhibitor on colony formation of tumor cells. Western blot analysis with whole cell lysate demonstrates higher
basal GLO1 expression in control treated (co) FaDu as compared to Cal27 cells and MG-induced up-regulation of GLO1 protein levels in both cell
lines (a). Detection of β-Actin served as control for quantity and quality of protein lysates. b The cytotoxic effect of MG on FaDu (black line) and Cal27
cells (dashed line) was assessed by a colony-forming assay and the graph indicates the mean value ±SD of the survival fraction at the indicated MG
concentration of three independent experiments. The impact of GLO1 inhibition (1 and 5 μM S-p-bromobenzylglutathione cyclopentyl diester) on the
viability of FaDu and Cal27 cells was assessed by a colony-forming assay (b) and the graph in (c) displays the mean value ±SD of the survival fraction
at the indicated concentration of the GLO1 inhibitor from three independent experiments
predominant nuclear staining (GLO1nuc, n = 43) in the
subgroup of OPSCC patients with a positive GLO1
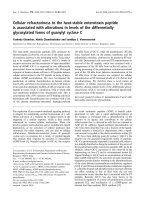
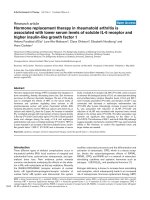
staining. A GLO1high staining was significantly correlated with shorter progression-free (PFS) and diseasespecific survival (DSS), while nuclear GLO1 staining revealed a trend towards shorter PFS and was significantly
correlated with shorter DSS (Fig. 3A-D). These findings
strongly indicated that a nuclear GLO1 accumulation
in tumor cells with a high expression serves as a risk
factor for unfavorable prognosis of OPSCC patients.
This assumption was further assessed by a combinatorial subgroup analysis taking into account both features (GLO1high/nuc) in comparison to all other
staining patterns (GLO1others), and confirmed a highly
significant shorter PFS and DSS (Fig. 3E-F). Moreover,
a high and nuclear GLO1 staining was significantly
associated with a larger tumor size (Table 1), but not
with any other patient characteristic tested (e.g. gender, age, TNM status, pathological grading, clinical
staging, alcohol and tobacco consumption or HPV
status). Next, multivariate Cox proportional hazard
model analysis confirmed that a GLO1high/nuc staining
pattern served as independent risk factors for unfavorable PFS and DSS (Table 2), taking into consideration relevant prognostic risk factors based on
univariate analysis (Additional 7: Table S5).
Finally we addressed the question, whether the prognostic value of GLO1 staining patterns correlates with the
mode of treatment and conducted subgroup analysis by
univariate Cox regression analysis. While the prognostic
value of nuclear GLO1 staining was largely independent
of treatment with (n = 109) or without surgery (n = 46), a
high GLO1 immunoreactivity score was significantly
correlated with an unfavorable PFS after surgery (with or
without adjuvant radio- or radiochemotherapy, Additional
file 8: Fig. S3A). A similar trend was also found for DSS
(Additional file 9: Fig. S3B). In contrast, a high GLO1 immunoreactivity score was significantly correlated with a
poor clinical outcome in the absence of chemotherapy
(n = 108), which was not observed for patients with
chemotherapy (n = 47, Additional file 10: Fig. S4). All
GLO1 staining patterns (high or nuclear GLO1 staining
and their combination) were correlated with unfavorable
PFS and DSS after radiotherapy (n = 131, adjuvant and definitive), but not for surgery only (n = 24, Additional Fig.
S5). However, it is worth noting that the amount of cases
without radiotherapy was limited in this retrospective
cohort.
Discussion
GLO1 is a central part of a ubiquitous detoxification system in the glycolytic pathway of normal and tumor cells,
Kreycy et al. BMC Cancer (2017) 17:382
Page 6 of 9
Fig. 3 High expression and nuclear localization of GLO1 correlates with unfavorable survival. The prognostic value of high versus low GLO1 expression
(a-b) and its predominant cytoplasmic versus nuclear localization (c-d) was assessed for progression-free (PFS, left panel) and disease-specific survival
(DSS, right panel) in a Kaplan-Meier plot. The worst outcome was observed for OPSCC patients with a combined high and nuclear GLO1 staining as
compared to all other staining patterns (e-f). P values were calculated by a log-rank test
and enables cell proliferation and survival under dicarbonyl stress [4]. Accordingly, GLO1 overexpression was
found in several human malignancies [3, 7], and is also a
common feature in tumor tissue of primary OPSCC as
demonstrated by immunohistochemistry in this study.
High GLO1 expression was significantly correlated with
the presence of AP modifications and administration of
exogenous MG induced GLO1 protein levels in two
HNSCC cell lines. Induced GLO1 expression as an adaptive response to elevated MG levels was reported previously for triple negative breast cancer cell lines [30]. These
data support a compensatory induction of GLO1 expression as a common mechanism of tumor cells to counteract the cytotoxic effect of an MG accumulation, which
appears to be a critical step in the pathogenesis and malignant progression of OPSCC. Accordingly, Cal27 with
lower basal and MG-induced GLO1 expression were more
sensitive in a colony-forming assay to the cytotoxic effect
at high MG concentrations, which is consistent with the
sensitization to exogenous MG of metastatic melanoma
and prostate cancer cell lines after silencing of GLO1 expression [14, 31].
Kreycy et al. BMC Cancer (2017) 17:382
Page 7 of 9
Table 1 Correlation between GLO1high/nuc staining and patient characteristics
GLO1high/nuc
Features
Age [years]
Gender
T status
N status
M status
Pathological grading
Clinical staging
Alcohol
Tobacco
HPV
GLO1others
Category
N
%
N
%
p value3
< 58.25
18
64.3
63
49.2
0.148
≥ 58.25
10
35.7
65
50.8
Male
20
71.4
96
75.0
Female
8
28.6
32
25.0
T1-T2
6
21.4
64
50.4
T3-T4
22
78.6
63
49.6
N0
6
21.4
25
19.7
N+
22
78.6
102
80.3
M0
25
92.6
120
96.0
M+
2
7.4
5
4.0
G1–2
14
66.7
62
56.4
G3
7
33.3
48
43.6
I-III
5
17.9
44
34.6
IV
23
82.1
83
65.4
no/former
3
11.1
29
24.2
current
24
88.9
91
75.8
no/former
3
11.1
29
23.8
current
24
88.9
93
76.2
non-related1
24
88.9
83
75.5
3
11.1
27
24.5
2
related
0.695
0.005
0.835
0.444
0.381
0.084
0.137
0.147
0.130
1
viral DNA-negative or DNA-positive but transcript-negative; 2 viral DNA- and transcript-positive according to [20]; 3 Chi-square test
Significant results (p <0.05) (including the HR, 95% CI) are marked in boldface
Patients with a high GLO1 expression had a significantly
shorter progression-free and disease-specific survival, suggesting a critical role of GLO1 activity not only in the initiation and maintenance of malignant tumor growth, but
also the invasive capacity and metastatic spread of OPSCC
tumor cells. Indeed, a significant correlation between
GLO1 overexpression and tumor cell invasion, lymph
node metastasis as well as reduced 5-year survival was
reported for gastric cancer [8]. Furthermore, a growing
body of experimental evidence indicates a potential role
for GLO1 in tumor cell motility and invasion, which was
demonstrated by ectopic GLO1 overexpression or gene silencing in established tumor cell lines derived from gastric
cancer [8], cutaneous SCC [13], and prostate cancer [15].
In this context it is also worth noting that high GLO1 expression has been linked to the activation of distinct key
Table 2 Multivariate Cox regression models for progression-free and disease-specific survival
Progression-free survival
Disease-specific survival
Risk factor
HR
95% CI
p-value
HR
95% CI
p-value
T status
T3–4 vs T1–21
1.282
0.749–2.197
0.365
1.230
0.667–2.268
0.508
N status
N+ vs N01
1.655
0.804–3.409
0.171
2.435
1.023–5.796
0.044
Clinical staging
IV vs I-III1
1.516
0.771–2.983
0.228
1.702
0.778–3.722
0.183
Tobacco
current vs never/former1
2.315
1.174–4.564
0.015
1.732
0.876–3.426
0.114
HPV status2
Non-related vs related1
0.412
0.200–0.849
0.016
0.356
0.157–0.805
0.013
Subgroup
GLO1high/nuc vs GLO1others, 1
1.784
1.054–3.018
0.031
1.791
1.037–3.094
0.037
HR Hazard ratio, CI confidence interval, 1reference group, 2related = viral DNA+RNA+, non-related = viral DNA+RNA− or viral DNA− according to [20]
Significant results (p <0.05) (including the HR, 95% CI) are marked in boldface
Kreycy et al. BMC Cancer (2017) 17:382
regulators in oncogenic signaling, such as NF-κB, AP1
and PI3K-AKT, which might contribute to tumor cell proliferation and survival, but also accelerated tumor cell motility, metastasis and treatment resistance [7].
In a substantial amount of OPSCCs with GLO1 expression, we detected a predominant nuclear staining in
tumor cells. Nuclear GLO1 staining was already reported
for human cutaneous basal cell carcinoma [13] and prostate cancer [15], and nuclear GLO1 translocation was
shown in a cell culture model of murine fibrosarcoma
[32]. But for the first time, we demonstrate that nuclear
GLO1 translocation has a clinical impact as it is significantly correlated with shorter disease-specific survival.
Furthermore, the combination of high and nuclear
GLO1 staining serves as independent risk factor for an
unfavorable outcome of OPSCC patients. So far, the
mode of regulation and causal role of nuclear GLO1 in
malignant progression and treatment failure remains
largely elusive and will be a major challenge for future
studies. It has been speculated that one consequence of
DNA damaging therapy is a dramatic increase in MG
formation due to active processes of DNA repair [3]. As
a consequence DNA and nuclear proteins become modified, which might potentiate the cytotoxic effect of antitumor treatment. The presence of nuclear GLO1 might
serve as a potent defense mechanism to protect key regulators of DNA repair and tumor cell survival in the nucleus from inactivation by MG-induced modification.
Conclusions
In summary, the presented data support a critical role of
GLO1 in the malignant progression and clinical outcome
of OPSCC patients. Detection of a high and nuclear
GLO1 staining pattern could be implemented in future
clinical studies to identify OPSCC patients with a high risk
for treatment failure, which might benefit from specific
targeting of accelerated GLO1 expression and activity.
Additional files
Additional file 1: Table S1. Summary of pathological and clinical data
of the patient cohort (DOCX 29 kb)
Additional file 2: Table S2. List of primary and secondary antibodies
(DOCX 44 kb)
Additional file 3: Table S3. Summary of the GLO1 immunoreactivity
score, Arg-pyrimidine protein level and patient characteristics (XLSX 21 kb)
Additional file 4: Table S4. Summary of the GLO1 protein level and
localization as well as patient characteristics (XLSX 25 kb)
Additional file 5: Fig. S1. Viability of FaDu and Cal27 cells at low
concentrations of methylglyoxal. Assessment of the cytotoxic effect of
MG at low concentration in a colony-forming assay. (TIFF 92 kb)
Additional file 6: Fig. S2. Impact of GLO1 inhibition on MG
accumulation. Quantification of MG concentrations in cell culture
supernations by HPLC. (TIFF 108 kb)
Page 8 of 9
Additional file 7: Table S5. Univariate analysis of distinct risk factors for
progression-free and disease-specific survival. (DOCX 72 kb)
Additional file 8: Fig. S3. Correlation of GLO1 staining patterns with
PFS and DSS in patient subgroups stratified by surgery. Forrest plots for
progression-free and disease-specific survival for subgroups of patients
with or without surgery. (TIFF 178 kb)
Additional file 9: Fig. S4. Correlation of GLO1 staining patterns with
PFS and DSS in patient subgroups stratified by chemotherapy. Forest
plots for progression-free and disease-specific survival for subgroups of
patients with or without chemotherapy. (TIFF 177 kb)
Additional file 10: Fig. S5. Correlation of GLO1 staining patterns with
PFS and DSS in patient subgroups stratified by radiotherapy. Forest plots
for progression-free and disease-specific survival for subgroups of patients
with or without radiotherapy. (TIFF 178 kb)
Abbreviations
AGEs: Advanced glycation end products; AP: Argpyrimidine; BrBzGSHCp2: S-pbromobenzylglutathione cyclopentyl diester; DSS: Disease-specific survival;
GLO1: Glyoxalase 1; HNSCC: Head and neck squamous cell carcinoma;
HPV: Human papilloma virus; MG: Methylglyoxal; OPSCC: Oropharyngeal
squamous cell carcinoma; PFS: Progression-free survival
Acknowledgments
We gratefully acknowledge Leoni Erdinger, Ines Kaden, Nataly Henfling, Antje
Schuhmann and Ingeborg Vogt for excellent technical assistance, Dana
Holzinger for providing data on the HPV status, and Pilar Bayo and Sarika
Sharma for fruitful discussion. We thank the tissue bank of the National Center
for Tumor Disease (Institute of Pathology, University Hospital Heidelberg) for
providing tumor specimens of OPSCC patients. We acknowledge the financial
support of the German Research Foundation and Ruprecht-Karls-Universität
Heidelberg within the funding program Open Access Publishing.
Funding
This work was supported in part by the German Research Foundation (HE
5760/3–1 to JH and the SFB1118 to TF) and the Helmholtz Cross Program
Topic Metabolic Dysfunction (to TF). These funding included consumables
for the collection, analysis, and interpretation of data, which are presented in
the manuscript.
Availability of data and materials
Datasets supporting the conclusions of this article are included within the
article and its additional files.
Authors’ contributions
N.K. and C.G. performed experiments and data acquisition; T.F., C.F., N.G. and
P.P. provided reagents, materials and analytical tools; J.H. and K.Z. were
responsible for conception and design of the study as well as data
interpretation, and wrote the manuscript. All authors read and approved the
final manuscript.
Competing interests
The authors declare that they have no financial conflict of interest.
Consent for publication
Not applicable.
Ethics approval and consent to participate
Of the patients who gave informed consent to participate human tissue
specimens were collected and provided by the tissue bank of the National
Center for Tumor Disease (Institute of Pathology, University Hospital
Heidelberg) after approval by the local institutional review board of the
Medical Faculty Heidelberg (ethic votes: 176/2002 and 206/2005). The study
was performed according to the ethical standards of the Declaration of
Helsinki.
Publisher’s Note
Springer Nature remains neutral with regard to jurisdictional claims in
published maps and institutional affiliations.
Kreycy et al. BMC Cancer (2017) 17:382
Author details
1
Department of Otolaryngology, Head and Neck Surgery, University Hospital
Heidelberg, Im Neuenheimer Feld 400, D-69120 Heidelberg, Germany.
2
Department of Medicine I and Clinical Chemistry, University Hospital
Heidelberg, Heidelberg, Germany. 3Institute of Pathology, University Hospital
Heidelberg, Heidelberg, Germany. 4Medical Oncology, National Center for
Tumor Diseases (NCT) and Hamamatsu Tissue Imaging and Analysis Center
(TIGA), BIOQUANT, Heidelberg, Germany. 5Department of Otolaryngology,
Head and Neck Surgery, University Hospital Heidelberg and Research Group
Molecular Mechanisms of Head and Neck Tumors, German Cancer Research
Center (DKFZ), Heidelberg, Germany.
Received: 5 April 2016 Accepted: 17 May 2017
References
1. Vander Heiden MG, Cantley LC, Thompson CB. Understanding the Warburg
effect: the metabolic requirements of cell proliferation. Science. 2009;324:1029–33.
2. Gatenby RA, Gillies RJ. Why do cancers have high aerobic glycolysis? Nat
Rev Cancer. 2004;4:891–9.
3. Thornalley PJ, Rabbani N. Glyoxalase in tumourigenesis and multidrug
resistance. Semin Cell Dev Biol. 2011;22:318–25.
4. Rabbani N, Thornalley PJ. Methylglyoxal, glyoxalase 1 and the dicarbonyl
proteome. Amino Acids. 2012;42:1133–42.
5. Hidmark A, Fleming T, Vittas S, Mendler M, Deshpande D, Groener JB, et al.
A new paradigm to understand and treat diabetic neuropathy. Exp Clin
Endocrinol Diabetes. 2014;122:201–7.
6. Matafome P, Sena C, Seica R. Methylglyoxal, obesity, and diabetes.
Endocrine. 2013;43:472–84.
7. Geng X, Ma J, Zhang F, Xu C. Glyoxalase I in tumor cell proliferation and
survival and as a potential target for anticancer therapy. Oncol Res Treat.
2014;37:570–4.
8. Cheng WL, Tsai MM, Tsai CY, Huang YH, Chen CY, Chi HC, et al. Glyoxalase-I
is a novel prognosis factor associated with gastric cancer progression. PLoS
One. 2012;7:e34352.
9. Sakellariou S, Fragkou P, Levidou G, Gargalionis AN, Piperi C, Dalagiorgou G,
et al. Clinical significance of AGE-RAGE axis in colorectal cancer: associations
with glyoxalase-I, adiponectin receptor expression and prognosis. BMC
Cancer. 2016;16:174.
10. Fonseca-Sanchez MA, Rodriguez Cuevas S, Mendoza-Hernandez G, BautistaPina V, Arechaga Ocampo E, Hidalgo Miranda A, et al. Breast cancer
proteomics reveals a positive correlation between glyoxalase 1 expression
and high tumor grade. Int J Oncol. 2012;41:670–80.
11. Zhang S, Liang X, Zheng X, Huang H, Chen X, Wu K, et al. Glo1 genetic
amplification as a potential therapeutic target in hepatocellular carcinoma.
Int J Clin Exp Pathol. 2014;7:2079–90.
12. Hu X, Yang X, He Q, Chen Q, Yu L. Glyoxalase 1 is up-regulated in
hepatocellular carcinoma and is essential for HCC cell proliferation.
Biotechnol Lett. 2014;36:257–63.
13. Zou XY, Ding D, Zhan N, Liu XM, Pan C, Xia YM. Glyoxalase I is differentially
expressed in cutaneous neoplasms and contributes to the progression of
squamous cell carcinoma. J Invest Dermatol. 2015;135:589–98.
14. Bair WB 3rd, Cabello CM, Uchida K, Bause AS, Wondrak GT. GLO1
overexpression in human malignant melanoma. Melanoma Res. 2010;20:85–96.
15. Baunacke M, Horn LC, Trettner S, Engel KM, Hemdan NY, Wiechmann V, et
al. Exploring glyoxalase 1 expression in prostate cancer tissues: targeting the
enzyme by ethyl pyruvate defangs some malignancy-associated properties.
Prostate. 2014;74:48–60.
16. Sakamoto H, Mashima T, Kizaki A, Dan S, Hashimoto Y, Naito M, et al.
Glyoxalase I is involved in resistance of human leukemia cells to antitumor
agent-induced apoptosis. Blood. 2000;95:3214–8.
17. Leemans CR, Braakhuis BJ, Brakenhoff RH. The molecular biology of head
and neck cancer. Nat Rev Cancer. 2011;11:9–22.
18. Ndiaye C, Mena M, Alemany L, Arbyn M, Castellsague X, Laporte L, et al.
HPV DNA, E6/E7 mRNA, and p16INK4a detection in head and neck cancers:
a systematic review and meta-analysis. Lancet Oncol. 2014;15:1319–31.
19. Gillison ML, Chaturvedi AK, Anderson WF, Fakhry C. Epidemiology of human
Papillomavirus-positive head and neck Squamous cell carcinoma. J Clin
Oncol. 2015;33:3235–42.
Page 9 of 9
20. Holzinger D, Schmitt M, Dyckhoff G, Benner A, Pawlita M, Bosch FX. Viral
RNA patterns and high viral load reliably define oropharynx carcinomas
with active HPV16 involvement. Cancer Res. 2012;72:4993–5003.
21. Holzinger D, Flechtenmacher C, Henfling N, Kaden I, Grabe N, Lahrmann B,
et al. Identification of oropharyngeal squamous cell carcinomas with active
HPV16 involvement by immunohistochemical analysis of the retinoblastoma
protein pathway. Int J Cancer. 2013;133:1389–99.
22. McLellan AC, Thornalley PJ. Synthesis and chromatography of 1,2-diamino4,5-dimethoxybenzene, 6,7-dimethoxy-2-methylquinoxaline and 6,7dimethoxy-2,3-dimethylquinoxaline for use in a liquid chromatographic
fluorimetric assay of methylglyoxal. Anal Chim Acta. 1992;263:137–42.
23. Thornalley PJ, Yurek-George A, Argirov OK. Kinetics and mechanism of the
reaction of aminoguanidine with the alpha-oxoaldehydes glyoxal,
methylglyoxal, and 3-deoxyglucosone under physiological conditions.
Biochem Pharmacol. 2000;60:55–65.
24. Lo TW, Thornalley PJ. Inhibition of proliferation of human leukaemia 60
cells by diethyl esters of glyoxalase inhibitors in vitro. Biochem
Pharmacol. 1992;44:2357–63.
25. Thornalley PJ, Edwards LG, Kang Y, Wyatt C, Davies N, Ladan MJ, et al.
Antitumour activity of S-p-bromobenzylglutathione cyclopentyl diester in
vitro and in vivo. Inhibition of glyoxalase I and induction of apoptosis.
Biochem Pharmacol. 1996;51:1365–72.
26. Niyazi M, Niyazi I, Belka C. Counting colonies of clonogenic assays by using
densitometric software. Radiat Oncol. 2007;2:4.
27. Franken NA, Rodermond HM, Stap J, Haveman J, van Bree C. Clonogenic
assay of cells in vitro. Nat Protoc. 2006;1:2315–9.
28. Wiechert L, Nemeth J, Pusterla T, Bauer C, De Ponti A, Manthey S, et al.
Hepatocyte-specific S100a8 and S100a9 transgene expression in mice
causes Cxcl1 induction and systemic neutrophil enrichment. Cell Commun
Signal. 2012;10:40.
29. McLellan AC, Phillips SA, Thornalley PJ. The assay of methylglyoxal in
biological systems by derivatization with 1,2-diamino-4,5dimethoxybenzene. Anal Biochem. 1992;206:17–23.
30. Chiavarina B, Nokin MJ, Durieux F, Bianchi E, Turtoi A, Peulen O, et al. Triple
negative tumors accumulate significantly less methylglyoxal specific adducts
than other human breast cancer subtypes. Oncotarget. 2014;5:5472–82.
31. Antognelli C, Mezzasoma L, Fettucciari K, Talesa VN. A novel mechanism of
methylglyoxal cytotoxicity in prostate cancer cells. Int J Biochem Cell Biol.
2013;45:836–44.
32. Wang Y, Kuramitsu Y, Tokuda K, Okada F, Baron B, Akada J, et al. Proteomic
analysis indicates that overexpression and nuclear translocation of
lactoylglutathione lyase (GLO1) is associated with tumor progression in
murine fibrosarcoma. Electrophoresis. 2014;35:2195–202.
Submit your next manuscript to BioMed Central
and we will help you at every step:
• We accept pre-submission inquiries
• Our selector tool helps you to find the most relevant journal
• We provide round the clock customer support
• Convenient online submission
• Thorough peer review
• Inclusion in PubMed and all major indexing services
• Maximum visibility for your research
Submit your manuscript at
www.biomedcentral.com/submit