KRAS mutation analysis of single circulating tumor cells from patients with metastatic colorectal cancer
Bạn đang xem bản rút gọn của tài liệu. Xem và tải ngay bản đầy đủ của tài liệu tại đây (1.38 MB, 10 trang )
Kondo et al. BMC Cancer (2017) 17:311
DOI 10.1186/s12885-017-3305-6
RESEARCH ARTICLE
Open Access
KRAS mutation analysis of single circulating
tumor cells from patients with metastatic
colorectal cancer
Yuurin Kondo1* , Kazuhiko Hayashi1, Kazuyuki Kawakami1, Yukari Miwa2, Hiroshi Hayashi2 and
Masakazu Yamamoto3
Abstract
Background: The molecular profiles of tumors may inform the selection of appropriate targeted therapies.
Circulating tumor cells (CTCs) reflect the real-time status of tumor genotypes. CTCs exhibit high genetic
heterogeneity within a patient; accordingly, the analysis of individual CTCs, including their heterogeneity, may
enable more precise treatments. We analyzed KRAS mutations in single CTCs from patients with metastatic
colorectal cancer (mCRC) using a new single-cell picking system.
Methods: Blood samples were obtained from 61 patients with mCRC. CTCs were enriched and fluorescently
labeled using the CellSearch® System. They were recovered using the single-cell picking system based on the
fluorescence intensity of marker dyes. Single CTCs and tumor tissue samples were examined for mutations in
codons 12 and 13 of the KRAS gene.
Results: CTCs were detected in 27 of 61 patients with mCRC. We isolated at least two CTCs from 15 of 27 patients.
KRAS genotype was evaluated in a total of 284 CTCs from 11 patients, and 15 cells with mutations were identified
in four patients. In 10 of 11 patients, the KRAS status was the same in the primary tumor and CTCs. In one patient,
the KRAS status was discordant between the primary tumor and CTCs. In two patients, different KRAS mutations
were found among individual CTCs.
Conclusions: We successfully isolated single CTCs and detected KRAS mutations in individual cells from clinical
samples using a novel application of single-cell isolation system. Using the system, we detected CTC heterozygosity
and heterogeneity in KRAS status among CTCs within a patient and between CTCs and tumor tissues.
Keywords: Circulating tumor cells, Mutation analysis, KRAS, Single cell analysis, Heterogeneity
Background
Colorectal cancer (CRC) is one of the leading causes
of cancer deaths worldwide. Recently, the use of new
antitumor agents for metastatic CRC (mCRC), such as
epidermal growth factor receptor-targeted monoclonal
antibodies (anti-EGFR), has significantly improved the
treatment of colorectal disease [1, 2].
KRAS mutations are present in 30–40% of CRC patients
[3]. Activating mutations in KRAS are responsible for antiEGFR therapy resistance in mCRC; accordingly, KRAS
* Correspondence:
1
Department of Chemotherapy and Palliative Care, Tokyo Women’s Medical
University, 8-1 Kawada-chyo, Shinjuku-ku, Tokyo 162-8666, Japan
Full list of author information is available at the end of the article
genotyping is recommended before EGFR-targeted therapies are administered (e.g., cetuximab and panitumumab)
[4]. Although KRAS is a negative predictive marker, not all
patients with wild-type KRAS in tumor cells respond to
EGFR-targeted therapies. KRAS genotype may not be an accurate predictor of treatment response owing to genetic differences between primary and metastatic tumors.
Several studies have shown that distant metastases can
have unique genetic alterations that are different from
those in the primary tumor [5, 6]. In addition, acquired
resistance is partly achieved by the selection of preexisting minor subclones harboring mutations that
confer resistance to targeted therapy [7, 8]. Primary
tumor specimens are not always representative of
© The Author(s). 2017 Open Access This article is distributed under the terms of the Creative Commons Attribution 4.0
International License ( which permits unrestricted use, distribution, and
reproduction in any medium, provided you give appropriate credit to the original author(s) and the source, provide a link to
the Creative Commons license, and indicate if changes were made. The Creative Commons Public Domain Dedication waiver
( applies to the data made available in this article, unless otherwise stated.
Kondo et al. BMC Cancer (2017) 17:311
metastases, which can occur many years after resection
of the primary tumor [9, 10]. Characterization of metastatic sites may provide more important information
than characterization of primary tumors with respect to
guiding targeted therapies [11]. However, invasive biopsies of metastatic sites are not always feasible and repeated testing for real-time surveillance is often difficult.
To overcome the abovementioned problems, circulating tumor cells (CTCs), which can be analyzed clinically
by “liquid biopsy,” may be useful for the noninvasive
characterization of tumors. These cells reflect subpopulations of primary and/or metastatic tumor cells and are
accessible by blood collection [12]. The number of CTCs
is correlated with prognosis in several tumor types, such as
breast, prostate, and colorectal cancers [13–15]. Monitoring
alterations in CTC number during anticancer treatment
not only improves prognostic prediction, but also provides information regarding therapy response [14–20].
In addition to enumeration, the molecular characterization
of CTCs is important for therapeutic decision-making [21].
Among other challenges with respect to CTC
characterization, the isolation of pure CTCs that are
not contaminated with leukocytes is still difficult
owing to their rarity in peripheral blood [12]. Several
studies have detected heterogeneity among CTCs at the
single cell level [22, 23]. This suggests the importance of
analyzing CTCs at the single-cell level for accurate tumor
profiling. However, genetic heterogeneity has not been
incorporated into clinical treatments.
Here, we demonstrated the feasibility of detecting
KRAS mutations in single CTCs isolated from mCRC
patients in a novel application of an automated singlecell isolation system to identify individual cancer cells.
Our objective was to analyze high-purity CTCs using
this cell recovery system and to evaluate the discordance
in KRAS status between primary tumors and CTCs as
well as variation among CTCs.
Methods
Ethics and consent statement
This study was approved by the ethical committee of Tokyo
Women’s Medical University (approval number, 247) and
all patients provided written informed consent prior to
participation in the study. All participants in this study
provided written informed consent for the publication of
their clinical details.
Cell lines
The H1975 human lung cancer cell line containing
EGFR mutations was obtained from the ATCC Cell Bank
(Manassas, VA, USA) and was used for cell-recovery
experiments. The A549 human lung cancer cell line containing KRAS mutations was obtained from the ATCC
Cell Bank and was used for blood spiking experiments.
Page 2 of 10
H1975 was cultured in RPMI-1640 medium containing
10% fetal bovine serum (both from Thermo fisher scientific, Waltham, MA, USA) in a humidified 5% CO2 incubator at 37 °C. A549 was cultured in F-12 K medium
(Thermo fisher scientific) containing 10% fetal bovine
serum in a humidified 5% CO2 incubator at 37 °C.
Tumor cell enrichment, staining, and enumeration
The enrichment and enumeration of tumor cells
from whole blood were performed using the FDAapproved CellSearch® System (Janssen Diagnostics,
Raritan, NJ, USA). First, 7.5 mL of the whole blood
sample was processed using the CellSearch® CTC Kit
(Janssen Diagnostics). In this assay, EpCAM-based
immunomagnetically enriched cells were fluorescently
counterlabeled with DAPI to stain nuclei, phycoerythrin
(PE)-conjugated antibodies directed against cytokeratins 8/18/19, and allophycocyanin (APC)-conjugated
antibodies directed against CD45 to stain the remaining
WBCs. After enrichment, isolated fluorescently labeled
cells were resuspended in a MagNestⓇ Cartridge Holder
(Janssen Diagnostics) and analyzed (i.e., identified and
enumerated) using the CellTracks Analyzer IIⓇ (Janssen
Diagnostics) according to the manufacturer’s instructions.
Single CTC isolation
To isolate single cells, an automated single-cell isolation
system was used, i.e., the ASONECell Picking System
(ASONE, Osaka, Japan), to identify individual cancer
cells based on staining [24].
Each CTC-enriched sample was recovered from the
CellSearch® cartridge and manually loaded onto the
microchamber array chip (84,640 wells of 30-μm diameter, 196,000 wells of 20-μm diameter). The fluorescently
labeled cells were introduced into each well of the
microchamber by centrifugation (2 repetitions of acceleration at 200 rpm for 1 min by plate centrifugation).
After loading the microchamber array into the singlecell picking system, the fluorescence intensity of each
cell was scanned and analyzed using a computer with a
robot. Cells of interest were marked according to PE, APC,
and DAPI fluorescence intensity. Marked cells were automatically collected with a glass capillary attached to the micromanipulator of the robot. Each cell was transferred and
recovered in 10 μL of PBS in a 200-μL PCR tube. The samples were dried completely then stored in a deep freezer at
−80 °C until use. Representative images obtained using the
ASONECell Picking System are shown in Fig. 1.
Evaluation of cell collection using the new single cell
picking application
A solution of H1975 cells stained with Cell Tracker™
Green (Thermo fisher scientific) was loaded on the
single-cell picking system and single cells were collected
Kondo et al. BMC Cancer (2017) 17:311
a
Page 3 of 10
b
c
d
BF
CK-PE
CD45APC
WBCs
CTC
CTCs
WBC
CTC
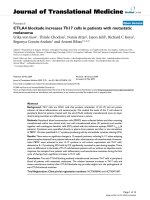
Fig. 1 Summary of the ASONECell Picking System. a Fluorescently labeled cells are loaded in a microchamber array and sorted by the machine.
b Scatter plot of mean fluorescence intensities for CK-PE (x-axis) and CD45-APC (y-axis) staining. c Bright-field, PE, and APC channel images of
peripheral blood mononuclear cells (PBMCs) and circulating tumor cells (CTCs). CTCs can be distinguished from contaminated leukocytes by
combining the fluorescence filters. d Cells marked with a red circle are automatically collected with a glass capillary
and added to individual wells of a 96-well microplate. The
existence of a single cell in each well was confirmed by
fluorescent microscopy. To quantify tumor cells identified
using the single-cell picking system, approximately 1500
or a small number of (2–25) A549 cells were spiked into
7.5 mL of whole blood from a healthy donor (HD), which
was collected in a CellSave Preservative Tube (Janssen
Diagnostics). A549 cells spiked in HD blood were processed using the CellSearch® CTC Kit (Janssen Diagnostics), and A549 cell counts were determined using the
CellTracks Analyzer II® (Janssen Diagnostics). Enriched
cells were loaded onto the single-cell picking system and
re-counted. CTC counts obtained by CellSearch® and the
single-cell picking system were compared. When a small
number of cells, i.e., A549 cells, were spiked, single cells
were recovered and the recovery rate was calculated.
Preclinical validation of single cell KRAS mutation
detection using the A549 cell line
To assess the feasibility of using recovered cells for downstream analyses, a known number of A549 cells was added
to 7.5 mL of peripheral blood obtained from an HD, collected in a CellSave Preservative tube, and enriched using
the CellSearch® system. Then, single cells were recovered
into individual PCR tubes using the single-cell picking
system. A total of 24 recovered A549 cells were subjected
to KRAS gene-specific amplification after cell lysis with
proteinase K (Takara Bio, Kusatsu, Japan) and sodium
dodecyl sulfate in individual PCR tubes as previously demonstrated [25]. The DNA from single cell was subjected to
KRAS gene-specific amplification and sequenced using the
same protocol as that used for CTCs described below.
Nine single WBCs isolated from blood samples also
served as wild type control for sequencing.
Patient enrolment and tissue and sample collection
The study included 61 patients who had mCRC and
underwent various anticancer therapies at the Department
of Chemotherapy and Palliative Care or the Department
of Surgery, Institute of Gastroenterology, Tokyo Women’s
Medical University Hospital. Paraffin-embedded or fresh
frozen sections collected from primary tumors were used
for KRAS characterization. For each patient, two 10-mL
blood samples were drawn into CellSave Preservative
tubes or EDTA tubes for CTC enrichment, enumeration,
and a mutation analysis. Blood samples were processed
within 72 h of collection.
KRAS mutation analysis
A total of 284 single CTCs were analyzed by direct sequencing of the KRAS gene. Sequencing was performed
using DNA isolated from CTCs directly or following
whole-genome amplification (WGA). For the former analysis, a total of 107 single CTCs were subjected to KRAS
gene-specific amplification after cell lysis with proteinase
K and sodium dodecyl sulfate. The following nested PCR
primers for KRAS codons 12 and 13 were designed using
Primer3: outer primers, forward 5′-AAGGTACTGGTGG
AGTATTTG-3′ and reverse 5′-GTACTCATGAAAATG
GTGAGA-3′; inner primers, forward 5′-ATTATAAGGC
CTGCTGAAAATGAGTGA-3′ and reverse 5′-ATATGC
ATATTAAAACAAGATTTACCTCTA-3′. The reaction
was amplified for 40 cycles at 94, 59, and 72 °C for
30 s per cycle for each temperature. The remaining
177 single CTCs were first subjected to WGA using
the Ampli1™ WGA Kit (Silicon Biosystems, Bologna,
Italy) according to the manufacturer’s instructions.
They were then subjected to KRAS gene-specific
amplification using the following primers: forward
5′-CCTTATGTGTAGCATGTTCTAATATAG-3′ and
reverse 5′-CTATTGTTGGATCATATTCGTCCAC-3′.
Amplified DNA from CTCs was used for direct sequencing of KRAS. PCR products were sequenced
using the Big Dye Terminator 3.1 Cycle Sequencing
Kit (Applied Biosystems, Foster City, CA, USA). The
Kondo et al. BMC Cancer (2017) 17:311
sequencing reaction was analyzed using a 3130xl Genetic
Analyzer (Applied Biosystems).
DNA from primary tumor tissue was extracted using
the FFPE Tissue Kit (Qiagen, Hilden, Germany), subjected
to KRAS gene-specific amplification, and sequenced using
the same protocol as that used for CTCs.
Results
Evaluation of single-cell collection using the single-cell
picking system
To quantify the rate of tumor cell recovery using the
single-cell picking system, fluorescently labeled H1975
cells were loaded onto the single-cell picking system and
collected individually in wells of a 96-well microplate.
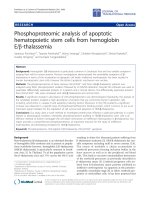
Single cells were found in 84 out of 96 wells using fluorescence microscopy, for an isolation success rate of 87.5%
(Fig. 2). We next assessed the recovery rate of single CTCs
from CellSearch® system. Enriched cells in CellSearch® cartridges were loaded into the single-cell picking system and
analyzed. The results of eight independent experiments
are summarized in Table 1. In a comparative cell identification analysis, 73.4% of the total cells detected using the
CellSearch system were observed using the single-cell
picking system after loading into the microchamber, on
average. We examined the recovery rate using serial dilutions to obtain a more clinically relevant range (2–25
cells). The results are shown in Table 2. The recovery rate
was 70.8%, on average (range 38.5–100%).
Preclinical validation of single cell KRAS mutation
detection using the A549 cell line
After CellSearch® enrichment, 24 single A549 cells were
recovered by the single-cell picking system and subjected
Page 4 of 10
to KRAS gene-specific amplification. The A549 cell line
harbors homozygous KRAS mutation (G12S). Codons 12
and 13 of the KRAS gene were sequenced in all sorted
cells. In all recovered single A549 cells, KRAS mutation of
codon 12 was detected. In 21 of the 24 single A549 cells,
the known original homozygous mutation was detected.
In the remaining three single A549 cells, the wild-type
KRAS allele was detected by sequencing, in addition to
the mutant allele (i.e., the samples were heterozygous).
This may be explained by contamination with HD blood.
Nine single WBCs isolated from HD blood sample were
confirmed the expected wild-type genotype.
Patient characteristics
Sixty-one mCRC patients were enrolled in the study.
The patient characteristics, including the number of
CTCs based on CellSearch®, are listed in Table 3. CTCs
(≥1) were detected in 27 out of 61 (44.3%) patients. The
range of CTC counts in the CTC-positive patient group
(CTC ≥ 1) was 1 to 105 cells.
In the CTC-negative patient group (CTC = 0), a KRAS
mutation was found in 9 out of 34 (25%) patients. In the
CTC-positive patient group, the mutation was found in
10 out of 27 (37%) patients. The presence of CTCs was
not related to clinical characteristics.
Evaluation of CTCs in clinical samples
Eighty-eight blood samples from 61 patients were
analyzed using CellSearch®; the full analysis is summarized in the sample flowchart shown in Fig. 3. Samples
obtained from 27 patients (44.3%) for whom at least one
CTC was detected using CellSearch® were selected for
sorting by the single-cell picking system. For 15 (24.6%)
Fig. 2 Single-cell collection. a H1975 cells stained by Cell Tracker Green were loaded onto the single-cell and collected into 96-well microplate
(200uL PBS/well). b The picture of the isolated single cell confirmed by fluorescent microscopy. c Images of the recovered cells in each well of
96-well microplate. In 84 wells, isolation of single-cell was succeeded. In 12 wells, isolation was failed. In six of 12 wells, more than one cell was
collected. Isolation success yield was 87.5% (84/96)
Kondo et al. BMC Cancer (2017) 17:311
Page 5 of 10
Table 1 Comparison of tumor cell counts obtained using
CellSearch and the ASONECell Picking System
n=8
CellSearch®
(cells)
ASONECell
Picking System
(cells)
Re-identification rate (%)
ASONECell/ CellSearch®
1
1634
1072
65.6%
2
1692
1258
74.3%
3
1674
1430
85.4%
4
1827
1463
80.1%
5
1874
1335
71.2%
6
1927
1369
71%
7
1964
1324
67.4%
8
1783
1289
72.3%
Average
1797
1318
73.4%
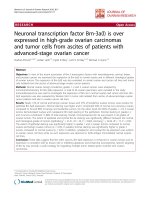
For Patient III, a c.35G > C (p.G12A) mutation in
codon 12 of the KRAS gene was detected in two of three
CTCs. In one CTC, the mutation was homozygous,
while it was heterozygous in the other (Fig. 4). Thus,
CTCs exhibited genetic heterogeneity at the single-cell
level and showed the potential for loss of heterozygosity
of the wild-type allele.
For Patient VI, sample #98 contained a c.35G > A
(p.G12D) mutation in codon 12 of the KRAS gene in two of
five CTCs and sample #99 had the same mutation in four of
eight CTCs. For Patient IX, sample #130 had the wild-type
KRAS genotype for all five analyzed CTCs and sample #131
contained a c.38G > A (p.G13D) mutation in codon 12 in
one of two CTCs. For Patient XI, the c.35G > A (p.G12D)
mutation in codon12 was detected in one of six CTCs.
KRAS mutational status of single CTCs subjected to WGA
of these 27 patients, at least two single CTCs were
recovered by the single-cell picking system.
Single CTCs recovered from 11 (18%) patients from
whom primary tumor samples were available were evaluated to determine the KRAS genotype; primary tumor
samples were also sequenced in these cases.
KRAS mutational status of single CTCs determined by PCR
A total of 284 single CTCs were recovered from 11 mCRC
patients; 107 single CTCs from nine patients were subjected to direct KRAS gene-specific amplification and 77
were successfully sequenced (median percentage of sequenced CTCs per patient, 70%; range, 20–100%; Table 4,
left panel). Sequencing failure may reflect cell loss during
sample manipulation or PCR amplification failure.
CTCs from five of nine patients had wild-type KRAS
at codons 12 and 13. Ten CTCs from the remaining
four patients (Patients III, VI, IX, and XI) contained
mutations in the KRAS gene.
The remaining 177 single CTCs from nine patients were
subjected to WGA. KRAS of 153 CTCs was successfully
sequenced (median percentage of sequenced CTCs per
patient, 85.9%; range, 25–100%; Table 4, right panel). Sequencing failure may have been caused by cell loss during sample manipulation, the WGA reaction, or PCR
amplification failure.
CTCs from seven of nine patients were wild type for
KRAS codons 12 and 13. Five CTCs from the remaining
two patients (Patient VI and IX) contained mutations in
the KRAS gene.
For patient VI, sample #98 did not have a mutation in
KRAS codons 12 and 13 in the two analyzed CTCs and
sample #99 contained a c.35G > A (p.G12D) mutation in
codon 12 in three of 73 CTCs. For patient IX, two serial
blood samples contained different mutations. Sample #130
showed a c.38G > A (p.G13D) mutation in codon 13 in one
of eight CTCs and sample #131 contained a c.35G > A
(p.G12D) mutation in codon 12 in one of seven CTCs.
Table 2 Re-identification rate and recovery rate for a small number of cells (2–25 cells)
n=9
CellSearch®
Count (cells)
ASONECell
Count (cells)
Pick up (cells)
Re-identification
ratea (%)
Recovery
rateb (%)
1
2
1
1
50%
50%
2
2
2
2
100%
100%
3
4
4
4
100%
100%
4
8
7
5
87.5%
62.5%
5
13
6
5
46.2%
38.5%
6
19
15
14
78.9%
73.7%
7
21
13
11
61.9%
52.4%
8
25
21
18
84%
72%
9
25
23
22
92%
88%
Average
13.2
9.7
9.1
77.8%
70.8%
a
Re-identification rate, the number of cells counted using CellSearch® divided by the number of cells re-counted using ASONECell Picking system
b
Recovery rate, the number of cells counted using CellSearch® divided by the number of cells picked up using ASONEcell Picking system
Kondo et al. BMC Cancer (2017) 17:311
Page 6 of 10
Table 3 Patient characteristics according to CTC number
assessed by CellSearch
CTC = 0
CTC ≥ 1
Total (%)
n = 34
n = 27
n = 61
Median
69
63
67
(range)
(34–80)
(36–82)
(34–82)
Right hemicolon
14
9
23 (38%)
Left hemicolon
7
7
14 (23%)
Rectum
13
10
23 (38%)
Other
0
1
1 (1%)
Liver only
14
10
24 (40%)
Others
20
17
37 (60%)
Patients’
characteristics
Age
Site of primary tumor
Site of metastasis
Disease status
Primary
11
12
23 (38%)
Recurrence
23
15
38 (62%)
21
14
35 (57%)
KRAS status in primary tissue
Wild-type
Mutant
9
10
19 (31%)
Unknown
4
3
7 (12%)
KRAS mutational status of primary tissues compared with
CTCs
Primary tumor tissues were available for 11 patients.
The KRAS mutation status for each of these samples is
summarized in Table 4. Wild-type KRAS was detected in
eight of 11 samples, while mutant KRAS was detected in
three primary tumor samples. In seven of 11 patients,
both CTCs and primary tissues were wild type for codons
12 and 13 of the KRAS gene. In one patient (Patient III),
both CTCs and primary tissues showed the same mutation in the KRAS gene. In the remaining three patients
(Patient VI, IX, and XI), there was discordance between
the KRAS mutational status of primary tumor tissues
and CTCs.
Discussion
In this study, we evaluated the feasibility of detecting
KRAS mutations in single CTCs isolated from mCRC
patients using the ASONECell Picking System. This
system is an automated single-cell isolation system that
allows the isolation of rare cells from a large number of
candidate cells via the analysis of immunofluorescence
signals. This is the first report indicating that the new cell
picking system can be used to isolate CTCs in clinical
samples. We performed a comparative analysis of cells
obtained using the CellSearch® system and the single-cell
picking system. The new system resulted in 26.6% cell
loss, on average, relative to the number of cells obtained
using the CellSearch® system. The lower cell counts may
reflect manual processing issues, such as pipetting errors.
The re-identification rate observed using the single-cell
picking system is comparable to that of another previously
reported device, the DEPArray™ system (Silicon Biosystems, Bologna, Italy) [26, 27]. The recovery rate in a small
number of cells was 70.8%, on average (range 38.5–100%).
This result demonstrated the feasibility of this application
in a more clinically relevant range.
In a preclinical validation of the KRAS mutation analysis of single cells, known mutations were confirmed in
87.5% of samples. The other 12.5% of samples showed
the wild-type allele, which may indicate contamination
mCRC = metastatic colon cancer, WGA = whole genome amplification
Fig. 3 Sample flowchart
12
12
#43
#46
I
10
12
#92
#96
VI
7
107
#137
Total
-
#135
XI
6
#131
X
6
#130
-
#129
IX
-
#126
VIII
12
5
#114
#99
-
10
#142
#98
10
#97
VII
VI
-
#95
3
#82
III
2
#44
II
V
KRAS status
77
6
-
2
5
-
-
1
8
5
-
6
-
8
7
3
2
12
12
72%
85.7%
-
33.3%
83.3%
-
-
20%
66.7%
50%
-
60%
-
66.7%
70%
100%
100%
100%
100%
5
-
1
5
-
-
1
4
3
-
6
-
8
7
1
2
12
12
Number of
wild-type cells
Number of
mutant cells
1
-
1
0
-
-
0
4
2
-
0
-
0
0
2
0
0
0
wild
p.G12D
-
p.G13D
wild
-
-
wild
p.G12D
p.G12D
-
wild
-
wild
wild
p.G12A
wild
wild
177
2
2
13
8
7
4
5
74
8
4
16
6
1
-
-
18
9
Number of
samples
analyzed
Sequence success
rate (%)
Number of
samples analyzed
Number of
successful
sequences
WGA
PCR
CTC
Blood
Sample
ID
Pt ID
Table 4 KRAS mutation analysis in single CTCs and primary tissue
153
1
2
7
8
6
3
3
73
2
4
14
6
1
-
-
-
16
7
Number of
successful
sequences
85.9%
50%
100%
53.8%
100%
85.7%
75%
60%
98.6%
25%
100%
87.5%
100%
100%
-
-
-
88.9%
77.8%
Sequence
success
rate (%)
KRAS status
1
2
6
7
6
3
3
70
2
4
14
6
1
-
-
-
16
7
Number of
wild-type cells
0
0
1
1
0
0
0
3
0
0
0
0
0
-
-
-
0
0
Number of
mutant cells
wild
wild
p.G12D
p.G13D
wild
wild
wild
p.G12D
wild
wild
wild
wild
wild
-
-
-
wild
wild
p.G12D
wild
wild
wild
wild
p.G12D
wild
wild
p.G12A
wild
wild
Primary
tumor
Kondo et al. BMC Cancer (2017) 17:311
Page 7 of 10
Kondo et al. BMC Cancer (2017) 17:311
Page 8 of 10
KRAS
Codon12 Codon13
Cell-1
C/C
Cell-2
G/C
Fig. 4 KRAS mutations in single CTCs from Patient III. Direct
sequencing results for KRAS codons 12 and 13; the mutation in
codon 12 was homozygosis in Cell-1 and heterozygosis in Cell-2
with normal cells during CTC selection. In this examination, no wild-type KRAS cells were found. Thus, loss of
mutant-type allele was not occurred and false negativity
was not detected. This result indicated that the system is
feasible for the detection of KRAS mutations by liquid
biopsy.
In our study, we demonstrated analyses of KRAS mutations using two different DNA amplification methods,
direct PCR and WGA. We showed the feasibility of
KRAS mutation analyses using both methods. Direct
PCR is more convenient with respect to time and cost
compared with WGA, but few mutations can be analyzed. If information for a single mutation is needed (i.e.,
EGFR T790 M for targeted therapy in lung cancer) for
treatment choices, direct PCR might be suitable. WGA
can be used for multi-locus molecular profiling. In the
colorectal cancer field, information for several mutations
is required for treatment decisions, therefore the WGA
method is appropriate.
We analyzed KRAS mutations in single CTCs and
matched primary tumors from patients with mCRC. In
total, 36.4% of patients had KRAS mutations in CTCs,
whereas 27.3% of patients had mutations in primary tumors. In 10 of 11 (90.9%) cases, the KRAS status of the
primary tumor matched that of CTCs by either direct
PCR or WGA methods. In one patient (Patient IX, Table
4), we found discordant results between the KRAS status
of single CTCs and the primary tumor. In this case, the
mutation was found in the CTC and wild-type KRAS
was found in the primary tumor. The mutation may be
present in only a minor subclone of the primary tumor.
Although a number of reports have examined the
concordance between KRAS mutations in primary tumors
and metastatic lesions in mCRC, the significance of
observed cases of discordance has only recently been considered [28–30]. Several studies have shown discrepancies
between the genetic profiles of CTCs and primary tumors
[31, 32] and heterogeneity among individual CTCs [27].
Because single-CTC analyses by liquid biopsy provide
information regarding the real-time status of existing tumors, these data might provide more accurate information
for personalized therapy.
In one patient (Patient IX), KRAS mutations in CTCs
differed among blood samples obtained at different time
periods. One CTC had a p.G13D mutation, and the
other had p.G12D. In another patient (Patient III), the
mutation was homozygous in one CTC, but heterozygous in another CTC. In these cases, either more than
one subclone was present in a tumor at a given time or
a mutation was acquired during the clinical course of
the disease. These results are consistent with the growing number of studies reporting high heterogeneity
among CTCs within a patient [18, 33–35]. Our results
raise several clinical questions about the real value and
significance of CTC analyses. One question is which status is appropriate for treatment decisions if the CTC
mutational status was different from that of the primary
tumor. Another question is which mutational status is
the most clinically significant if CTCs show genetic heterogeneity. Although heterogeneity among single CTCs
has been observed at several loci that are drug targets
(e.g., EGF receptor inhibitors) or associated with drug
resistance (e.g., PIK3CA and KRAS), the clinical relevance of this variation is unknown. To address these
questions, clinical studies are needed to monitor changes
in the mutational status of CTCs and primary and/or
metastatic tumors during treatment as well as to identify
indicators of the treatment response.
Conclusions
We examined the molecular profiles of single CTCs using
the ASONECell Picking System, a new cell sorter that
enables the isolation of single or small groups of cells from
mixed-cell suspensions. We demonstrated that the isolation
and molecular characterization of single CTCs is feasible in
mCRC patients. We detected CTC heterozygosity as well
as differences between primary tumors and CTCs with
respect to KRAS status. This system may facilitate future
analyses of the clinical significance of CTC heterogeneity.
Abbreviations
APC: Allophycocyanin; CRC: Colorectal cancer; CTC: Circulating tumor cell;
HD: Healthy donor; mCRC: metastatic colorectal cancer; PE: Phycoerythrin;
WGA: Whole-genome amplification
Acknowledgements
We thank Ms. Sayaka Kinoshita, Mr. Takeshi Watabe, Ms. Ayano Kanazawa, Mr.
Masatoshi Mori and Mr. Gen Fujii for excellent technical assistance. We thank
Kondo et al. BMC Cancer (2017) 17:311
Mr. Hajime Sugisaki, Ms. Hiroko Higashimoto, and Mr. Masao Oomura for
helpful scientific discussions.
Funding
No funding was provided for this research.
Availability of data and materials
The datasets supporting the conclusions of this article are available from the
corresponding author on reasonable request.
Page 9 of 10
9.
10.
11.
12.
Authors’ contributions
YK, HH, KH, KK and MY designed the study. YK, KK and KH contributed
patient samples. HH and YM developed the technology of the single-cell
picking system. YK and YM performed experiments and analyzed the
sequencing assays. YK drafted the manuscript. All authors have read and
approved the final manuscript.
13.
14.
Competing interests
All authors report that they have no competing interest associated with
this study.
15.
Consent for publication
All participants in this study gave us written informed consent for
publication of their clinical details.
17.
Ethics approval and consent to participate
This study was approved by the ethical committee of Tokyo Women’s
Medical University (approval number, 247) and all patients provided written
informed consent prior to participation in the study.
18.
16.
19.
Publisher’s Note
Springer Nature remains neutral with regard to jurisdictional claims in
published maps and institutional affiliations.
Author details
1
Department of Chemotherapy and Palliative Care, Tokyo Women’s Medical
University, 8-1 Kawada-chyo, Shinjuku-ku, Tokyo 162-8666, Japan. 2Research &
Development Department, SRL, Inc., Shinjuku, Japan. 3Department of Surgery,
Institute of Gastroenterology, Tokyo Women’s Medical University, Shinjuku,
Japan.
20.
21.
22.
23.
Received: 2 March 2016 Accepted: 25 April 2017
References
1. Cunningham D, Humblet Y, Siena S, Khayat D, Bleiberg H, Santoro A, et al.
Cetuximab monotherapy and cetuximab plus irinotecan in irinotecanrefractory metastatic colorectal cancer. N Engl J Med. 2004;351:337–45.
2. Van Cutsem E, Peeters M, Siena S, Humblet Y, Hendlisz A, Neyns B, et al.
Open-label phase III trial of panitumumab plus best supportive care
compared with best supportive care alone in patients with chemotherapyrefractory metastatic colorectal cancer. J Clin Oncol. 2007;25:1658–64.
3. Barault L, Veyrie N, Jooste V, Lecorre D, Chapusot C, Ferraz JM, et al.
Mutations in the RAS-MAPK, PI(3)K (phosphatidylinositol-3-OH kinase)
signaling network correlate with poor survival in a population-based series
of colon cancers. Int J Cancer. 2008;122:2255–9.
4. Amado RG, Wolf M, Peeters M, Van Cutsem E, Siena S, Freeman DJ, et al.
Wild-type KRAS is required for panitumumab efficacy in patients with
metastatic colorectal cancer. J Clin Oncol. 2008;26:1626–34.
5. Dupont Jensen J, Laenkholm AV, Knoop A, Ewertz M, Bandaru R, Liu W,
et al. PIK3CA mutations may be discordant between primary and
corresponding metastatic. Clin Cancer Res. 2011;17:667–77.
6. Watanabe T, Kobunai T, Yamamoto Y, Matsuda K, Ishihara S, Nozawa K, et al.
Heterogeneity of KRAS status may explain the subset of discordant KRAS
status between primary and metastatic colorectal cancer. Dis Colon Rectum.
2011;54:1170–8.
7. Gerlinger M, Rowan AJ, Horswell S, Larkin J, Endesfelder D, Gronroos E, et al.
Intratumor heterogeneity and branched evolution revealed by multiregion
sequencing. N Engl J Med. 2012;366:883–92.
8. Fisher R, Pusztai L, Swanton C. Cancer heterogeneity: implications for
targeted therapeutics. Br J Cancer. 2013;108:479–85.
24.
25.
26.
27.
28.
29.
30.
31.
32.
Yen LC, Yeh YS, Chen CW, Wang HM, Tsai HL, Lu CY, et al. Detection of
KRAS oncogene in peripheral blood as a predictor of the response to
cetuximab plus chemotherapy in patients with metastatic colorectal cancer.
Clin Cancer Res. 2009;15:4508–13.
Buim ME, Fanelli MF, Souza VS, Romero J, Abdallah EA, Mello CA, et al.
Detection of KRAS mutations in circulating tumor cells from patients with
metastatic colorectal cancer. Cancer Biol Ther. 2015;16:1289–95.
Marusyk A, Almendro V, Polyak K. Intra-tumour heterogeneity: a looking
glass for cancer? Nat Rev Cancer. 2012;12:323–34.
Alix-Panabières C, Pantel K. Circulating tumor cells: liquid biopsy of cancer.
Clin Chem. 2013;59:110–8.
Cristofanilli M, Budd GT, Ellis MJ, Stopeck A, Matera J, Miller MC, et al.
Circulating tumor cells, disease progression, and survival in metastatic
breast cancer. N Engl J Med. 2004;351:781–91.
Cristofanilli M, Hayes DF, Budd GT, Ellis MJ, Stopeck A, Reuben JM, et al.
Circulating tumor cells: a novel prognostic factor for newly diagnosed
metastatic breast cancer. J Clin Oncol. 2005;23:1420–30.
Allen JE, El-Deiry WS. Circulating tumor cells and colorectal cancer. Curr
Colorectal Cancer Rep. 2010;6:212–20.
Danila DC, Fleisher M, Scher H. Circulating tumor cells as biomarkers in
prostate cancer. Clin Cancer Res. 2011;17:3903–12.
Goldkorn A, Ely B, Quinn DI, Tangen CM, Fink LM, Xu T, et al. Circulating
tumor cell counts are prognostic of overall survival in SWOG S0421: a phase
III trial of docetaxel with or without atrasentan for metastatic castrationresistant prostate cancer. J Clin Oncol. 2014;32:1136–42.
Hayes DF, Cristofanilli M, Budd GT, Ellis MJ, Stopeck A, Miller MC, et al.
Circulating tumor cells at each follow-up time point during therapy of
metastatic breast cancer patients predict progression-free and overall
survival. Clin Cancer Res. 2006;12:4218–24.
Liu MC, Shields PG, Warren RD, Cohen P, Wilkinson M, Ottaviano YL, et al.
Circulating tumor cells: a useful predictor of treatment efficacy in metastatic
breast cancer. J Clin Oncol. 2009;27:5153–9.
Huang X, Gao P, Song Y, Sun J, Chen X, Zhao J, et al. Relationship between
circulating tumor cells and tumor response in colorectal cancer patients
treated with chemotherapy: a meta-analysis. BMC Cancer. 2014;14:976.
Pantel K, Alix-Panabières C. Circulating tumour cells in cancer patients:
challenges and perspectives. Trends Mol Med. 2010;16:398–406.
Heitzer E, Auer M, Gasch C, Pichler M, Ulz P, Hoffmann EM, et al. Complex
tumor genomes inferred from single circulating tumor cells by array-CGH
and next-generation sequencing. Cancer Res. 2013;73:2965–75.
Pestrin M, Salvianti F, Galardi F, De Luca F, Turner N, Malorni L, et al.
Heterogeneity of PIK3CA mutational status at the single cell level in
circulating tumor cells from metastatic breast cancer patients. Mol
Oncol. 2015;9:749–57.
Yoshimoto N, Kida A, Jie X, Kurokawa M, Iijima M, Niimi T, et al. An automated
system for high-throughput single cell-based breeding. Sci Rep. 2013;3:1191.
Sutterlin M, Sleiman PA, Onadim Z, Delhanty J. Single cell detection of
inherited retinoblastoma predisposition. Prenat Diagn. 1999;19:1231–6.
Peeters DJ, De Laere B, Van den Eynden GG, Van Laere SJ, Rothé F,
Ignatiadis M, et al. Semiautomated isolation and molecular characterisation
of single or highly purified tumour cells from CellSearch enriched blood
samples using dielectrophoretic cell sorting. Br J Cancer. 2013;108:1358–67.
Francesco F, Silvia C, Wainer Z, Paola U, Giluia G, et al. Detection and
recovery of circulating colon cancer cells using a dielectrophoresis-based
device: KRAS mutation status in pure CTCs. Cancer Lett. 2013;335:225–31.
Li Z, Jin K, Lan H, Teng L. Heterogeneity in primary colorectal cancer and its
corresponding metastases: a potential reason of EGFR-targeted therapy
failure? Hepato-Gastroenterology. 2011;58:411–6.
Mao C, Wu XY, Yang ZY, Threapleton DE, Yuan JQ, Yu YY, et al. Concordant
analysis of KRAS, BRAF, PIK3CA mutations, and PTEN expression between
primary colorectal cancer and matched metastases. Sci Rep. 2015;5:8065.
Gasch C, Bauernhofer T, Pichler M, Langer-Freitag S, Reeh M, Seifert AM,
et al. Heterogeneity of epidermal growth factor receptor status and
mutations of KRAS/PIK3CA in circulating tumor cells of patients with
colorectal cancer. Clin Chem. 2013;59:252–60.
Lyberopoulou A, Aravantinos G, Efstathopoulos EP, Nikiteas N, Bouziotis P,
Isaakidou A, et al. Mutational analysis of circulating tumor cells from
colorectal cancer patients and correlation with primary tumor tissue. PLoS
One. 2015;10:e0123902.
Mostert B, Jiang Y, Sieuwerts AM, Wang H, Bolt-de Vries J, Biermann K, et al.
KRAS and BRAF mutation status in circulating colorectal tumor cells and
Kondo et al. BMC Cancer (2017) 17:311
Page 10 of 10
their correlation with primary and metastatic tumor tissue. Int J Cancer.
2013;133:130–41.
33. Polzer B, Medoro G, Pasch S, Fontana F, Zorzino L, Pestka A, et al. Molecular
profiling of single circulating tumor cells with diagnostic intention. EMBO
Mol Med. 2014;6:1371–86.
34. Deng G, Krishnakumar S, Powell AA, Zhang H, Mindrinos MN, Telli ML, et al.
Single cell mutational analysis of PIK3CA in circulating tumor cells and
metastases in breast cancer reveals heterogeneity, discordance, and
mutation persistence in cultured disseminated tumor cells from bone
marrow. BMC Cancer. 2014;14:456.
35. Powell AA, Talasaz AH, Zhang H, Coram MA, Reddy A, Deng G, et al. Single
cell profiling of circulating tumor cells: transcriptional heterogeneity and
diversity from breast cancer cell lines. PLoS One. 2012;7:e33788.
Submit your next manuscript to BioMed Central
and we will help you at every step:
• We accept pre-submission inquiries
• Our selector tool helps you to find the most relevant journal
• We provide round the clock customer support
• Convenient online submission
• Thorough peer review
• Inclusion in PubMed and all major indexing services
• Maximum visibility for your research
Submit your manuscript at
www.biomedcentral.com/submit