LV Thạc sỹ_Financial statements analysis in Haratour company
Bạn đang xem bản rút gọn của tài liệu. Xem và tải ngay bản đầy đủ của tài liệu tại đây (323.83 KB, 70 trang )
1
Table of Contents
ABBREVIATION
COGS:
Cost of Goods Sold
SG&A:
Selling, General & Administrative
R&D:
Research & Development
EBITDA:
Earnings before Interest, Taxes, Depreciation & Amortization
D&A:
Depreciation & Amortization
EBIT:
Earnings before Interest & Taxes
EPS:
Earnings per Share
CFS:
Cash flow statement
ROA:
Return on assets
ROE:
Return on common Equity
BEP:
Basic Earning Power
DSO:
Days Sales outstanding
2
TIE:
Times-Interest-Earn
P/E:
Price/ Earnings
LIST OF TABLES
LIST OF FIGURES
3
CHAPTER 1: INTRODUCTION
1.1.
Rationale
In recent years, Vietnam has constantly collaborated with many countries all over the
world and has achieved strong growth in all aspects such as economy, politics, culture,
etc. In the situation of globalization, enterprises are treated equally and "Strong wins,
weak loses" is the inevitable law of this dog-eat-dog world. It is not only opportunities
but also full of challenges. The harsh rejection requires Vietnamese enterprises to
carefully considered in each step, each element affects its competitiveness and Financial
is the most important issue.
As we already know, finance decides the existence, development and downfall of the
business. Therefore, it is necessary to understand and analyze the strengths to promote
the financial and promptly detect weaknesses to overcome and complete financial
situation at the enterprise. And, to assess the real ability as well as the financial situation
of the company, analyzing financial statements is the most method. Because of the need
above, I choose my thesis topic is “Financial statements analysis in Haratour
company".
1.2.
Research objective
Analysis and evaluating the financial statements in order to find out the strengths and
weaknesses of company through some aspects:
•
Essential financial assessment
•
Analysis capital structure and financial situation to ensure capital for business
•
Analysis the situation of solvency of the company
•
Business efficiency analysis
•
Analysis financial ratios through financial statements of the company
4
•
Analysis the efficiency of using capital
•
Analysis the profitability of capital
From that point, proposing methods for financial management and the highest
efficiency of capital.
1.3.
Research questions
There are some main questions that should be answered in the thesis:
1.4.
•
Capital sources and capital structure are reasonable or not?
•
How is the efficiency of company’s business activities?
•
How is the solvency of the company?
•
What are the strengths and weaknesses of corporate finance?
Scope of research
•
Space: In this thesis, I focus on research and analysis of the financial situation
of Hanoi Railway Tourist Corporation. (Haratour)
•
Contents: Financial statements of Haratour company.
•
Time periods: The financial situation is one of the most important indicators to
evaluate the operations of the business. Correctly and fully evaluating requires
long process of research in all aspects of the company business. But, because
of the limited time practice at HARATOUR so I can only reflect the general
5
financial situation of the company through the financial reports from 2010 to
2012.
1.5.
Research contributions
Finance is one of the most important issues of a company and like the company's
lifeblood. In order to assess the financial situation and the possibility of a company's
business, the most quick and accurate way is analyzing the financial statements. Many
recent studies also research on this issue, but only at the macro level and not sticking with
the actual business. In addition, conclusions in the previous studies are just for reference
and be difficult to apply in practice for specific business. In this study, I go into the actual
situation analysis of one company to make specific findings as well as providing
orientation to other businesses in the same industry.
In addition, this thesis also searches knowledge about financial statements analysis
from a variety of sources and restructures them. To which help the reader obtain general
knowledge and deeper views on this issue.
1.6.
Structure of the research
I divided the thesis into 5 main sections:
•
Chapter 1: Give introductions about the thesis
•
Chapter 2: Give some general financial knowledge (financial statements,
financial statement analysis, financial ratios, etc) to the readers.
•
Chapter 3: Introduce HARATOUR and analyze their financial statements.
•
Chapter 4: After analyzing financial statements, in this part, I release some
discussions and key findings about financial situation of the company
6
•
Chapter 5: Recommendations for the company and conclusion.
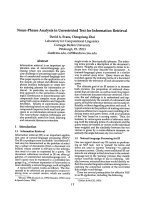
CHAPTER 2: THEORETICAL FRAMEWORK OF FINANCIAL
STATEMENTS ANALYSIS
2.1.
The concept of financial statement analysis
Financial statement analysis is the process of understanding the risk and profitability
of a firm (business, sub-business or project) through analysis of reported financial
information, by using different accounting tools and techniques.
The process of financial statement analysis is intended to help investors and analysts
to deeply understand a firm’s profitability and risk and to use that information to forecast
future profitability and risk. From that point, ultimately value the firm and make
intelligent investment decisions. This process lies at the heart of the role of accounting,
financial reporting, capital markets, investment, portfolio management and corporate
management in the world economy. When conducted with care and integrity, thorough
and thoughtful financial statement analysis is a fascinating and potentially rewarding
activity that can create tremendous value for society. However, as the recent financial
crises in our capital markets reveal, when financial statement analysis and valuation is
conducted carelessly and without integrity, it can create enormous loss of value in our
capital markets and trigger deep recession in even the most powerful economies in the
world.
7
2.2.
2.2.1.
Introduce financial statements
Balance sheet
The balance sheet is a “snapshot” of a firm’s position at a specific point in time. It
reports the company’s resources (assets) and how those resources were funded (liabilities
and shareholders’ equity) on a particular date (end of quarter or fiscal year). Figure 1
below show the layout of a typical balance sheet. The left side of the statement shows the
assets that the company owns, while the right side shows the firm’s liabilities and
stockholders’ equity, which are claims against the firm’s asset
Figure 1: A Typical Balance Sheet
Current Assets
Cash and equivalents
Accounts receivable inventory
Long-term (Fixed) Assets
Net plant and equipment
Other long-term assets
Current Liabilities
Accrued wages and taxes
Accounts payable
Notes payable
Long – term debt
Stockholders’ equity
Common stock + Retained
earning must equal
Total assets – Total liabilities
Total Assets
Total Liabilities and Equity
8
2.2.2.
Income statement
Income statement is a report summarizing a firm’s revenues, expenses and profits
during a reporting period, generally a quarter or a year. It facilitates the analysis of a
company’s growth prospects, cost structure, and profitability. Readers can use the income
statement to identify the components and sources of profit. The table 1 below shows
major components of a typical income statement.
Table 1: Major components of a typical income statement
Net Revenues
Total dollar payment for goods and services that are
credited to an income statement over a particular time
Cost of Goods Sold (COGS)
period.
COGS represents a company’s direct cost of manufacture
(for manufacturers) or procurement (for merchandisers) of
Gross Profit
Selling, General &
a good or service that sells to generate revenue.
Revenue – Cost of Goods Sold
Operating costs not directly associated with the
Administrative
production or procurement of the product or service that
(SG&A)
the company sells to generate revenue. Payroll, wages,
commissions, meal and travel expenses, stationery,
advertising, and marketing expenses fall under this line
Research & Development
item.
A company’s activities that are directed at developing new
(R&D)
Earnings before Interest,
products or procedures.
Gross Profit – SG&A – R&D. EBITDA is a popular
Taxes, Depreciation &
measure of a company’s financial performance
Amortization (EBITDA)
9
Depreciation &
The allocation of cost over a fixed asset’s useful life in
Amortization (D&A)
order to match the timing of the cost of the asset to its
Other Operating Expenses/
expected revenue generation.
Any operating expenses not allocated to COGS, SG&A,
Income
Earnings before Interest &
R&D, D&A.
EBITDA – D&A
Taxes (EBIT)
Interest Expense
Interest expense is the amount the company has to pay on
debt owed. This could be to bondholders or to banks.
Interest expense subtracted from EBIT equals earnings
Interest Income
before taxes (EBT).
A company’s income from its cash holding and
Unusual or Infrequent
investments (stocks, bonds, and savings accounts).
Gain (loss) on sale of assets, disposal of a business
Income / Expenses
segment, impairment charge, write-offs, restructuring
Income Tax Expense
costs.
The tax liability a company reports on the income
Net income
statement.
EBIT – Net Interest Expense – Other Non-operating
Basic Earnings per Share
Income – Taxes
Net income / Basic Weighted Average Shares Outstanding
(EPS)
Diluted EPS
Net income / Diluted Weighted Average Shares
Outstanding
2.2.3.
Statement of cash flow
Statement of cash flow is a report that shows how things that affect the balance sheet
and income statement affect the firm’s cash flow. Unlike the income statement, whose
primary purpose is to present a company’s operating performance, the major purpose of
the cash flow statement is to present the movement of cash.
10
The cash flow statement (CFS) has become increasingly important for the purpose of
financial analysis because the income statement and balance sheet can be manipulated
through the use of different accounting methods and assumptions, while a company’s
uses and sources of cash are objectively recorded when cash is paid and received,
respectively.
Cash inflows/ outflows are segregated into three major categories in the CFS:
•
Cash Flow from Operating Activities
o
Tracks cash generated in the course of a company’s day-to-day
operations.
o
These cash flows typically track the cash impact of changes in current
assets and current liabilities.
•
Cash Flow from Investing Activities
o
Tracks additions and reductions to fixed assets and monetary
investments during the year.
o
These cash flows typically track the impact of changes in long-term
assets.
•
Cash Flow from Financing Activities
o
Tracks changes in the company’s sources of debt and equity financing.
o
These cash flows typically track the impact of changes in debt and
shareholder’s equity.
11
2.3.
Introduce financial ratios
Financial ratio analysis utilizes ratios and relationships between various financial
statement accounts as basic tools to compare operational, financial, and investing
performance of companies over time and against one another.
Ratios are often classified into five categories:
Category
Liquidity
Ratios
Purpose
Debt
Market
Ratios
management
management
value ratios
Measure of
Measure of a
ratios
Measure of
ratios
Measure of a
Measure of
a firm’s
firm’s
efficiency of
firm’s ability
what
short-term
profitability
a firm’s assets
to repay its
investors
ability to
relative to its
debt
think about
meet its
assets and to
obligations
the firm and
current
its revenue
obligations
2.3.1.
RATIO ANALYSIS
Profitability
Asset
its future
prospects
Liquidity ratios
The liquidity ratios help answer this question: Will the firm be able to pay off its debts
as they come due and thus remain a viable organization? If the answer is no, liquidity
must be the first order of business. Three of the most commonly used liquidity ratios are
discussed below:
•
Current ratio
Current ratio =
The current ratio compares a company’s current assets to current liabilities and
measures its ability to cover short-term (maturing) obligation. Current assets include
12
cash, marketable security, accounts receivable and inventories. Current liabilities consist
of accounts payable, accrued wages, taxes and short-term payable to its banks.
•
Quick (acid) ratio
Quick (acid) ratio =
This is similar to the current ratio, with the only exception of netting out inventories
from current assets. Inventories are typically the least liquid of a firm’s current assets;
and if sales slow down, they might not be converted to cash as quickly as expected. Also,
inventories are the assets on which losses are most likely to occur in the event of
liquidation. Therefore, the quick ratio which measures the firm’s ability to pay off shortterm obligations without relying on the sale of inventories is important.
2.3.2.
Profitability ratios
Profitability ratios measure a firm’s ability to generate profits. There are number of
common profitability ratios, including:
•
Gross Profit margin
Gross profit margin =
Gross profit margin is a measure of how efficiently a company converts its cost of
goods sold into sales. The gross profit margin is not an exact estimate of the company's
13
pricing strategy but it does give a good indication of financial health. Without an
adequate gross margin, a company will be unable to pay its operating and other expenses
and build for the future. In general, a company's gross profit margin should be stable. It
should not fluctuate much from one period to another, unless the industry it is in has been
undergoing drastic changes which will affect the costs of goods sold or pricing policies.
•
Profit margin
Profit margin =
Profit margin ratio measures a company’s efficiency in converting sales into net
income. Or, it measures how much out of every dollar of sales a company actually keeps
in earnings. Looking at the earnings of a company often doesn't tell the entire story.
Increased earnings are good, but an increase does not mean that the profit margin of a
company is improving. For instance, if a company has costs that have increased at a
greater rate than sales, it leads to a lower profit margin. This is an indication that costs
need to be under better control.
•
Operating margin
Operating margin =
This ratio measures operating income per dollar of sales. Operating margin gives
analysts an idea of how much a company makes (before interest and taxes) on each dollar
of sales. When looking at operating margin to determine the quality of a company, it is
14
best to look at the change in operating margin over time and to compare the company's
yearly or quarterly figures to those of its competitors. If a company's margin is
increasing, it is earning more per dollar of sales. The higher the margin is the better.
•
Return on assets
Return on assets (ROA) =
Return on assets measures the efficiency with which a company is utilizing its assets
to generate net income. ROA tells you what earnings were generated from invested
capital (assets). ROA for public companies can vary substantially and will be highly
dependent on the industry. This is why when using ROA as a comparative measure, it is
best to compare it against a company's previous ROA numbers or the ROA of a similar
company.
•
Return on common equity
Return on common equity (ROE) =
Return on common equity measures the profits generated for each dollar of equity
investment. Stockholders expect to earn a return on their money, and this ratio tells how
well they are doing in an accounting sense. The ROE is useful for comparing the
profitability of a company to that of other firms in the same industry.
•
Basic Earning Power ratio (BEP)
15
Basic Earning Power ratio (BEP) =
This ratio shows the raw earning power of the firm’s assets before the influence of
taxes and debt, and it is useful when comparing firms with different debt and tax
situations.
•
Earnings per share
Earnings per share =
Earnings per share is a popular profitability ratio, measuring the portion of a
company’s earnings allocated outstanding share of common stock. Earnings per share is
generally considered to be the single most important variable in determining a share's
price. It is also a major component used to calculate the price-to-earnings valuation ratio.
•
Payout ratio
Payout ratio =
Payout ratio indicates the percentage of earnings distributed to shareholders in the
form of dividends. A very low payout ratio indicates that a company is primarily focused
on retaining its earnings rather than paying out dividends. The payout ratio also indicates
how well earnings support the dividend payments: the lower the ratio, the more secure
the dividend because smaller dividends are easier to pay out than larger dividends.
16
2.3.3.
Asset Management ratios
The asset management ratios measure how effectively the firm is managing its assets.
These ratio answer this question: Does the amount of each type of asset seem reasonable,
too high, or too low in view of current and projected sales? These ratios are important
because when company acquires assets, they must obtain capital from banks or other
sources and capital is expensive. Therefore, if company has too much assets, its cost of
capital will be too high, which will depress its profits. On the other hand, if its assets are
too low, profitable sales will be lost. So company must strike a balance between too many
and too few assets, and the asset management ratios will help it strike this proper balance.
Common asset management ratios include:
•
Inventory turnover ratio
Inventory turnover ratio =
Inventory turnover ratio shows how many times the particular asset is “turned over”
during the year. However, it may also be calculated as:
Inventory turnover ratio =
Although the first calculation is more frequently used, COGS (cost of goods sold)
may be substituted because sales are recorded at market value, while inventories are
usually recorded at cost. Also, average inventory may be used instead of the ending
inventory level to minimize seasonal factors.
17
•
Receivables turnover ratio
Receivable turnover =
The receivables turnover ratio measures a company’s efficiency in managing and
collecting its accounts receivable. By maintaining accounts receivable, firms are
indirectly extending interest-free loans to their clients. A high ratio implies either that a
company operates on a cash basis or that its extension of credit and collection of accounts
receivable is efficient. A low ratio implies the company should re-assess its credit policies
in order to ensure the timely collection of imparted credit that is not earning interest for
the firm.
•
Days Sales outstanding
Days Sales outstanding (DSO) =
The Days Sales outstanding represents the average length of time the firm must wait
after making a sale before receiving cash. Due to the high importance of cash in running
a business, it is in a company's best interest to collect outstanding receivables as quickly
as possible. By quickly turning sales into cash, a company has the chance to put the cash
to use again - ideally, to reinvest and make more sales. The DSO can be used to
determine whether a company is trying to disguise weak sales, or is generally being
ineffective at bringing money in. For most businesses, DSO is looked at either quarterly
or annually.
18
•
Fixed assets turnover ratio
Fixed assets turnover ratio =
The fixed-asset turnover ratio measures a company's ability to generate net sales from
fixed-asset investments - specifically property, plant and equipment (PP&E) - net of
depreciation. A higher fixed-asset turnover ratio shows that the company has been more
effective in using the investment in fixed assets to generate revenues.
•
Total assets turnover ratio
Total assets turnover ratio =
Asset turnover measures a firm's efficiency at using its assets in generating sales or
revenue - the higher the number the better. It also indicates pricing strategy: companies
with low profit margins tend to have high asset turnover, while those with high profit
margins have low asset turnover.
2.3.4.
Debt management ratios
Debt management ratio measures a firm’s cash-generating ability to meet its debt and
other obligations. It includes:
•
Total debt to total assets
Total debt to total assets =
19
Total debt to total assets ratio measures the percentage of total assets provided by
creditors. Total debt includes all current liabilities and long-term debt. Creditors prefer
low debt ratios because the lower the ratio, the greater the cushion against creditors’
losses in the event of liquidation. Stockholders, on the other hand, may want more
leverage because it can magnify expected earnings.
•
Times-Interest-Earn ratio
Times-Interest-Earn ratio (TIE) =
Times-Interest-Earn ratio measures a company's ability to meet its debt obligations. It
is calculated by taking a company's earnings before interest and taxes (EBIT) and
dividing it by the total interest payable on bonds and other contractual debt. It is usually
quoted as a ratio and indicates how many times a company can cover its interest charges
on a pretax basis. Failing to meet these obligations could force a company into
bankruptcy.
•
Current cash debt coverage ratio
Current cash debt coverage ratio =
Comparing cash from operating activities to current liabilities, the current cash debt
coverage ratio measures a company’s ability to pay off its current liabilities with cash
from operations.
20
If the current ratio and quick test are low, this ratio indicates if a company can rely on
its cash from operating activities to cover any shortfall when paying off its current
liabilities.
2.3.5.
Market value ratios
Market value ratios give management an idea of what the firm's investors think of the
firm's performance and future prospects. Market value ratios are pertinent to the publicly
traded firm. If the rest of the company's ratios are good, then the market value ratios
should reflect that and the stock price of the firm should be high. Market value ratios
measure different ways of looking at the relative value of a company's stock.
•
Price/Earnings ratio
Price/ Earnings ratio (P/E) =
The Price/ Earnings ratio is a measure of the quality of a company’s earning, that is,
how much investors will pay per dollar of earnings. In general, a high P/E suggests that
investors are expecting higher earnings growth in the future compared to companies with
a lower P/E. However, the P/E ratio doesn't tell us the whole story by itself. It's usually
more useful to compare the P/E ratios of one company to other companies in the same
industry, to the market in general or against the company's own historical P/E. It would
not be useful for investors using the P/E ratio as a basis for their investment to compare
the P/E of a technology company (high P/E) to a utility company (low P/E) as each
industry has much different growth prospects.
21
•
Market/Book ratio
Market/ Book ratio =
The ratio of a stock’s market price to its book value gives another indication of how
investors regard the company. The book-to-market ratio attempts to identify undervalued
or overvalued securities by taking the book value and dividing it by market value. In
basic terms, if the ratio is above 1 then the stock is undervalued; if it is less than 1, the
stock is overvalued.
CHAPTER 3: ANALYSIS FINANCIAL STATEMENTS OF
HARATOUR
3.1.
INTRODUCE ABOUT HARATOUR
3.1.1.
General introduction
HARATOUR (Hanoi Railway Tourist Corporation) which is formerly known as
Travel Services Hanoi Railway is a member of Vietnam Railway Corporation.
The company was established according to Decision 3744/QD-BGTVT December
7, 2004 of the Ministry of Transport on the transformation of the State Enterprise (Travel
22
Services Hanoi Railway, a member unit of the Vietnam Railway Corporation) into a Joint
Stock company.
April 1st, 2005, the Business Registration Office issued a Certificate of Business
Registration number 0103007241 to HARATOUR with the business in:
•
Sales in domestic travel, international travel, and services for tourists
•
Commercial business in beer, soft drinks, cigarettes, food technology, industrial
products, garments, machinery and equipment
•
Manufacture of paper labels and packaging
•
Buying and selling lubricants clean engine
•
Purchase and sale of other fuels used in the engine
•
Business in hotel services and restaurants
•
Supported activities in freight and passenger transport
•
Manufacture of beverages
•
Business in real estate
•
Recreation and sport services
3.1.2.
Organizational structure
Figure 2: Organizational structure of HARATOUR
3.1.2.
Gene
Board
of Directors
General Manager
International
market
Research
and development
Department
Local
Vice
travel
– Manager
Department
1
Department
Foreign
Operating
Personnel
Vicetravel
– Manager
Department
Department
2
Accounting
Ticket
Vice –Department
Manager
Department
3
23
To improve the efficiency of business, the company's management structure is
arranged to management functions model. Functions and duties of each members of the
company as follows:
• General Manager
o
Managing any business activities of the company and be responsible for the
company's operations
o
Establish policies and objectives for the company and create the conditions to
operate them
o
Managing meetings of the company, signed the relevant documents
24
o
Assign tasks to the vice-managers and chiefs of department
o
Monitoring and inspection activities within the company
• Vice-managers
o
Vice-manager 1: Advising the manager in business management. Managing
directly some departments as assigned by manager such as: local department,
research and development department, international market department. Be
entitled to sign some documents in the assigned function. Be responsible for his
decision.
o
Vice-manager 2: Responsible for operating activities in the field of
administrative organization, personnel and training. Managing directly some
departments as assigned by manager such as: operating department, personnel
department, foreign travel department. Summary all report on markets, wages
and personnel. Be entitled to sign some documents in the assigned function. Be
responsible for his decision.
o
Vice-manager 3: Managing directly some departments as assigned by manager
such as: accounting department and ticket department. Be entitled to sign some
documents in the assigned function. Be responsible for his decision.
• Local travel Department
o
Function: Responsible for domestic tourism market.
o
Assignment: Implement monthly plan. Organizing and implementing programs
for Vietnam tourism or foreigners living and working in Vietnam to travel
25
around country. Organizing tourism programs combines with seminars
conference in the country.
• Research and development Department
o
Function: To advise the manager about planning markets options and the
improvement of services to suit the market demand.
o
Assignment: Research market in the country and abroad; build and manage
information systems, intranets; building and manage the content of Websites;
take responsibility about advertisement and public relations.
• International market Department
o
Function: Executive management of all activities of the international market.
o
Assignment: Perform tasks as planned. Find customers resources, sells tour
programs, travel service for abroad tourists come to Vietnam and travel
programs connected to other countries
• Operating Department
o
Function: Managing tour operator activities, management guides, transport
services
o
Assignment: Organizing tourism programs in accordance with the tour schedule
sent by departments; ensuring the best quality and service as required by
customers and contracts with service providers. Providing guides for the related
departments to serve the tourists.
• Personnel Department
o
Function: To advise the manager of the organization about staff, training,
recruitment, human resource arrangement and settle policies for employees