Wellbeing inequality in a developing country: from theory to practice
Bạn đang xem bản rút gọn của tài liệu. Xem và tải ngay bản đầy đủ của tài liệu tại đây (695.6 KB, 26 trang )
38 | ICUEH2017
Wellbeing inequality in a developing country:
From theory to practice
PHAN VAN PHUC
University of Wollongong, Australia
Can Tho University –
MARTIN O’BRIEN
University of Wollongong, Australia –
SILVIA MENDOLIA
University of Wollongong, Australia –
Abstract
The emergence of multiple concept of wellbeing that can be quantified has allowed
researchers to move beyond a narrow focus on income and consumption as a primary measure
of inequality and poverty. Although analyses of multidimensional wellbeing are increasingly
feasible due to the availability of data, the consumption or income is still applied in a number of
studies. As a result, the literature on wellbeing remains deficient in two main ways: (1) the use
of inappropriate proxies for wellbeing, and (2) ignorance of the interdependency between
dimensions of wellbeing. This paper develops a fundamental framework and applies a principal
component analysis method for a calculation of the wellbeing level and wellbeing inequality in
Vietnam. Our results show that not only the level, but also inequality, of wellbeing increased in
the period 1993–1998 and 2002–2008. This challenges the consensus of a moderate level, and
stability in, wellbeing inequality using income proxied measures. We argue that empirical
studies of wellbeing need to incorporate multiple dimensions in addition to dimensional
interdependency characteristic and thus, implementation in the wellbeing analyses of wellbeing
using principal component analysis can obtain the unique results of the level and inequality of
wellbeing.
Keywords: inequality; principal component analysis; Vietnam; household wellbeing.
Phan Van Phuc et. al. | 39
1. Introduction
The concept of inequality has been extended in relation to multiple dimensions of
wellbeing. The rhetoric question ‘equality of what?’, raised by Sen (1980), requests a
comprehensive examination of the facets of, and proxies used for measures of,
inequality. The income-proxied approach derived from the utility comparison becomes
unbearable in terms of drawing a complete picture of interpersonal wellbeing
differences (Sen 1997). Although perception of wellbeing varies among different
contexts as it depends on social norms and values, the domains of wellbeing go beyond
income dimension. This idea is traced back to Sen (1985a)’s capability approach that
emphasizes not only what people have, but also the extent to which they are free to do
and to be.
A general perception of wellbeing is anything making a good life (Deaton 2013, p.24)
despite no consensus on the concept of wellbeing has been reached; differences in
wellbeing achievements needs an assessment of ‘wellness’ of people’s state of being (Sen
2003b, p.36). In developed countries, a plethora of studies focus on wellbeing
achievements or outcomes with a range of indicators including, but not limited to,
income and wealth, health and feeling, education and social engagement (Deaton 2013,
p.24). For instance, OECD (2013) chooses eleven indicators which represents plausible
dimensions of wellbeing which specifies the eight components suggested in Stiglitz et al.
(2009). In developing countries, however, it is insufficiently concerned with research in
wellbeing and inequality in wellbeing (Cho 2015).
Although data availability for assessments of inequality in wellbeing has emerged,
serious problems with empirical analyses remains. First, one-indicator proxy leads to a
distorted picture of wellbeing which comprises a variety of factors. For instance,
Vietnam shows confusing levels of inequality with income and expenditure indicators
which are equally accepted as proxies for wellbeing (Zhuang et al. 2014). In 2008, there
was a significant gap between the Gini coefficient of income (0.44) and that of
expenditure (0.36).
Additionally, the development of measures of inequality in multiple dimensions
disentangles the ambiguities of single indicator-proxied method. Rather, it further
provides confusing and inconclusive results corresponding to varying choices of
parameters used and the sequence of aggregation across dimensions in the estimations
40 | ICUEH2017
of inequality (e.g. inequality aversion), even with the same methods and datasets (e.g.
Nilsson 2010, Justino 2012).
Finally, the assumption of non-interdependencies between variables is also violated
as there is plausible evidence of interrelations between economic, education and health
indicators. Russian data, for example, reveals a complexity of interrelations across
dimensions. Decancq and Lugo (2012) found that this correlation structure changed
remarkably in the examined period (1995–2005). Unfortunately, they could not
scrutinise thus far because of the paucity of data which is common in the majority of
countries. Therefore, the extent to which the indicator weights in a computation of
inequality have not been thoroughly examined. A postulation of equal variable weight
is, however, inconsistent with the fact that variables may have unequal influences on
wellbeing, and thus on the level of overall inequality.
To fill these deficiencies, this paper develops the analytical framework based on Sen’s
capability approach and applies the polychoric principal component analysis (PCA) to
Vietnamese data. In doing so, this research contributes to the literature on wellbeing
inequality in two main ways. First, it extends the analysis of wellbeing by including the
various wellbeing components. We consider the contribution of non-economic
dimensions and the interactions of all indicators to an overall trend in multidimensional
inequality. Furthermore, we compare wellbeing inequality trends over time and across
different geographical areas.
The remainder of the paper proceeds as follows. The next section discusses the
capability approach. The methodology, data and variables are described in Section 3.
Section 4 compares the wellbeing index construction based on the polychoric PCA to the
income-proxied wellbeing. Section 5 analyses inequality in wellbeing. The conclusive
part investigates further steps to identify major causes of inequality.
2. The capability approach
Capability indicates the individual ability to obtain real achievements in relation to
external and internal conditions that influence personal transforming from commodity
possession to personal wellbeing (Sen 1985b). Despite economic dimension is an
important contributor to wellbeing, it could not capture all determinants of quality of
life that people are able to do or live in their favoured ways.
Phan Van Phuc et. al. | 41
Sen (1985b) introduces his own approach to make the individual wellbeing
comparable through a relationship between the two core concepts: ‘capability’ and
‘functioning’. This correlation is addressed by a simple equation which is slightly
modified by Kuklys and Robeyns (2006) as follows:
Qi(Xi) = [bi|bi=fi(c(xi))|T(i,s,e) for several fi ϵ Fi, and several xi ϵ Xi]
(1)
where:
bi denotes individual i’s ‘being’; fi is a functioning and belongs to Fi (vectors of
individual’s functionings);
c(xi) is a function of conversion from a vector of possession of commodities (xi) to
their characteristics, xi ϵ Xi (different sets of commodities); and
T is the transformation conditions comprising three components; these are
individual circumstances – Ti (e.g. sex, physical ability), social factors – Ts (e.g. public
policies) and environmental conditions – Te (such as environmental pollution, weather).
How ‘well’ of personal ‘being’ firstly depends on commodity ownerships and
individual functionings. Given a bundle of commodities (xi), different choices in Fi lead
to varieties in the wellbeing level (bi). This expression is called the personal capabilities
– Qi(Xi). Xi refers to all kinds of resources and is subject to the personal budget
constraint.
The capability approach is totally and directly operational with respect to freedom of
choices. Kuklys and Robeyns (2006) appreciate its extendable characteristic by adding
plausible functionings such as ‘being educated’ and/or ‘being employed’. Dang (2014)
supports a concentration on the achieved functionings which are more operational than
on a set of capabilities in the case of inadequate information on freedom conditions.
Despite difficulties of data collection relating to achieved capabilities or functionings,
in practice, the data and variable suitability and analytical methods associated with such
data should be thoroughly examined (Sen 2003a, p.53). Sen however does not provide
a specific discussion beyond that point, but he recommends a solution to choosing
dimensions, indicator weights, and calculation metric through a democratic public
decision. Wellbeing evaluations should consider with respect to social and historical
contexts (Jackson 2005, Qizilbash 2011).
42 | ICUEH2017
An important characteristic of the capability is its ‘incompleteness’ of a contribution
of functionings which lead to the wellbeing level (e.g. Sugden 1993). Alkire (2002b)
advocates that this incompleteness is not a shortcoming, but it opens for adaptations to
the cultural and personal circumstances. She also appreciates Sen’s capability that does
not dwell on a fixed subset of capabilities, but proxies for capabilities should be adjusted
in favour of research perspectives. ‘The capability approach can often yield definite
answers’ of the levels of individual wellbeing in such a case (Sen 2003a, p.46).
Finally, inequality should be assessed as a ‘failure of [and differences in] certain basic
capabilities’ (e.g. being nourished, being sheltered) respectively as income and
preference are not accurate measurements to comparing interpersonal wellbeing (Sen
1985a, 2006). There is nothing mathematically wrong with the measurements of
inequality derived from income, ‘but [to] interpret them as utility comparison…would
be a complete non sequitur1’(Sen 1997, p.392).
3. Methodology, data and variables
3.1.
The polychoric principal component analysis
We choose the polychoric PCA developed in Kolenikov and Angeles (2004, 2009) to
analyse wellbeing and inequality because this modified PCA is superior to its naïve
version. The standard PCA is originally constructed to handle non-discrete variables. An
application of PCA to the non-continuous data may have problems. First, if one breaks a
categorical variable into more than two dummies, PCA could create numerous spurious
correlations. Second, a transformation from ordinal variables to dummies cannot retain
the ordinal feature of indicators. More importantly, if categorical variables are treated
as continuous ones, a violation in the assumption of a normally distributed variable in
PCA occurs analogously to the case that discrete variables are used as independent
variables in OLS since discrete variables do not have a density but high skewness and
kurtosis (Kolenikov and Angeles 2004, 2009). The polychoric PCA minimises violation
of a normal distribution assumption when applied to discrete data. The polychoric PCA
can also assign various weights for different units and categories of indicators and
describe more precisely wellbeing inequality (Ward 2014).
1
non sequitur: ‘a statement that is not connected in a logical or clear way to anything said before it’ (Merriam-
Webster dictionary n.d.).
Phan Van Phuc et. al. | 43
Correlation coefficients in the polychoric PCA are described in the following steps.
First, two ordinal variables xi, xj indicate asset ownership, educational outcomes, or
health status. They are discretised in dk categories (k = 1…m), and dr categories (r =
1…n) respectively. Thus, the thresholds of xi, xj are denoted as τi,τj corresponding to dk,
dr. These axioms yield the following two equations:
xi = k iff dk-1 < τik
-∞ = τi0 < τi1 < τi2 <….< τi(k-1)< τik = +∞
-∞ = τj0 < τj1 < τj2 <….< τj(r-1)< τjr = +∞
These assumptions yield a (n x m) cross-tabulation data. Let us call the statistical
likelihood of observation falling into cell (k r) and the frequency from the (n x m) table
akr, fkj respectively. The likelihood for the sample is as follows:
𝐿 = 𝑎𝑘𝑟 𝑓𝑘𝑟
(2)
; hence,
𝑛
𝑙 = ln(𝐿) = ∑𝑚
𝑘=1 ∑𝑟=1 𝑓𝑘𝑟 ln( 𝑎𝑘𝑟 )
and
akr = Φ(τi , τj ) − Φ(τi−1 , τj ) − Φ(τi , τj−1 ) + Φ(τi−1 , τj−1 )
(2')
(3)
, where: Φ is the joint cumulative distribution function with the unknown polychoric
correlation coefficient ρ.
Second, ρ is obtained by maximising l function with the thresholds τi,τj which are
equal to the inverse cumulative distribution function of the observed proportion in unit
(k r) of the table (Olsson 1979):
τi = Φ−1 (Pi )
(4)
τj = Φ−1 (Pj )
(5)
Based on this theoretical framework, Ward (2014) resolves the factor loading of variable
xi corresponding to the category dk:
44 | ICUEH2017
τ2
τ2
(i−1)
−
− i
2 −e 2 )
(e
βi⃓dk =
λ
√2π{Φ( τi )−Φ(τi−1 )} i
(6)
where: λi is the first component of polychoric PCA assigned for xi.
The factor loadings (or weights) of variable have dual functions. Moser and Felton
(2007) explore a proportional contribution of variable weights in wellbeing. These
weights show how an indicator is important as a wellbeing determinant. For example,
an asset indicating the presence (absence) of other assets may be assigned a positive
(negative) correlation coefficient. An asset with a very small coefficient is less relevant
to wellbeing and therefore, can be omitted. A construction of wellbeing index is as
follows:
d
𝑤ℎ = ∑𝑋𝑖=1 ∑dkn
β
. 𝑦(𝑥i⃓dkj )
k(j=0) i⃓dkj
(7)
where:
𝑤ℎ is the level of wellbeing of household h;
X indicates variables representing household wellbeing;
dk1…kn denotes n categories of variable xi; and
y(xi|dk) is the achievement due to obtaining indicator xi with dkj.
The PCA-based measurement of wellbeing outperforms the existing methods in three
main ways (McKenzie 2005). First, results of measurement are unambiguous. This
aspect is more important in terms of policy implications. Second, while other
measurements avoid resolving interrelationships across dimensions, the PCA-based
method can consider plausible interdependency of variables. The factor loadings are
calculated based on various categories and units of a variable. This characteristic further
enables us to estimate inequality in wellbeing with varying quantities of asset
ownerships, various levels of educational achievement, and a wide range in health
status. Third, a computation of different weights is more reasonable than an allocation
of unified weight for all variables. With these PCA advantages, this study goes beyond
income inequality and analyses the importance of different factors contributing to
inequality.
Phan Van Phuc et. al. | 45
The second role of variable weights indicates wellbeing inequality. The higher the
weights, the greater the share of variable in the total variance of the first component of
PCA and thus, it shows the gap in wellbeing distribution. If a variable has a minor
standard deviation, it is assigned a small weight in PCA in the inequality index.
According to McKenzie (2005) and Ward (2014), the measurement of inequality using
PCA is as follows:
𝐼𝑡 =
𝜎𝑡
(8)
√𝜆
where:
σt is the sample standard deviation of household wellbeing (wh) at time t;
λ is the first eigenvalue from the correlation matrix in PCA and also the variance held
by the first component across the whole population.
3.2.
Data
This study uses data extracted from the Vietnam Household Living Standard Surveys
(VHLSSs) which combine the retrospective information about households that have
participated in the previous wave and about the first-time additional participants. A
longitudinal dataset that is composed of more than two waves substantially decreases
the number of observations, and this might cause measurement errors. Additionally, no
households interviewed in the 1990s took part in the later survey in the 2000s.
Therefore, this paper does not generate panel data, but uses pooled 1993–1998 and
2002–2008 data.
Since the size of the VHLSS 2002 is threefold the size of any other wave, a random
sample of 31% of its total observations is created with a remaining proportion of
observations between provinces and urban–rural. This technique of data combination
computes unique weights for ordinal and cardinal variables so that the wellbeing level
and inequality can be comparable across households inter-temporally.
3.3.
Variables
Twenty–one and twenty–five variables are used as proxies for wellbeing in the 1990s
and 2000s respectively. Regarding changes in wellbeing standards, this section
predetermines whether variables used for the period 1993–1998 remain sensible in the
following decade. Indicators with all correlation coefficients lower than 0.1 are
46 | ICUEH2017
considered as ‘no containing information’ (Moser and Felton 2007) and excluded from
the model.
Asset indicators
Despite no consensus on a standard principle, several guidelines for variable choices
are mentioned. Assets need to be chosen carefully as several assets might represent
prosperity in the past but poverty at present (Rutstein and Johnson 2004). An increased
number of assets can also raise household capabilities (Ward 2014). As wellbeing is
multidimensional, these variables must be plausible to avoid biases in ranking individual
wellbeing.
The magnitude of coefficients on original variables generated by PCA depends on
how the proportion of total information is captured by the corresponding indicators;
greater coefficient means that the variable is more important contribution to wellbeing.
This is an advantage of the PCA-based measurement of inequality because the chosen
indicators indicate related variables that describe wellbeing irrespective of whether they
are present in the measurement.
The extent to which the role of asset ownership has changed could be explained by
socioeconomic conditions. When the average income was below US$300 in the 1990s
(World Bank 2013a), Vietnamese people could expect to possess a radio, or a clock as
essential things of an acceptable living standard. However, these assets become less
important in the twenty–first century as households own more valuable items that
generate identical utilities (such as colour TVs, or wrist watches). Therefore, a list of
indicators should be revised over time to avoid any inappropriate proxy for wellbeing.
Furthermore, this analysis also considers the quantities of the assets owned by the
households, as these differences could be of importance to measure inequality. Ward
(2014) clarifies that a consideration to asset quantity can raise the effectiveness of the
polychoric PCA regarding the rankings of household wellbeing.
Educational indicators
Education is a vital wellbeing determinant because knowledge and experience not
only reflect the household achieved functionings in the educational dimension itself but
also influence other aspects of wellbeing.
Phan Van Phuc et. al. | 47
This study selects two variables as a proxy for the educational dimension (but only
one for the 1990s due to data unavailability). Instead of the household head, the person
with the highest educational attainment in the household is collected. The reason for
this is that household wellbeing could be affected by the members with the highest level
of education not only within the educational dimension but also in the economic and
health aspects. In Vietnam, there is a significant gap between parents and their
offspring’s schooling because household heads were likely to have finished schooling
early, but they encourage their children’s studies even though they are classified in the
poor stratum.
Housing and health related variables
The housing variables used include housing characteristics and housing facilities.
These variables can provide information on both the quality of accommodation and
other conditions related to the health dimension. The earlier indicator refers the types
of material used to house building (e.g. wood, cement) and housing facilities reflect the
quality of basic services consumed by households (e.g. drinking water). A consideration
of housing indicators is found in studies in inequality underpinned Sen’s capability
approach (Kuklys and Robeyns 2006, p.46) despite different choices of housing variables
regarding wellbeing. McKenzie (2005) uses the number of rooms, house ownership, and
the quality of walls and roofs, as proxies for the housing dimension; Kuklys and Robeyns
(2006) choose the indicators which investigate whether a household has problems of
(water) condensation, rotting wood (windows or floors), keeping the home warm and
the house capacity. Moser and Felton (2007), and Ward (2014) add lighting sources, and
toilet types in this group and classify them as ‘housing capital’. In this paper, the housing
characteristics variables are combined with asset indicators.
Additionally, housing facilities are interpreted as proxies for the health dimension
because these variables can significantly impact individual physical wellbeing. For
example, using safe drinking water may reduce the probability of several infections.
Unfortunately, this type of information is unavailable in the 1990s waves and therefore,
the number of sick days over a month is used as a proxy for the family health status.
48 | ICUEH2017
Table 1
Variables used for a measurement of wellbeing level and inequality over the period
2002–2008
Housing and Asset ownership
Housing variables
Assets
Types of house: indicating the
quality and characteristics of
material used to build a house
Electricity: ordinal, indicating
energy resources for the lighting
purpose. Assuming that using
national provision of electricity is
the highest benefit to a household
wellbeing.
Car
Motorbike
Home phone
Video player
Colour TV
Black and white TV
Refrigerator
Air conditioner
Water heater
Washing machine
Gas cooker
Electric
cooker/stove
Electric generator
Water pump
Personal
computer
Printer
Camera
Vacuum cleaner
Educational achievements
Schooling years (in the official universal educational system, from the pre-school level to grade 12) of
the most educated member of a household.
Highest educational qualification achieved by the most educated individual of a household.
Health related indicators
Drinking water: ordinal variable (ranging from 1 to 5) indicates the quality of water source for the
drinking purpose.
Toilet: ordinal variable (ranging from 1 to 5) reflects the type of toilet used.
Garbage: ordinal variable (ranging from 1 to 4) expresses the kind of rubbish disposal.
4. The
household
wellbeing
level:
non-monetary
vis-à-vis
monetary indicator
To validate the wellbeing index and the analysis of wellbeing inequality, this paper
makes a comparison between two proxies of wellbeing: non-monetary (wellbeing)
indicators estimated by the polychoric PCA and a monetary variable – the consumption
expenditure. The theory behind this comparison is Sen’s (1985a) capability approach.
Consumption expenditure is a common proxy for economic rather than
multidimensional wellbeing. Sen argues that money is a means but not an end (outcome
of wellbeing); thus, use of the monetary variable could be misleading because income
‘gives a very inadequate and biased view of inequalities’ (1997, pp.384-385). We
advocate this argument that using expenditure data for analyses of Vietnamese people’s
wellbeing is inappropriate. In contrast, the non-monetary indicators consider the level
Phan Van Phuc et. al. | 49
of wellbeing and the contribution of various dimensions, adding but not limited to
income, to wellbeing.
Table 2 describes a relationship between household expenditure and the wellbeing
index derived by Eq.(7). The two methodologies used for this comparison are the within
quintile ranking consistency and the Spearman-rank correlation technique. The
population in each wave of survey is classified in five quintiles based on the household
expenditure, and the household wellbeing indicator respectively. Then, an identification
matching technique is used to record the percent matched within the same quintiles by
these two methods. The second column shows that the level of consistency is around
40% across these four waves. This means that about 60% of the wellbeing level
measured by the non-monetary approach may not be covered by the expenditure
variable. The third column reveals the ranking correlation between the household
expenditure and the wellbeing index. Compared with the within-quintile matching, the
Spearman-rank correlation method illustrates closer and significant correlation
coefficients between the two proxies2. This technique indicates that over two–thirds of
households are consistently ranked by the wellbeing index and the household
expenditure.
Results of a mismatch between the lowest quintile defined by the wellbeing index and
the highest one identified by the expenditure data, and vice versa, are reported in the
last two columns. The percent of mismatched households between two methods are
negligible.
2
All results estimated by the Spearman correlation coefficients are significant at the 1% level.
50 | ICUEH2017
Table 2
A consistency between the household expenditure data and the wellbeing index in
household classification
Year
Percent
matched
within
quintiles
Spearman
coefficient on
ranking consistency
Wellbeing lowest
quintile/ Income
highest quintile3
Income lowest quintile
/ Wellbeing highest
quintile
2002
40.66
67.85
2.37
0.30
2004
39.93
70.73
0.06
1.94
2006
43.49
72.32
1.21
0.00
2008
42.87
71.82
1.11
0.41
Source: VHLSS 2002–2008; authors’ estimation
Another way to check the robustness to the wellbeing index is to compare the trends
in wellbeing using the two proxies. As Vietnam did not experience any notable crisis (e.g.
political conflict or economic shock) which negatively affect the economic, health, or
educational dimensions, the overall wellbeing level is expected to increase in the period
2002–2008.
With the pooled VHLSS 2002–2008 data, values of wellbeing are calculated. The
polychoric PCA produces the zero-mean aggregate wellbeing values for the whole
sample; hence, the wellbeing level of each wave could not be interpreted in its absolute
values. However, it is evaluated relatively through its variations. Table 3 shows rises in
the mean of wellbeing for the whole country and two selected regions. The national
wellbeing level, placed in the first column, increased spanning 2002–2008. This
trajectory is compatible with socioeconomic progress in Vietnamese society. This
tendency is consistent with changes in household real expenditure presented in the last
column.
Table 3 also illustrates wellbeing movements in two distinct regions. Changes in
wellbeing in both the two regions follow the trajectory of national wellbeing. This
evidence confirms that the wellbeing indicator generated by the polychoric PCA is
a good proxy used for an analysis of inequality. This comparison shows an
analogous improvement in wellbeing found in Ward (2014). These results further
3
This fraction is estimated by the matching technique that expresses how many percent of households categorised
as highest expenditure quintile but as belong to the poorest quintile in wealth measured by the asset indicator
approach.
Phan Van Phuc et. al. | 51
support the appropriateness of using the wellbeing index generated by the
polychoric PCA.
Table 3
Vietnamese household wellbeing over the period 2002–2008
Year
The national
wellbeing level
The wellbeing in
the Red River
The wellbeing in
the North
Mountainous
Household
expenditure
(million VND)
2002
-.7502684
-.7822194
-.7643418
14.64
2004
-.1910074
-.1723805
-.2051175
19.36
2006
.2370399
.2149756
.2377183
24.62
2008
.7473937
.7784944
.7315027
31.33
Source: VHLSS 2002–2008; authors’ estimation
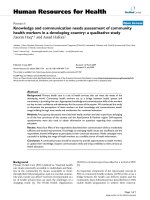
Finally, the kernel density distribution function is used to track the movement of
wellbeing evolvement over time (Figure 1). The value of wellbeing index rose intertemporarily as the distribution of later wave moved towards the right-hand-side. These
results confirm that the wellbeing indicator generated by the polychoric PCA is
reasonable and comparable and thus, the chosen method is sufficient quality for
inequality analyses.
Figure 1: An estimate of wellbeing density for the period 2002–2008
Source: VHLSS 2002–2008; authors’ calculation
52 | ICUEH2017
5. The level of inequality in wellbeing
This section analyses inter-temporal and temporal changes in inequality for the
whole country and specific geographical areas for fifteen years after 1993. Section 5.1
examines inequality in the 1990s. Because the sample sizes of these two waves are rather
small, an examination of the spatial inequality will only dwell on the urban–rural
dimension to guarantee the quality of the metric.
The polychoric PCA is applied to calculate the unique variable weights in the
wellbeing index. While generating these scoring factors for these variables, it computes
the greatest eigenvalue (λ) which is incidentally also the largest discrimination across
the sample. Using these scoring factors as weights of variables, the household wellbeing
level (𝑤ℎ ) and its standard deviation are estimated. Finally, the results of wellbeing
inequality levels estimated by Eq.(8) are compared with other research outcomes
derived from regular measurements of inequality (Theil T, and Maasoumi’ index).
Section 5.2 examines inequality over the period 2002–2008 with respect to the
within-urban, within-rural, and the regional dimension. For the whole nation, this
section uses the compiled data of VHLSS 2002–2008 with an adjustment for the size of
VHLSS 2002 as mentioned in Section 3.2 above. For the within-region inequality
analysis, we divide the country in five terrains: (1) the Northern Mountain that includes
the initial North East and North West; (2) the Red River; (3) the Central Coast consisting
of both the North and South Central Coast sub-regions; (4) the Southeast and Central
Highlands; (5) the Mekong Delta. This rearrangement of regional data is necessary for
two reasons. Sub-regions sharing analogous geographical and demographic
characteristics are grouped. For example, both the North East and North West are
mountainous, among the least populous areas, and have a sizable portion of ethnic
minorities in their total population. Additionally, sample sizes of the sub-regions are
insufficient for an estimate of inequality using PCA method and therefore, the
comparative results of inequality could be insignificant.
We further check the robustness by comparing the single result of multiple
dimensions of inequality with the inequality measured only by the asset dimension,
which is presented in section 5.3. The ending section will discuss the contributions of
our findings.
Phan Van Phuc et. al. | 53
5.1.
The trend in inequality in the 1990s
This subsection discusses changes in inequality in the period 1993–1998. Results of
inequality are summarised in Table 4. In this table, 𝐼𝑡 defines inequality in household
wellbeing, and is measured by Eq.(8). Column 2 presents a substantial increase in
inequality at the national level from 0.31 to 0.52. This expansion was also found for the
within-urban inequality although urban areas had a higher level of inequality than the
whole country. In rural areas, despite a significant rise, inequality was notably smaller
than in the urban, especially in the 1998.
The Theil T index of the household real expenditure which is preferable for
decomposition purposes is presented as a benchmark. While 𝐼𝑡 reports a rising
inequality, the Theil T index reveals a decrease in the within-rural inequality. Regarding
the urban areas, though both measurements illustrate an increase in inequality, the
magnitude of inequality calculated using the Theil T is smaller than the one calculated
using the wellbeing inequality index, 𝐼𝑡 . The later method shows that the within-urban
inequality level was even higher than national inequality level.
Further, the section compares inequality estimated by the polychoric PCA and by the
Maasoumi’s (1986, 1999) approach. Using the Massoumi index, Justino (2012) shows
varying results of inequality in Vietnam over the period 1993–1998 even with the same
data because there are many possible combinations between two parameters (α:
inequality aversion, β: dimensional substitution). Among possible values of these two
parameters, this paper scrutinises two cases: α=0, indicating that a society does not care
about inequality; and α=1, meaning that the society has a worry about inequality. The
dimensional substitution, β, is assumed to equal to 1, implying that it is positive and
proportional substitution between dimensions. Justino’s (2012) two-dimension
inequality index (economic and educational) points out the uncertain outcomes. Two
choices of the inequality aversion (α) produce conflicting trends (Table 4). When there
was no aversion to inequality (α=0), inequality could increase marginally. Nevertheless,
if there is an existence of the social inequality aversion, inequality is likely to decline. Yet
it is very hard to know the true value of α and β and thus, the Maasoumi index unlikely
provide definite conclusions of inequality.
54 | ICUEH2017
Table 4
Inequality in Vietnam in the period 1993–1998
Whole country
𝑰𝒕
1993
0.31
1998
0.52
Theil T
Within-urban
Maasoumi index (β=1)
𝑰𝒕
Theil T
Within-rural
𝑰𝒕
Theil T
α=0
α=1
0.20
0.318
0.208
0.37
0.17
0.29
0.19
0.23
0.320
0.199
0.60
0.23
0.45
0.16
Source: VLSS 1993, 1998; authors’ estimation; Results of Maasoumi’s index (Justino 2012, Table 1).
5.2.
Inequality in the period 2002–2008
Within-urban and within-rural inequality
Using the compiled data from the VHLSS 2002–2008, this subsection estimates the
within-urban and within-rural inequality in household wellbeing and compares the
results with the Theil T index, and the Gini coefficient of household expenditure. Figure
2 shows that there was a convergence in inequality at the national level, the urban, and
the rural areas in the 2000s. During the period 2002–2004, inequality in the urban areas
remained relatively high at around 0.55 and fairly unchanged, while inequality within
rural areas was substantially lower at 0.36 but with a faster growth pace. However, the
absolute gap between two indices was still large. Since 2004, there have been two
contrary tendencies in inequality between the urban and rural areas. The rural
inequality continuously increased and reached a peak at the end of the studied period
whereas the urban inequality declined gradually. The difference in the wellbeing
inequality between the two regions was negligible in 2008; the results of inequality were
about 0.50 and 0.46 for the urban and rural areas respectively.
Phan Van Phuc et. al. | 55
0.6
0.55
Whole
country
0.5
Within
urban
0.45
0.4
Within
rural
0.35
0.3
2000
2002
2004
2006
2008
2010
Figure 2: Within-urban and within-rural inequality 2002–2008
Source: VHLSS 2002–2008; authors’ calculation
The national inequality level is determined by the within-urban and within-rural
components. The increased inequality in both areas in the period 2002–2004 caused a
marginal rise in the national inequality. However, inequality in the household wellbeing
decreased after that. In addition, the figure also implies that the inequality within rural
and within urban areas rather than the urban–rural gap contributed major parts to the
overall inequality in the 2000s. Ward (2014) claims that a decline in the urban–rural
inequality refer a situation where the wellbeing achievements in rural areas progressed
at a faster rate than in urban ones. Similarly, Huong and Booth (2014) point out that the
Gini coefficient of household expenditure remained unchanged from 2002 to 2004 and
monotonically fell over the following two years. They also find opposing trends in the
Gini coefficient of household expenditure between the urban and rural spaces. Although
the overall inequality in the whole country stabilised, both within-urban and withinrural inequality gradually increased in 2008 (Figure 3). The Theil T index also confirms
this upward trend (Figure 4).
Different results of inequality estimated by the wellbeing indicator and conventional
measurements are found. Both the Gini coefficient and Theil T index show that
inequality reduced in the period 2002–2008 whereas inequality in the wellbeing
distribution rose steadily. Another point is that the PCA method shows a higher level of
inequality within urban areas than at the national level. There is a clear convergence in
the inequality level among the whole country, within urban and within rural areas.
Nevertheless, the two regular measurements highlight a higher degree of inequality for
56 | ICUEH2017
the whole country rather than urban areas, and urban households might have a
substantially greater disparity in wellbeing than rural families.
0.39
0.37
0.35
0.33
0.31
0.29
0.27
0.25
2000
Gini
Gini Rural
Gini Urban
2002
2004
2006
2008
2010
Figure 3: The Gini coefficient of household expenditure within-urban, and within-rural
Source: VHLSS 2002–2008; authors’ calculation
0.26
0.24
Within
urban
Within
rural
Whole
country
0.22
0.2
0.18
0.16
0.14
2000
2002
2004
2006
2008
2010
Figure 4: The Theil T index of household expenditure within-urban, and within-rural
Source: VHLSS 2002–2008; authors’ calculation
Regional inequality
This subsection explores remarkably different trends in the wellbeing inequality
across the country. The inequality within-region shows that the Southeast and
Highlands was the most unequal areas until 2006. In contrast, the Northern
Mountainous region experienced a rapid expansion in wellbeing inequality and thus,
became the most unequal region in 2008. This upward trend could be explained by the
regional demographic characteristics. A high proportion of minor ethnicities having
socioeconomic disadvantages could widen the gap between the major and minor
ethnicities. This cause of inequality is similarly found in several studies on the
Phan Van Phuc et. al. | 57
Vietnamese regional inequality. For instance, Takahashi (2007) finds that unequal
educational background between the major and minor groups within regions is a main
driver of the regional inequality.
Starting at the same level of inequality in 2002, the Mekong Delta and the Central
Coast were the least unequal regions in 2008, albeit both these had a steady rise in
inequality in the studied period. The Red River Delta showed a marginal increased
dispersion in household wellbeing. Among the five regions, the Southeast and the
Highlands were two exceptional areas where the degree of inequality slightly decreased.
The ending point of this period shows narrower differences in the inequality level across
the country.
0.55
0.53
0.51
0.49
0.47
0.45
0.43
0.41
0.39
0.37
0.35
2002
Red River
Northern Mountain
Central Coast
Southeast and
Highlands
Mekong River
Whole country
2003
2004
2005
2006
2007
2008
Figure 5: Within-region inequality in the period 2002–2008
Source: VHLSS 2002–2008, authors’ estimation
Robustness checks
This section additionally checks robustness of the chosen measurement of inequality
applied to Vietnamese data in the period 2002–2008. To do so, we compare our results
with the estimates of inequality using the asset and housing indicators which is called
the asset index. The reason for this is that the number of asset and housing variables is
sufficient to generate a benchmark whereas those of the other two dimensions are too
small to validate similar estimates. Additionally, asset variables were used as proxies for
multiple dimensions of household wellbeing; therefore, a comparison between two
indices could reinforce our findings above.
58 | ICUEH2017
.4
We firstly evaluate the quality of asset index by analysing their distribution with the
Kernel density estimation technique (Figure 6). The results show a movement in the
asset value from the left- to the right-hand-side, meaning that the economic dimension
of household wellbeing evolves over time. However, with several clumps in distribution
of assets, the asset index would do a poorer job if it computed inequality because a
clumping indicator could not identify differences across the population in the case that
these variations are marginal (McKenzie 2005).
0
.1
Density
.2
.3
2002
2004
2006
2008
-5
0
5
10
ASSET
Figure 6: Kernel density estimate of asset distribution
The robustness check is presented in Table 5. The key result is a similar upward trend
in inequality in the asset dimension and wellbeing. It is noted that by construction, the
absolute values of inequality measured by PCA content no meanings without
comparisons. The nature of the index here is to observing the extent to which changes
in the asset and wellbeing distributions in a particular time versus the entire examined
period. The similar increases in both two indices refer two statements. The first is that
Phan Van Phuc et. al. | 59
the economic dimension definitely dominates the two others as there are a large amount
of variables of asset and housing are added in wellbeing index and thus, it determines
the overall trend in wellbeing distribution. Second, it confirms the consistency between
asset-based and wellbeing multiple indicators including education and health dimension
and the privilege of wellbeing index in terms of investigating inequality.
Table 5
Checking robustness of the inequality index
Year
2002
2004
2006
2008
𝑰𝑨𝑺𝑺
.415
.446
.452
.454
𝑰𝒕
.453
.498
.498
.504
Note: 𝐼𝐴𝑆𝑆 is inequality value calculated based on the asset dimension, 𝐼𝑡 is preferable inequality index.
Source: VHLSS 2002 – 2008; authors’ calculation
5.3.
The contribution of the findings to the literature on inequality
The literature on inequality in Vietnam shows a complexity of research results using
conventional measurements. There are conflicting findings of the level of inequality
because of different methods, data, and dimensions (Badiani et al. 2012). A
measurement of inequality based on income data is insufficient. Income is just a means,
albeit important, to many ends of wellbeing; therefore, the results of inequality in
income could not reasonably describe the overall wellbeing inequality (Sen 1997, pp.3435, 2006). Several multidimensional inequality indices (e.g. Maasoumi’s approach)
cannot appropriately explain inequality because their results are subject to varying
choices in parameters. This evidence shows a substantial gap in the literature on trends
in wellbeing inequality.
We fill this gap by presenting new results on the increase in multidimensional
inequality in the period 1993–2008. With respect to the period 2002–2008, Badiani et
al. (2012) presents contradictory results showing that income inequality remained fairly
constant in Vietnam but the non-income inequalities increased at the same time. This
shows that an evaluation of inequality should considers not only the non-economic
(education, and health) but also the economic outcomes. In this circumstance, the
findings of this study are novel and important.
60 | ICUEH2017
6. Concluding remarks
This paper has analysed the wellbeing level and wellbeing inequality in Vietnam in
the 1990s and 2000s. The paper provided new results on the inequality level; used a
broader list of variables, which might reduce biased estimates; and took dimension
correlations into consideration in the measurement.
Inequality in Vietnam substantially increased in the period 1993–2008. Although
inequality within regions shown different patterns, most of the regions follow the
national trend which marginally expanded over time. There has been, however, a
reduction in within-urban and within-rural inequality but the urban–rural gap has
widened.
This paper offers insight of inequality in two main ways. First, while previous
research only focuses on the economic aspect of inequality, we included wealth,
educational, and health dimensions in the measurement to paint a different picture of
inequality. Second, the study observed the level of inequality over time, in addition to
across places temporally, so it offers comprehensive information about inequality that
can be used for further analyses in favour of inequality reduction policies.
Several suggestions for future research in wellbeing inequality are made. We
emphasize the importance of multiple dimensions regarding wellbeing analysis, but it
seems that available data and variables for such analyses remain limited. A possible
improvement is a comparison between our direct calculation and a two-stage polychoric
PCA of inequality. In the stage one, the wellbeing levels of each dimension are computed
separately; then, the stage two is in charge of an aggregation of these sub-indices
associated their parameters. In both stages, the polychoric PCA is applied to compute
the weights for variables of sub-indices and for dimensions in the overall wellbeing level.
Additionally, comparing with the two-step analysis could be insightful into the
sensitivity of the measurement of inequality as one can see the extent to which each of
variables is weighted in relation to different approaches of applying the polychoric PCA.
Phan Van Phuc et. al. | 61
References
Alkire, S. (2002b). Valuing freedoms : Sen's capability approach and poverty reduction, Oxford ; New York
: Oxford University Press, 2002.
Badiani, R., B. Baulch, L. Brandt, V. H. Dat, N. T. Giang, J. Gibson, J. Giles, I. Hinsdale, P. Hung, V. Kozel,
P. Lanjouw, M. Marra, V. V. Ngoc, N. T. Phuong, P. Schuler, N. Thang, H. X. Thanh, L. D. Trung, P. D.
Tung, N. Viet Cuong, L. H. Vu and A. Wells-Dang (2012). Well Begun, Not Yet Done: Vietnam’s
Remarkable Progress on Poverty Reduction and the Emerging Challenges. 2012 Vietnam Poverty
Assessment. Hanoi, World Bank in Vietnam.
Cho, E. (2015). 'Children's Wellbeing in East and Southeast Asia: A Preliminary Comparison.' Social
Indicators Research 123(1): 183-201.
Dang, A.-T. (2014). 'Amartya Sen's Capability Approach: A Framework for Well-Being Evaluation and
Policy Analysis?' Review of Social Economy 72(4): 460-484.
Deaton, A. (2013). THE GREAT ESCAPE: Health, Wealth, and the Origins of Inequality. New Jersey,
Princeton University Press.
Decancq, K. and M. A. Lugo (2012). 'Inequality of Wellbeing: A Multidimensional Approach.' Economica
79(316): 721-746.
Huong, T. L. and A. L. Booth (2014). 'Inequality in Vietnamese Urban–Rural Living Standards, 1993–2006.'
Review of Income and Wealth 60(4): 862-886.
Jackson, W. A. (2005). 'Capabilities, Culture and Social Structure.' Review of Social Economy 63(1): 101124.
Justino, P. (2012). 'Multidimensional welfare distributions: empirical application to household panel data
from Vietnam.' Applied Economics 44(26): 3391-3405.
Kolenikov, S. and G. Angeles (2004). The Use of Discrete Data in PCA: Theory, Simulations, and
Applications to Socioeconomic Indices.
Kolenikov, S. and G. Angeles (2009). 'Socioeconomic status measurement with discrete proxy variables:
is principal component analysis a reliable answer?' The Review of Income and Wealth 55(1): 128-165.
Kuklys, W. and I. Robeyns (2006). 'Sen's Capability Approach to Welfare Economics'. Amartya Sen's
Capability Approach: Theoretical Insights and Empirical Application. W. Kuklys. Berlin, Sringer.
Maasoumi, E. (1986). 'The measurement and decomposition of multi-dimensional inequality.'
Econometrica (1986-1998) 54(4): 991.
Maasoumi, E. (1999). 'Multidimensioned approaches to welfare analysis'. Handbook of Income Inequality
Measurement. J. Silber, Kluwer Publishers: 437-484.
McKenzie, D. J. (2005). 'Measuring inequality with asset indicators.' Journal of Population Economics
18(2): 229-260.
Merriam-Webster dictionary (n.d.). "Non Sequitur", Merriam-Webster.com.
62 | ICUEH2017
Moser, A. and A. Felton (2007). The Construction of an Asset Index: Measuring Asset Accumulation in
Ecuador. Poverty Dynamics: Interdisciplinary Perspectives T. Addison, D. Hulme and R. Kanbur,
Oxford University Press.
Nilsson, T. (2010). 'Health, Wealth and Wisdom: Exploring Multidimensional Inequality in a Developing
Country.' Social indicators research 95(2): 299-323.
OECD (2013). How's life? : measuring well-being, OECD Publishing.
Olsson, U. (1979). 'Maximum likelihood estimation of the polychoric correlation coefficient.'
Psychometrika 44(4): 443-460.
Qizilbash, M. (2011). 'Sugden’s critique of Sen’s capability approach and the dangers of libertarian
paternalism.' International Review of Economics 58(1): 21-42.
Rutstein, S. O. and K. Johnson (2004). The DHS Wealth Index, USAID.
Sen, A. (1980). Equality of what? Cambridge, Cambridge University Press.
Sen, A., Ed. (1985a). Commmodities and Capabilities. Oxford, North-Holland.
Sen, A. (1985b). 'Well-Being, Agency and Freedom: The Dewey Lectures 1984.' The Journal of Philosophy
82(4): 169-221.
Sen, A. (2003a). Inequality Reexamined, Oxford Scholarship Online.
Sen, A. (2003b). Capability and Well-being. The Quality of Life. M. Nussbaum and A. Sen, Oxford
Scholarship Online.
Sen, A. (2006). 'Conceptualizing and Measuring Poverty'. Poverty and Inequality. D. B. Grusky and R.
Kanbur. California, Stanford University Press.
Sen, A. K. (1997). 'From income inequality to economic inequality.' Southern Economic Journal 64(2):
384-401.
Stiglitz, J. E., A. Sen and J. Fitoussi (2009). Report by the Commission on the Measurement of Economic
Performance and Social Progress.
Sugden, R. (1993). 'Welfare, Resources, and Capabilities: A Review of Inequality Reexamined by Amartya
Sen.' Journal of Economic Literature 31(4): 1947-1962.
Takahashi, K. (2007). 'Source of Regional income disparity in rural Vietnam.' Discussion paper.
Ward, P. (2014). 'Measuring the Level and Inequality of Wealth: An Application to China.' Review of
Income and Wealth 60(4): 613-635.
World Bank (2013a). World Development Indicators.
Zhuang, J., R. Kanbur and D. Maligalig (2014). 'Asia’s income inequalities: Recent trends'. Inequality in
Asia and the Pacific: Trends, drivers, and policy implications. R. Kanbur, C. Rhee and J. Zhuang.
London, Routledge and ADB.