Practice Made Perfect 20
Bạn đang xem bản rút gọn của tài liệu. Xem và tải ngay bản đầy đủ của tài liệu tại đây (102.75 KB, 10 trang )
168 P
RACTICE
M
ADE
P
ERFECT
go back to the shareholders to ask for a loan or infusion of cash for
the business.
Use debt to fund the balance sheet, not to cover losses on the
income statement. Recognize the principle of financial leverage,
whereby debt is used to finance assets to help you produce a profit.
In addition, match funding to the useful life of an asset. Be careful
about using short-term lines of credit to finance long-term needs.
Recognize that equity can come from only two sources and that,
for both emotional and financial reasons, it’s prudent to retain some
earnings in your business to help fund your growth.
Analyzing the Statement of Cash Flow
Once you understand how this statement of cash flow is constructed,
the analysis of cash flow becomes fairly straightforward. The most
helpful cash flow ratios to observe are:
!
Operating cash flow to revenue
!
Operating cash flow to total assets
!
Operating cash flow to equity
Operating cash flow is often referred to as free cash flow because
it’s the amount available to the owner before investment in fixed
assets and before funding from outside sources. Free cash flow is a
familiar concept in the valuation of an advisory firm because it’s more
relevant than applying a multiple to operating profit or revenue. To
determine whether the business is actually producing a return, you
need to know if the business is producing positive cash flow from
operations. Knowing the ratio of operating cash flow to revenue, to
total assets, and to equity makes you better able to evaluate the real
financial returns in your business.
Operating cash flow to revenue.
Much like the concept of oper-
ating profit margin (operating profit ÷ revenue), the OCF-to-revenue
ratio tells you your cash flow return on revenue. This number should
at least remain fairly constant over time; preferably it will increase.
Operating cash flow to total assets.
The OCF-to-total assets
ratio is significant because it helps you to evaluate whether you’re
producing cash flow as a result of an investment in balance-sheet
I
NCOME
, P
ROFIT
, C
ASH
F
LOW
(
AND
O
THER
D
IRTY
W
ORDS
) 169
assets, such as accounts receivable, WIP, or fixed assets. If this num-
ber is declining, it means that you have invested too much in fixed
assets or that you’ve lost your focus on managing to a better bottom
line and more efficient balance sheet.
Operating cash flow to equity.
This ratio is a variation on the
return-on-investment concept, using the most relevant measure of
return—cash. Typically, one would not find a large amount of equity
in a financial-advisory firm, but to the extent it exists it should, like
any investment, be generating a positive and increasing cash flow
return on equity.
For each of these ratios, healthy numbers for your advisory firm
will depend on your business structure. It’s helpful to compare
your cash flow returns against industry benchmarks. But it’s even
more important to establish a baseline number for your practice and
observe whether these cash flow returns are improving year to year.
Financial-Impact Analysis
Observing ratios in comparison with benchmarks and trends is
interesting, but these numbers become even more revealing when
you do a financial-impact analysis. The impact analysis translates the
variance into a dollar amount. When you understand the magnitude
of the problem, you’re better able to focus on the solution. It may
be tempting to downplay the problem when the ratio is off from
the benchmark by only a fraction or a small percentage. In reality,
a 1 percent variance can have a significant effect on the financial
performance of your practice. One percent of a million dollars, for
example, is real money.
To measure that financial impact, you must identify your tar-
get. This may be a benchmark derived from the FPA Financial
Performance Study, or your firm’s best year, or even an arbitrary
number. The point is to compare your firm’s number with the num-
ber to which you aspire. For example, let’s say that your practice’s
revenue is $1,000,000 and your target operating profit margin
is 25 percent (as determined by the industry benchmark), thus
$1,000,000 × .25 = $250,000. Your financial statements indicate
that your operating profit margin is only $100,000, or 10 percent
170 P
RACTICE
M
ADE
P
ERFECT
of revenues. Based on the industry benchmark, that means you’re
$150,000 short of the amount appropriate for your firm.
So how do you use this information? Now that you’ve uncovered
the magnitude of the problem, you can go back to your analysis and
focus on the causes of low profitability—namely, a low gross profit
margin, poor expense control, or insufficient revenue volume to sup-
port your overhead. What do you look at first?
Improving profitability requires following a logical, four-step
process:
1. Cut costs.
2. Improve gross profit margin.
3. Increase volume.
4. Raise prices (if you have discretion to do so).
The most immediate way to attack low profitability is to deter-
mine which costs you can eliminate. This may mean making some
hard choices, such as laying off staff, subletting space in your office,
or imposing restrictions on purchases. Advisers often find these
choices difficult to make because they assume that such cuts will
seriously damage the business. But let’s look at things in perspec-
tive: if you’re not making enough to get the firm on the road to
financial independence—plus provide a sufficient return to invest
in your practice so that you can serve clients better—then you’ve
already begun to damage your business. What steps are you going
to take to make things right? Is it easier to cut costs or to increase
revenues? Is it easier to adjust pricing or to be more selective about
which clients you take on? Is it easier to train staff to be more effec-
tive or to lay them off? When it adds up to a $150,000 problem in a
$1,000,000 practice, the steps required are probably a combination
of all of these and more.
Obviously, the problem is even more acute in small practices
because there are probably not as many areas to cut costs and
still serve clients well. For many small practices, recognizing this
dilemma becomes the catalyst for their decision to merge with
another firm.
I
NCOME
, P
ROFIT
, C
ASH
F
LOW
(
AND
O
THER
D
IRTY
W
ORDS
) 171
Productivity Analysis
For the purists in the financial-advisory business, “productivity”
has a negative connotation because it conjures up images of the
old brokerage environment. But regardless of how one views sales
organizations, such as big brokerage and insurance companies, there
is an indisputable economic logic to maintaining and increasing
productivity. When an advisory firm does not maintain and build a
reasonable level of productivity, its profitability will be undermined.
With declining profitability, the firm has less to reinvest in the busi-
ness, which it needs to do to maintain quality service for clients.
Ultimately, productivity isn’t just about money; it’s about enhancing
client service and the firm’s reputation as a business.
Indeed, evaluating productivity is an essential part of a firm’s
financial management, and there are a number of ways to assess it:
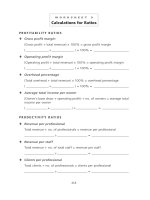
!
Revenue per client
!
Gross profit per client
!
Operating profit per client
!
Revenue per total staff
!
Revenue per professional staff
!
Operating profit per total staff
!
Operating profit per professional staff
!
Clients per total staff
!
Clients per professional staff
In isolation the ratios don’t tell you much, but by evaluating the
trend over a period of three or more years in each of these catego-
ries, you can observe what’s happening to the business. For example,
there is a point at which continuing to serve certain clients no longer
makes economic sense. An adviser may decide—perhaps for altruistic
reasons—to accept clients with assets below a minimum threshold,
but that should be the exception, not the rule. To be effective in
delivering services to the core client base, the core client relationships
must be profitable and productive.
The productivity ratios should increase over time. A firm is likely
to experience temporary aberrations in which the ratios decline, but
by and large, owners should be able to rely on these ratios as indica-
172 P
RACTICE
M
ADE
P
ERFECT
tors for when to add either professional or administrative staff. Such
indicators are also useful in negotiating goals with staff and giving
clarity to when staff should be added. As a general guideline, in an
up market, it’s prudent to add staff before you are at full capacity; in
a flat or down market, it’s best to wait until you’re at or over capacity
before adding staff. Of course, one of the other factors driving this
decision will be how the additions to staff are paid—either variable
amounts (commission) or fixed amounts (salary).
