Marcel dekker thermal analysis of materials ebook TLFeBOOK
Bạn đang xem bản rút gọn của tài liệu. Xem và tải ngay bản đầy đủ của tài liệu tại đây (12.88 MB, 298 trang )
TLFeBOOK
THERMAL
ANALYS I S
OF
UATERlALS
ROBERT F. SPEYER
School of Materials Science and Engineering
Georgia Institute of Technology
Atlanta, Georgia
Marcel Dekker, Inc.
New York*Basel*Hong Kong
TLFeBOOK
Library of Congress Cataloging-in-PublicationData
Speyer, Robert F.
Thermal analysis of materials / Robert F. Speyer.
p. cm. -- (Materials engineering ; 5)
Includes bibliographical references and index.
ISBN 0-8247-8963-6 (alk. paper)
1. Materials--Thermal properties--Testing. 2. Thermal analysis-Equipment and supplies. I. Title. 11. Series: Materials
engineering (Marcel Dekker, Inc.) ; 5.
TA4 18.24.S66 1993
620.1* 1'0287-&20
93-25572
CIP
The publisher offers discounts on this book when ordered in bulk quantities.
For more information, write to Special SaledProfessional Marketing at the
address below.
This book is printed on acid-free paper.
Copyright @ 1994 by MARCEL DEKKER, INC. All Rights Reserved.
Neither this book nor any part may be reproduced or transmitted in any form
or by any means, electronic or mechanical, including photocopying, microfilming, and recording, or by any information storage and retrieval system,
without permission in writing from the publisher.
MARCEL DEKKER, INC.
270 Madison Avenue, New York, New York 10016
Current printing (last digit):
10 9 8 7 6 5 4 3 2
PRINTED IN THE UNITED STATES OF AMERICA
TLFeBOOK
Dedicated to my mother, June
TLFeBOOK
This page intentionally left blank
TLFeBOOK
PREFACE
Technology changes so fast now, it must be frustrating for design engineers to see their products become out of date shortly
after they hit the market. With the advent of inexpensive
personal computers and microprocessors over the past decade,
there has been a virtual explosion of new thermal analysis companies and products. The level of instrument sophistication
has practically left the scientist/technician out of the loop; after popping the specimen in the machine, an elegant multicolored printout completely describes a series of characteristics
and properties of the material under investigation.
There is an inherent danger in trusting black boxes of this
sort, and it is the intent of this monograph to elucidate their
inner workings and provide some intuition into their operation.
I have avoided being encyclopedic in enumerating pertinent
journal and product literature. Rather, the narrative attempts
to develop important underlying principles. The design and
optimal use of thermal analysis instrumentation for materials’
property measurements is emphasized, as necessary, based on
atomistic models depicting the thermal behavior of materials.
This monograph, I believe, is unique in that it covers the
broader topic of pyrometry; the latter chapters on infrared and
optical temperature measurement, thermal conductivity, and
glass viscosity are generally not treated in books on thermal
analysis but are commercially and academically important. I
have resisted the urge to elaborate on some topics by using exTLFeBOOK
vi
PR EFA CE
tensive footnoting, in an attempt to maintain the larger picture
in the flow of the main body of the text.
This should be a useful text for a junior or senior collegiate
materials engineering student, endeavoring to learn about this
topic for the first time, or corporate R & D personnel, attempting to decipher what all the bells and whistles of their new,
quite expensive, instrument will do for them. By basing this
treatment on the elementary physical chemistry, heat transfer,
materials properties, and device engineering used in thermal
analysis, it is my hope that what follows will be a useful textbook and handbook, and that the information presented will
remain “current” well into the future.
I would like to acknowledge those who have assisted in the
preparation of this work: Rita M. Slilaty and Kathleen C.
B a d e for copyediting of earlier versions of the manuscript, as
well as Wendy Schechter and Andrew Berin for later versions.
Dr. Jen Yan Hsu for figure preparation, and my colleagues
at Georgia Tech: Drs. Joe K. Cochran, D. Norman Hill, and
James F. Benzel for technical editing and helpful discussions. I
am grateful to Professor Tracy A. Willmore for introducing me
to the subject of pyrometry during my undergraduate years at
the University of Illinois at Urbana-Champaign.
Robert F. Speyer
TLFeBOOK
CONTENTS
PREFACE
V
1 INTRODUCTION
1.1 Heat. Energy. and Temperature . . . . . . .
1.2 Instrumentation and Properties of Materials
..
..
1
2
5
2 FURNACES AND TEMPERATURE
MEASUREMENT
2.1 Resistance Temperature Transducers . . . . . .
2.2 Thermocouples . . . . . . . . . . . . . . . . . .
2.3 Commercial Components . . . . . . . . . . . .
2.3.1 Thermocouples . . . . . . . . . . . . . .
2.3.2 Furnaces . . . . . . . . . . . . . . . . . .
2.4 Furnace Control . . . . . . . . . . . . . . . . .
2.4.1 Semiconductor-Controlled Rectifiers . .
2.4.2 Power Transformers . . . . . . . . . . .
2.4.3 Automatic Control Systems . . . . . . .
9
9
12
18
18
19
23
24
26
28
3 DIFFERENTIAL THERMAL ANALYSIS
3.1 Instrument Design . . . . . . . . . . . . . . . .
3.2 An Introduction to DTA/DSC Applications . .
3.3 Thermodynamic Data from DTA . . . . . . . .
3.4 Calibration . . . . . . . . . . . . . . . . . . . .
3.5 Transformation Categories . . . . . . . . . . . .
3.5.1 Reversible Transformations . . . . . . .
3.5.2 Irreversible Transformations . . . . . . .
3.5.3 First and Higher Order Transitions . . .
3.6 An Example of Kinetic Modeling . . . . . . . .
3.7 Heat Capacity Effects . . . . . . . . . . . . . .
35
35
40
46
49
49
49
60
63
66
70
vii
TLFeBOOK
...
CONTENTS
Vlll
Minimization of Baseline Float . . . . .
Heat Capacity Changes During
Transformations . . . . . . . . . . . . .
3.7.3 Experimental Determination of Specific
Heat . . . . . . . . . . . . . . . . . . . .
3.8 Experimental Concerns . . . . . . . . . . . . .
3.8.1 Reactions With Gases . . . . . . . . . .
3.8.2 Particle Packing, Mass, and Size Distribution . . . . . . . . . . . . . . . . . . .
3.8.3 Effect of Heating Rate . . . . . . . . . .
3.7.1
3.7.2
4 MANIPULATION OF DATA
4.1 Methods of Numerical Integration . . . .
4.2 Taking Derivatives of Experimental Data
4.3 Temperature Calibration . . . . . . . . . .
4.4 Data Subtraction . . . . . . . . . . . . . .
4.5 Data Acquisition . . . . . . . . . . . . . .
71
75
79
80
80
81
85
91
. . . 91
. . . 95
. . . 99
. . . 102
. . . 105
5 THERMOGRAVIMETRIC ANALYSIS
5.1 TG Design and Experimental Concerns . . . .
5.2 Simultaneous Thermal Analysis . . . . . . . . .
5.3 A Case Study: Glass Batch Fusion . . . . . . .
5.3.1 Background . . . . . . . . . . . . . . . .
5.3.2 Experimental Procedure . . . . . . . . .
5.3.3 Results . . . . . . . . . . . . . . . . . .
5.3.4 Discussion . . . . . . . . . . . . . . . . .
111
111
120
125
126
126
128
133
6 ADVANCED APPLICATIONS OF DTA
AND TG
6.1 Deconvolution of Superimposed Endotherms
6.1.1 Background . . . . . . . . . . . . . .
6.1.2 Computer Algorithm . . . . . . . . .
6.1.3 Models and Results . . . . . . . . .
6.1.4 Remarks . . . . . . . . . . . . . . . .
6.1.5 Sample Program . . . . . . . . . . .
6.2 Decomposition Kinetics Using TG . . . . .
..
..
..
..
..
..
..
143
143
143
144
146
151
152
159
TLFeBOOK
CONTENTS
ix
7 DILATOMETRY AND INTERFEROMETRY
7.1 Linear vs. Volume Expansion Coefficient . . . .
7.2 Theoretical Origins of Thermal Expansion . . .
7.3 Dilatometry: Instrument Design . . . . . . . .
7.4 Dilatometry: Calibration . . . . . . . . . . . . .
7.5 Dilatometry: Experimental Concerns . . . . . .
7.6 Model Solid State Transformations . . . . . . .
7.7 Interferometry . . . . . . . . . . . . . . . . . .
7.7.1 Principles . . . . . . . . . . . . . . . . .
7.7.2 Instrument Design . . . . . . . . . . . .
165
166
168
169
173
175
179
186
187
191
HEAT TRANSFER AND PYROMETRY
8.1 Introduction to Heat Transfer . . . . . . . . . .
8.1.1 Background . . . . . . . . . . . . . . . .
8.1.2 Conduction . . . . . . . . . . . . . . . .
8.1.3 Convection . . . . . . . . . . . . . . . .
8.1.4 Radiation . . . . . . . . . . . . . . . . .
8.2 Pyrometry . . . . . . . . . . . . . . . . . . . . .
8.2.1 Disappearing Filament Pyrometry . . .
8.2.2 Two Color Pyrometry . . . . . . . . . .
8.2.3 Total Radiation Pyrometry . . . . . . .
8.2.4 Infrared Pyrometry . . . . . . . . . . . .
I99
199
199
199
203
205
210
211
216
218
220
8
9 THERMAL CONDUCTIVITY
9.1 Radial Heat Flow Method . . .
9.2 Calorimeter Method . . . . . .
9.3 Hot-Wire Method . . . . . . . .
9.4 Guarded Hot-Plate Method . .
9.5 Flash Method . . . . . . . . . .
.........
.........
.........
.........
.........
10 VISCOSITY OF LIQUIDS AND GLASSES
10.1 Background . . . . . . . . . . . . . . . . . . . .
10.2 Margules Viscometer . . . . . . . . . . . . . .
10.3 Equation for the Rotational Viscometer . . .
10.4 High Viscosity Measurement . . . . . . . . . .
10.4.1 Parallel Plate Viscometer . . . . . . .
.
.
.
.
227
227
231
234
240
242
251
251
255
257
262
262
TLFeBOOK
CON TENTS
X
10.4.2 Beam Bending Viscometer .
.......
265
APPENDIXES
A INSTRUMENTATION VENDORS
269
A .1 Thermoanalytical Instrumentation . . . . . . . 269
A.2 Furnace Controllers and SCR's . . . . . . . . . 270
A.3 Heating Elements . . . . . . . . . . . . . . . . . 271
A.4 Optical Pyrometers . . . . . . . . . . . . . . . . 271
B SUPPLEMENTARY READING
B.1 Temperature Measurement. Ernaces.
2'73
B.2
B.3
B.4
B.5
and Feedback Control . . . . . . . . . . . . . .
DTA. TG. and Related Materials Issues . . . .
Manipulation of Data . . . . . . . . . . . . . .
Dilatometry and Interferometry . . . . . . . . .
Thermal Conductivity . . . . . . . . . . . . . .
B.6 Glass Viscosity . . . . . . . . . . . . . . . . . .
273
274
276
276
277
278
INDEX
279
TLFeBOOK
THERMAL
ANALYS I S
OF
MATERIALS
TLFeBOOK
This page intentionally left blank
TLFeBOOK
Chapter 1
INTRODUCTION
This monograph provides an introduction to scanning thermoanalytical techniques such as differential thermal analysis
(DTA), differential scanning calorimetry (DSC), dilatometry,
and thermogravimetric analysis (TG). Elevated temperature
pyrometry, as well as thermal conductivity /diffusivity and glass
viscosity measurement techniques, described in later chapters,
round out the topics related to thermal analysis. Ceramic materials are used predominantly as examples, yet the principles
developed should be general to all materials.
In differential thermal analysis, the temperature difference
between a reactive sample and a non-reactive reference is determined as a function of time, providing useful information about
the temperatures, thermodynamics and kinetics of reactions.
Differential scanning calorimetry has a similar output, but the
sample energy change during a transformation is more directly
measured. Dilatometry measures the expansion or contraction
behavior of solid materials with temperature, useful for studying sintering, expansion matching of constituents in composites
of materials or glass-to-metal seals, and solid state transformations. Thermogravimetric analysis determines the weight gain
or loss of a condensed phase due to gas release or absorption
as a function of temperature.
We will begin by reviewing methods of temperature measurement, furnace design, and temperature control. The instruments, how they work, what they measure, potential pit-
TLFeBOOK
2
CHAPTER 1. INTRODUCTION
falls to accurate measurements, and the application of theoretical models to experimental results will then be discussed in
some detail. Voluminous information on the results of thermal
analysis studies of specific materials resides in the literature, especially in the two journals specifically dedicated to the topic:
Journal of Thermal Analysis and Thermochimica Acta.
1.1
Heat, Energy, and Temperature
To begin, it is helpful to formalize our understanding of some
commonly used words: heat, thermal energy, and temperature.
It would be inappropriate to refer to an object as having
“heat”. Rather it would be stated that it is at a certain temperature or has a certain thermal energy. Heat is thermal energy in transit; heat flows across a boundary. If two objects at
different temperatures are placed in thermal contact, they will,
with time, reach a third equal temperature as a result of heat
flowing from the higher temperature object to the colder one.
The first law of thermodynamics, which is simply a statement of the law of conservation of energy, relates energy to
heat:
where U is the internal energy, Q is heat, a d W is work.
This equation states that the change in energy of a system is
dependent on the heat that flows in or out of the system and
how much work the system does or has done on it.
Often, slashes are put through the 8 s of the differentials on
the right hand side of the expression to emphasize a distinction
between derivatives of energy and heat (and work): If we wish
to know the (potential) energy change due to re-positioning an
object from a higher to a lower position above the ground, we
know it to be entirely a function of the difference in height,
multiplied by mass and gravitational acceleration. The path
the object traversed in going from its higher to lower position
TLFeBOOK
1.1. HEAT, ENERGY, AND TEMPERATURE
3
is irrelevant to the calculation. Functions showing such path
independence, such as energy, are referred to as state functions,
and their derivatives are exact differentials. This concept does
not hold for heat and work. The heat released by an individual,
or the work done by an individual in going from one place to
another would certainly depend on the path taken (e.g. a direct
path versus a more scenic route). Thus, these derivatives are
inexact differentials, and heat and work are path dependent
functions. There is no such thing as a change in heat or a
change in work, hence, the integrated form of the first law is:
AU=Q-W
Under conditions where no work is done on/by the system, the
change in internal energy of the system is equal to the heat
flowing in or out of it.
Joule’s experiments on the free expansion of an ideal gas
showed that the internal energy of such a system is a function
of temperature alone. For a real gas, this is only approximately
true. For condensed phases, which are effectively incompressible, the volume dependence on the change in internal energy
is negligible. As a result, the internal energies of liquids and
solids are also considered a function of temperature alone. For
this reason, the internal energy of a system may loosely be
referred to as the “thermal energy”.
The thermal energy of a gas is manifested as the translational motion of individual atoms or molecules. Energy is also
stored in gaseous molecules by rotation and vibrations of the
atoms of the molecule, with respect to one another. Solids sustain their thermal energy by the vibration of atoms about their
mean lattice positions, while atoms in a liquid translate, rotate
(albeit more sluggishly than gases), and vibrate. As temperature increases, these processes become more fervent.
Temperature is a constructed, rather than fundamental, entity with arbitrary units, which indicates the thermal energy
of a system. A thermometer measuring the outside temperaTLFeBOOK
CHAPTER 1. INTRODUCTION
4
ture functions via a series of materials' properties: Atoms in
the air impact against the glass of the thermometer, propagating phonons (lattice vibrations) through the glass to the
mercury. The increased motion and vibration of the mercury
atoms, causing a net expansion of the fluid up the graduated
capillary, is an indicator of the thermal energy of the gas on an
arbitrary scale: degrees Fahrenheit, degrees Celsius, Kelvin, or
degrees Rankine (the Kelvin analog on the Fahrenheit scale).
In the early 1700's, the Dutch scientist Gabriel Fahrenheit
designed what was generally considered the first accurate mercury thermometer where 0°F was the freezing point of saturated salt solution, presumably since this condition was more
reproducibly met than absolutely pure water, and 96°F was
its highest value (apparently related to body temperature) [II].
Mercury was used in place of its predecessor, spirits of wine,
due to its more linear thermal expansion behavior [2]. In 1742,
Anders Celsius designed a scale in which the value of zero was
assigned to the boiling point of pure water, and 100 was assigned to the freezing point. Later, the centigrade (the term
meaning divided into 100 parts) scale used the same divisions
but with the extreme values reversed. In 1948, this more familiar reversed scale was officially renamed the Celsius scale.
In the early 1800's, William Thompson (Lord Kelvin) established the thermodynamic temperature scale, whereby it was
proven that for a Carnot engine to be perfectly efficient, the
cold reservoir must be at a specific absolute zero (-273.15"C)
temperature. Measuring the properties of ideal gases used
as thermometers allows extrapolation to experimentally deter~~
'It can be shown [3] that the efficency of a Carnot engine doing work via heat provided
by a hot reservoir and rejecting waste heat into a cold reservoir, is r] = 1- ( Q c o l d / Q h o t ) =
1 - ( T c o l d / T h o f ) . Thus for 7 = 1, perfect efficiency, Tcold must be at an absolute zero
in temperature. Negative temperatures are not possible since an efficiency greater than
unity is not possible. This relation can be derived explicitly using the ideal gas law, and it
follows that the temperature used in the ideal gas law is based on this scale. By trapping
an ideal gas (real gases at low pressures behave as ideal gases) in a capillary with mercury
above it, the gas is at constant pressure. The volume of the gas can be measured at various
temperatures, the latter measured on an arbitrary scale such as "C. Extrapolating to zero
volume establishes the absolute zero of temperature (-273.15OC).
TLFeBOOK
1.2. INSTRUMENTATION AND PROPERTIES OF MATERIALS
5
mine the absolute zero in temperature.
Finally, the relationship between heat and temperature follows an Ohm's law form2:
dQ = k'(T2 - Tl)
-
dt
where heat flows in response to a temperature gradient (k' being the proportionality constant), analogous to electrical current flow ( d Q / d t ) through a resistive medium (l/k') as a result
of a potential difference (T2 - Tl). Perhaps the most useful definition of temperature is as a thermal potential for heat flow,
just as voltage is an electrical potential for current flow. The
relationship between heat flow and temperature becomes more
complex than that above when non-steady state heat flow, geometries, surfaces, convection, radiation, etc., are considered.
However, the general principle is still the same; heat flows as a
result of a temperature difference between two regions in thermal contact.
1.2
Instrumentation and Properties
of Materials
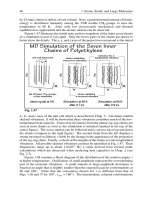
Pyrometric cones (Figure 1.1) have been in common use over
the past century in the manufacture of ceramic ware. They
are a series of fired mixtures of ceramic materials pointing 8"
from vertical, which "droop" after exposure to elevated temperatures for a period of time. The manufacturer [4] provides
a series of sixty-four cone numbers ranging from 022 (deformation at 576°C at a heating rate of l"C/min) to 42 (over
1800"C).3By placing a series of cones near the firing ware in
a kiln, the operator can determine when firing of the ware is
complete, even when the furnace temperature is only loosely
controlled. The refractories industry has made cone shapes out
'This equation is valid for steady-state one-dimensional conductive heat flow.
3The lower temperature cones tend to have a high percentage of glassy phase of rapidly
decreasing viscosity with increasing temperature.
TLFeBOOK
6
CHAPTER 1. INTRODUCTION
Figure 1.1: Orton pyrometric cones [4].
of their materials and correlated the points of collapse under
thermal processing t o pyrometric cones, in order to designate
their products with “pyrometric cone equivalents”. Pyrometric
cones are a prime example of the use of well characterized materials for the investigation and optimization of other materials.
While seeming more elegant, t hermoanalytical instruments are
based on the same principle.
The accurate measurement of thermal properties, e.g. heat
flow through a material, energy released during a transformation, expansion upon heating, all require an underlying understanding of the instrumentation of thermal analysis. The functionality of the devices themselves, however, require calibration
based on the exploitation of material properties, e.g. the thermoelectric behavior of thermocouples, or the melting points
of calibration standards. The meticulous scientist must never
permit accuracy of measurement to rely on elegant, computerinterfaced instrumentation, without the prior blessing of the
reproducible properties of well characterized materials.
TLFeBOOK
REFERENCES
7
References
[l] The Temperature Handbook, Volume 27, Omega Corp.,
Stamford, CT (1991).
[2] T. D. McGee, Principles and Methods of Temperature
Measurement, Wiley-Interscience, NY ( 1988).
[3] W. J. Moore, Physical Chemistry, Fourth Ed., Prentice
Hall, Englewood Cliffs, NJ, pp. 81-83 (1972).
[4] The Properties and Uses of Orton Standard Pyrometric
Cones and Bow to Use Them for Better Quality Ware,
Edward Orton Jr. Ceramic Foundation, Westerville, OH
(1978).
TLFeBOOK
This page intentionally left blank
TLFeBOOK
Chapter 2
FURNACES AND
TEMPERATURE
MEASUREMENT
Although there are a myriad of devices used to measure the
temperature of an object, thermal analysis instruments predominantly use thermocouples, platinum resistance thermometers, and thermistors. Thus, only these items, with special
emphasis on thermocouples, will be discussed.
2.1
Resistance Temperature Transducers
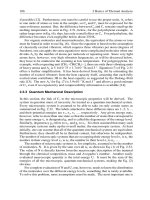
A sketch of the behavior of two resistance temperature transducers with increasing temperature is shown in Figure 2.1.
The electrical resistance of a metal increases with temperature,
since electrons in a metal, similar in behavior to the molecules
in a gas, are more agitated at higher temperatures. This greater
kinetic motion decreases individual electron mobility. Thus,
under an applied electric field, net electron drift in response to
the field is diminished. For platinum, this increase in resistivity with temperature is remarkably linear. Platinum resistance
temperature detectors often consist of spirals of a very thin
wire, designed to maximize the measured resistance (commonly
1000 at O'C). They are fragile but considered quite accurate.
The Perkin-Elmer differential scanning calorimeter uses this
9
TLFeBOOK
10 C H A P T E R 2. FURNACES A N D TEMPERATURE MEASUREMENT
400
+
400
n
Thermistor
38
300.
Ea
z
g
‘8
EL
n
f
i!
200-
-200
4
b
Y
v)
.
I
-100
100-
0
-300
0
300
600
s
’0
900
Temperature (‘C)
Figure 2.1: Thermal behavior of a thermistor [l] and a platinum resistance
temperature detector (RTD) [2].
device as a sample and reference temperature transducer.
A thermistor is a semiconducting device which has a negative coefficient of resistance with temperature, e.g. its resistance decreases with increasing temperature. The principles
behind its operation follows.
The (quantum mechanically) permissible energies of electrons in a solid lattice are constrained by the Pauli exclusion
principle, which states that no two interacting electrons can
be in the same quantum state. Envisioning atoms approaching
from infinite separation to form a solid, their electrons begin t o
interact, and the permissible electron levels split into a multitude of states with a multitude of energies (Figure 2.2). These
energy levels become so closely spaced in certain regions of the
energy spectrum that they are treated as being continuous and
referred to as “bands”. Other regions of energy become devoid
of permissible states; the region marked Es in the figure is the
“band gap”. As atoms assemble to their equilibrium lattice positions, the energy spectrum for semiconducting materials can
be represented by the simplified drawing on the left in FigTLFeBOOK
11
2.1. RESISTANCE TEMPERATURE TRANSDUCERS
Conduction
Band
I
Carbon Atoms:
6 ElectrondAtom
N Atoms; 6N Electrons
E,
E”
..................
................
................
0
.
.
.
.
.
.
.
0
.
.
0
.
.
.................
................
4N
ti!
&
8
w
9
1
Valence Band
2NStates
Is
Diamond Lattice
Equilibrium Spacing
Atomic Separation
r
Figure 2.2: Band diagram in a semiconductor, diamond-structured carbon
used its an example. In the left-hand drawing, the bottom line refers to the
top of the valence band and the top line refers to the bottom of the conduction
band [3].
ure 2.2. The low-energy portion of the spectrum, referred to
as the “valence band”, is predominantly filled with electrons,
all bound to atoms. Above the band gap is the “conduction
band”, which consists of a series of permissible energy states
which are predominantly empty. Electrons with energies in the
conduction band are unbound, similar to electrons in a metal.
The important property of a semiconductor is that with increasing temperature, adequate thermal energy is provided to
excite more electrons from the valence band to the conduction
band, increasing the material’s electrical conductivity.
‘Insulators (e.g. Alz03) are characterized by large band gaps; thermal excitation of
electrons is not adequate t o permit electrons to assume a state in the conduction band,
hence the electrical conductivity of such a material is very low. Conversely, conductive
substances, such as metals, have ground state electrons occupying states in the conduction
band. Hence, thermal excitation is not required for such a material to be conductive.
TLFeBOOK
12 CHAPTER 2. FURNACES A N D TEMPERATURE MEASUREMENT
In the sharply dropping region of their resistance-temperature
characteristic, thermistors show a significant sensitivity to small
temperature changes (Figure 2.1). However, since much of their
characteristic is essentially flat, they have a limited useful temperature range. Thermistor-based devices are commonly used
for room temperature compensation of thermocouples, which
will be treated in the following discussion.
2.2
Thermocouples
Thermocouples are the most commonly used temperature measuring device in elevated temperature thermal analysis. Thermocouples are made up of two dissimilar metals. If the welded
junctions between the two materials are at different temperatures, a current through the loop is generated. This phenomenon citn be explained by visualizing electrons in a solid as
analogous to a gas in a tube (Figure 2.3).
A
A
e
,....*
-...
.,. .:.
. .
.. ...
I
.
hot
e'
--+ !
connect
I
B
electron density
B
Figure 2.3: Free electron model of thermocouple behavior.
TLFeBOOK