Behavioral intention in revisiting hospital under the effect of expertise, reputation and service quality
Bạn đang xem bản rút gọn của tài liệu. Xem và tải ngay bản đầy đủ của tài liệu tại đây (684.13 KB, 39 trang )
Behavioral Intention In Revisiting Hospital Under The Effect
Of Expertise, Reputation And Service Quality
Pham Bao Duy
International University, Vietnam National University HCMC, Vietnam
Nguyen Tan Loi
Eastern International University, Vietnam
Ho Nhut Quang
International University, Vietnam National University HCMC, Vietnam
Abstract
The well-noted extensive solution for strengthening the hospital’s obstacles from various
perspectives are
seeking in Vietnam context. Considering the foothold of medical industry formulated by
government, the
medical industry grants as sustainable fundamental development observed through FDI and
governmental
equity with shaky restriction. As strikingly demands in healthcare services, private and public
hospitals in
Vietnam, however, divulge the noticeable missing pieces are service quality, trust and satisfaction in
arousing
rehash visitors whom reveal the disavowal through pursuing highly experience expectation in
comprehensive
alternatives. Consequently, the deeply understanding in the rehash patients’ behavioral
intention, especially,
with further with appealing unfamiliar one is envisaged vital pharmaceutical to intensify
specifically
hospitals’ aspects. Methodically, quantitative research spread out the study in advance, the
sample size
accounted at 316 processing in Explanatory Factors Analysis and deeply exploiting by
Structural Equation
Modeling method. The outcomes spotlight the significant initial effect of independent
dimensions in
reputation and expertise toward trust, service quality toward satisfaction as well as towards
behavioral
intention in revisiting the hospital. Undoubtedly, there are some recommendations toughen up
specifically
the retained problems for hospitals in Vietnam.
Keywords: Vietnam Healthcare, Service Quality, Expertise, Behavioral Intention in
Revisiting, Hospital in Vietnam, Sustainable Development.
1. Introduction
Healthcare has long been the initial service for human, which provides significant purposes
in examination, prediction, treatment and control the health. According to the former
researches, it is considered as the high level of association services (Hogg, Laing, & Newholm,
2004). In some emergency situation, the hospital is not only considered as the place for health
improvement and examination but also become the crucial place for saving a life. Therefore,
the high level in emotional vulnerable following with the hazard is not deniable (Jadad, 1998).
According to General Statistic Office in Vietnam, there are 1,101 hospitals in 2012 and higher
36% compared with the statistics in 2007. In addition, the number and scale of corporation and
organization operating in medical and health care field such as Hoan My, VinMec and TMMC has
been increased in recent years. It
621
provides the proof that the importance and attention of medical industry in Vietnam. However,
with the interesting figures demonstrated in the recent report, the fundamental right – basic
healthcare would be not considered as the right in developing countries included Vietnam
where people from rural areas, even the government spend hundreds of million dollars in
medical industries which mostly focus on facilities’ expansion and improvement in suburban.
In other sides, according to Vietnam 2035 general report has been posted by World Bank and
Ministry of Planning and Investment in Vietnam, it shows directly that the proportion of GDP shares
6% for medical and health care over 2 decades from 2015 to 2035. While GDP and the growth rate
have been reported outstanding positively increasing whereas the out-of-pocket spending in medical
still appeared with 49%, it shows the importance of medical fields among people even the total
expenditure must be paid by their money
According to WHO, the bed occupancy rate should not be over 80% of the hospitals’ capacity.
Vietnam, however, witnessed a high occupancy rate especially in large cities. A research of “Study
on Current Situation of Overcrowding, Under-Crowding in Hospitals at Levels and Recommended
Solutions for Improvement” of Ministry of Health in 2011 demonstrates that central and provincial
hospitals always in overcrowding situation. It is in the ranged from 120-150% of the hospital beds
used and some special cases over 200% in big central hospital in Ho Chi Minh city and Ha Noi
capital. According to the research of PricewaterhouseCoopers (Vietnam) Ltd. Company called “The
Vietnamese healthcare industry: moving to next level”, it mentioned the overload services in large
and popular hospitals in Vietnam while remote area hospital and regional polyclinic in suburban is
lack of patient. Moreover, it agreed that Vietnamese tends to approach national hospital instead of
provincial hospital due to the mindset in lack of quality in medical staff and medical equipment.
Following the article “The poor still miss out on healthcare in Vietnam” published in 2015 on
Joint Learning Network – The global community of health systems practitioners and
policymakers in 27 countries including Vietnam, it stated that “Health Care Fund for the Poor”
is signed in 2002 under the Decision 139 signed by Prime Minister of Vietnam in order to
support the healthcare service Vietnam especially people live in communes. However, this
program was not appreciated by World Bank, the research “Health Insurance for the Poor: Initial
Impacts of Vietnam’s Health Care Fund for the Poor” found that the reduction of out-of-pocket
spending has not happened
According to a recent survey by the Ministry of Health, every year around 40,000
Vietnamese go abroad for health treatment purpose and spend $1 billion in 2010 and nearly $2
billion for total expenditures in early 2016. It raises the problem that whether hospitals in
Vietnam still not meet the needs of domestic demand in health care purpose even 6% of GDP
in Vietnam spend for medical as mentioned above. In addition, in Vietnam, the average people
make the out-of-pocket payment for health care is almost accounted for 75% the total
spending in health care (Knowles et al. 2005). According to the research of Gludner and Rifkin
in 1993, private healthcare provider appealing the demand of people who have intend in
healthcare service as the public service is deficient and imperfect, the case of Vietnam and
Uganda.
2. Literature Reviews
2.1. Service Quality
Service quality is a measurement on the matching between services delivered and
customer’s expectation. Service quality must be delivered that match with customer
expectation on a reliable basic (Lewis and Booms, 1983)
Unfortunately, the evaluation for service quality in the scale that built-up through previous
study for healthcare industry has been on the rocks. Instead of the value comes from the result
of health care, patients do not completely evaluate the comprehensive problem in service
quality through their perspective. In addition, some sectors found many difficulties to
determine whether it will be added on the service quality
622
assessment or not such as the emergency affected to the probability in survival or vegetable
existence, the question is not able to figure out people who responsible to assess the
evaluation. In addition, the lack of skill also expertise to define the service whether it was
conducted following the process or not (Newcome, 1997; Williams, 1994). As a result, hospitals
take their advantages in the evaluation of patient with the misleading in technical service
quality aspect (Bowers et al., 1994; Ettinger, 1998; Donabedian, 1988), focus on the interaction
between patients and physicians and approach with potential customer with the misleading of
former evaluation.
According to Bowers et al. in 1994, they suggest that the scale of service quality in patient’s
determinant take important role in their satisfaction through SERVQUAL model. Before the
Bower and his partners’ findings, a former study also used SERVQUAL in implication in the
antecedent of service quality in satisfying patient (Reidenbach and Sandifer-Smallwood, 1990).
It is explained from another study in health care service industry that “As a construct, customer
satisfaction has been noted as a special form of consumer attitude; it is a post-purchase
phenomenon reflecting how much the consumer likes or dislikes the service after experiencing
it” (Woodside, AG. Frey, LL. and Daly, RT., 1989). It comes to the first hypothesis:
Hypothesis 1. A service quality of hospital is positively related to patient’s (customer’s)
satisfaction
In health care research, SERVQUAL scale is the precursor model for evaluating the outcomes
behavioral intention comes from service quality (Reidenbach and Sandifer-Smallwood, 1990),
and other variant model with the same result, for example, Headley and Miller developed 6dimensional based on primitive SERVQUAL model in 1990. It can be seen obviously that the
service quality is a significant dimension not only satisfy customer but also attract customer in
repurchasing service or product.
Hypothesis 5. A service quality of hospital is positively related to patient’s (customer’s)
behavioral intention in revisiting hospital.
2.2. Satisfaction
In 1980, Oliver built the definition that “In brief, customer satisfaction is a summary cognitive
and affective reaction to a service incident (or sometimes to a long-term service relationship).
Satisfaction (or dissatisfaction) results from experiencing a service quality encounter and comparing
that encounter with what was expected”.
To analyze the level of satisfaction that customer measured based on service, product that
provided by an organization through figures based on questionnaires and feedback from the
frontline staff. It could be the positive judgments’ outcome from using a product or service from
customer perspectives (Westbrook, 1980). Related to the definition, it suggests that
satisfaction is the emotional evaluation, it is a chain of individuals’ assessment rather than an
individual perspective (Cronin and Taylor, 1994; Hunt, 1977). The scale of satisfaction is
defined from dissatisfying to satisfying where other arguments implicate that the customer
satisfaction assessment proves a comprehensive evaluation than the specific outcome of a
transaction.
According to Singh and Sirdeshrnukh (2000), customer’s experiences is defined as the
directly evaluation on some cues which included satisfaction. Based on implicit and explicit
cues, customer can gradually formulate the trustworthiness with firm (Doney and Cannon
1997). If build up a strongly satisfaction from customer, customer may have more confidence
with the firm, which is the basic for increasing their trust on service provider. Thus,
Hypothesis 4. A patient’s (customer’s) satisfaction is positively related to their trust in
hospital.
Satisfaction is the factor that combine many antecedent elements, when customer’s
satisfaction increased, it leads to the last variable, repurchasing intention or it can be
considered as sub-dimensions of customer loyalty (Kitapci, Akdogan, & Dortyol, 2014). In
medical industry, there are varied study that mentioned this relationship which shows the
impact of satisfaction on behavioral intention (Anderson and Sullivan, 1993; Bitner, 1990;
Reichheld, 1996; Woodside and Shinn, 1988; Woodside et al., 1989). Considering customer’s
satisfaction as the intermediate variable, majority of studies suggests that there were the
indirect influences
623
between the behavioral intention and service quality where using value and satisfaction as the
mediate factor (e.g., Anderson and Sullivan, 1993; Gotlieb, Grewal, and Brown, 1994; Patterson
and Spreng, 1997; Roest and Pieters, 1997; Taylor, 1997). Hence,
Hypothesis 6. A patient (customer’s) satisfaction is positively related to their behavioral
intention in revisiting hospital.
2.3. Trust
Trust comes from the belief of a party’s promise or sentence is reliable and the obligation
that party need to be fulfilled in vice versa for relationship purpose (Schurr and Ozanne, 1985).
Based on the trust, the interaction of a buyer’s perception future and service provider (seller) is
anticipated (Doney and Cannon, 1997). It creates a long-term orientation of a relationship B2C
in positive ways (Ganesan, 1994). The trust’s advantages which create strong relationship in
business has been researched in the literature review of Morgan and Hunt in 1994. The
individual experience is considered as the trustworthy source rather than the referral from
relatives or friends which is explained as the second-hand trust referral or the popular.
Building trust efforts is core value of all business in general and hospital service in specific,
the results from this long journey is the substantial development where customer loyalty and
attraction are not deniable. There are some evidences show the behavioral intention in
repurchasing services, products are the origin of trust (Morgan and Hunt, 1994; Chaudhuri and
Holbrook, 2001). As trust shows confidence in looking for new customer as the reliability and
integrity has been prepared, it is the main component for long-term relationship orientation as
it moves the focus in present to continuity and future conditions (Doney and Cannon, 1997;
Ganesan, 1994). Therefore, it results in a hypothesis that:
Hypothesis 7. A patient (customer’s) trust is positively related to their behavioral intention in
revisiting hospital.
2.4. Expertise
Knowledge and experience of service providers in the main services are two terms that
typically measure in expertise (Crosby el at., 1990). In Medicine and Surgery perspectives, the
expertise requires a mastery in relevant skills also the diversity of knowledge in many aspects.
Unlike other fields, physicians require the diverse knowledge such as biology, chemistry,
physics as the basement and up-to-date their specialization that they pursuit from the
beginning. Besides, ethics, cognitive and motor must be consistent interpersonally according to
their leaning in behavior and responsibility. Moreover, clinicians require higher level in their
enormous knowledge not only in their specialization but also conduct the relevant field from
pharmacist to the surgeon. Considering medical diagnosis is the general skill of the physicians,
the expertise of the doctors is defined through the accuracy of medical diagnosis because the
combination of higher experience and knowledge are deeply and varied (Feltovich et al., 1984;
Neufeld et al., 1981)
A study found that the source of credibility and trustworthiness is the results of individual’s
perception on level of expertise, it implicates a positively effects on trust (Busch and Wilson,
1976). In other words, the level of experts creates the trust’s foundation. According to the
research of Crosby, Evans and Cowles in 1990, trust signal was founded from the expertise’s
perception of customer. It can be related to the trustworthy company where the appearance of
relationship between expertise and trust create positively effects (Newell and Goldsmith,
2001). In specific of hospital service, the expertise is the undeniable role which contribute to
the decision and recommendation on customer’s health. The enhancements in trust are
depending in the major of the expertise which provide the skilled-set learned from the
perennial experience and qualifications or highly achievements in their professional career.
Therefore,
Hypothesis 2. A worker’s expertise in hospital is positively related to patient’s (customer’s)
trust.
624
2.5. Reputation
The customer’s belief and trust that the firm is truthful and equitable is defined as firm
reputation (Doney and Cannon, 1997). In widely views, it is a general overview measurement of
a corporate or a firm in level whether it is “good” or “bad” (Weiss, Anderson, & MacInnis, 1999;
Roberts & Dowling, 2002). In the sense of reliability, reputation is defined as the collective
opinions which evaluate positively the trustworthiness and it results in the individual’s
perspective in what they believed or positive said about the firm’s character (Freeman, 1979).
Hospital’s reputation could be directly affected by concrete financial problems, even the
professional pride is highly attracted by a motivating factor. In specific, the sponsor and
investment from corporate and individuals are founded as the huge amount to maintain the
operation. Especially in human health service sector, it is necessary to concentrate on the
corporate reputation due to the dense of customer relation which is the most problematic
affected customer perspectives to the hospital (Chase, 1978).
In previous research, it implicated that the customer’s evaluation on reputation of a service
provider will positively impact on the acknowledgement on firm’s trustworthiness through
information transference process (Doney and Canon, 1997). A study of Devon Johnson and Kent
Grayson in 2005 suggested that firm reputation is the antecedent of both affective and
cognitive trust, “customer who is not yet sufficiently familiar with a service provider may
extrapolate his/her opinions directly from the reputation of the firm”. Hence, the hypothesis is
built,
Hypothesis 3. A hospital’s reputation is positively related to patient’s (customer’s) trust.
2.6. Behavioral Intention
The decision that intend to perform in a specific way is considered as intention (Fishbein and
Ajzen, 1975). A person who have their subjective perception ability that he or she will enjoy in a
given behavior is defined as behavioral intention (Committee on Communication for Behavior
Change in the 21st Century, 2002). In other way, it can be the level that a person has built selfconscious intention to engage or not engage with some specified future behavior, it is a signal
about the customer future’s behaviors (Venkatesh et.al., 2003; Lai and Chen, 2011)
Through previous research, it was definite to believe the important role of conceptual
framework in study. The model was prompted and changed by related empirical studies in a
health care service provider which can apply in Vietnam context.
625
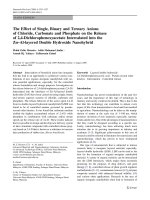
Service Quality
H1(+)
H5(+)
Satisfaction
Behavioral Intention
H6(+)
H4(+)
Expertise
H2(+)
Trust
H7(+)
H3(+)
Reputation
Figure 6: Conceptual Model
3. Methodology
3.1. Research Method
Qualitative and quantitative methods are considered two main method in processing the
research for various purpose, especially in achieving knowledge from the study (Ritchie and
O’Connor, 2004). The quantitative research is supported from the statistics where it can
retrieve from the primary or the secondary data such as survey, questionnaires or previous
data. Meanwhile, the qualitive research method based on the evaluation of themes which is
retrieved from the observation or interview. In other words, it is the unmathematical method. In
2001, Soguno suggested that the objectives of the study were able to express clearly which
could bring back to the society the enhancement in general views in many aspects also the
effect of each other.
In this study, quantitative research was selected to go further. With the same goals that
qualitative research delivering, the goals focus on the solution, recommendation based on
society problems, concerns or the supporting in further research for other developing
quantitative potential approach. Besides, the quantitative methods delivered a deeper insight
or different aspects the problem that the study concerns which support for sociologist or the
experts in various industry. In other words, it could not be rejected that it provided the
comprehensive conclusion and recommendation for social problems or concerns especially.
Meanwhile, it went further with other research that give a deeper knowledge in the phenomena
following the research of Strauss and Corbin; Lundahl and Skärvad in 1998 and 1999
respectively. It can be pointed out the common collecting data in quantitative method such as
deliver survey through paper form, online form, telephone interview or face-to-face interview.
Moreover, the collection can be assessed through email, pop-ups website ads. In other words,
there are various ways to conduct the data for quantitative research. On other views, due to
the various ways in collecting data, it tended to apply popular with a significant sample size at
the short period comparing to the qualitative research method.
626
3.2. Subject
The data was collected through paper research in site location, no any online form is
accepted on this research due to integrity and reliability of the research also the characteristics
of the dependent variables which focus on the patients have already visited one of among four
hospitals mentioned below. Vinmec Central Park International Hospital which is accounted for
178 operating beds with the mission of “Delivering first-class healthcare service”, Vinmec is
considered as the hospital have the best hospital’s service quality in Vietnam. Secondly, Hoan
My hospital which is belonged to Hoan My Medical Corporation. In Vietnam, Hoan My is leading
the private healthcare network where 13 hospitals and 5 clinics has been established since
1999, there are 808 doctors and 3918 full-time employees are working in among these
hospitals. Also, it accounted to 2399 beds are in operation and the limitation over 3407 beds. In
Ho Chi Minh city, Hoan My Hospital was allocated in Phu Nhuan district which serves daily over
2,000 patients with the capacity up to 261 beds. Thirdly, HCMC University Medical Clinic which
was one of the most trustful destination of the patient where it serves over 2 million of patient
annually. With 3 centers were allocated in around the city, they proudly to be one of the largest
operating beds capacity in Ho Chi Minh city at over 1000 operating beds. Moreover, the
hospital is well-known as the medical center having more than 100 professor and vice professor
involved in medical examination and treatment. Finally, 175 Military Hospital which is
considered as the big central hospital in Vietnam that apply modern technique in healthcare
process, 175 Military Hospital is highly appreciated from the respect of doctor whom most of
them begin their career in military where ethics and behaviors is strictly applied. In 2018, the
hospital is expected to upgrade the operating bed scales up to 1,500 after the newest building
is delivered in operation. There are 350 questionnaires had been delivered to the patients, and
there are 316 valid respondents accounted at 90.3%. The sample size included age range from
18 to over 55 where the outcome placed mostly in the 26-35 age group. Over 316 valid
respondents, 52.85% of them are female accounted for 167 people. Patients in the final sample
focused on the income level from 10 to 20 million VND at 42.72%.
3.3. Sample Size
According to the research of Gorsuch; Hatcher in 1983 and 1994 respectively, the ratio
should be allocated in 1:5 where 1 items is answered by 5 respondents in EFA analysis which is
also tested in this study for further validating. In other words, with 40 items, the samples size
is required to approach at 200 units. Moreover, supporting from the research of Comfrey and
Lee in 1992, he found that by assessing the sample size higher than 300 units, it can result in
the great research outcomes, meanwhile, the lower one is not quite appreciated. Hence, it
comes to the decision that the valid sample size must be 316. Some data was eliminated due
to the invalid data, the paper survey must be higher than the number mentioned above.
3.4. Measures
In scaled question, it cannot be denied that the Likert Scale is the most appropriate method
to apply for conducting the survey purpose. Which is raised and promoted through the research
of Rensis Likert in 1932. However, the Liker Scale provided the various of measurement scale
from 2-10, it results in the complicated decision to determine which scale is better for this
research. Although, most researches apply 5-point scales for assessing their data through
questioner, there are some evidences show that 7-point measurement scales which could
provide stronger correlations between one another items in t-test outcomes (Lewis, 1993).
Applying the Theory Planned of Behavior (TPB) in 2002, Ajzen not only provided the instruction
in applying the behavioral intention item in the study but also point out that 7-point scales are
preferable when constructing the factors around behavioral intention. Besides, the
demographic data giving the general information for the receiver to have a comprehensive
evaluation about the sample.
627
Construct
Sub-scale
Item
Measurement
SQCP1
There were many signboards in hospital
Service
Quality of The SQCP2
Process
Concerns
SQCP3
(SQCP)
SQCP4
SQCP5
SQHC3
The payment procedure was quick and
simple
The hospital’s employee nurses and
are
,
doctors
friendly
They are willing to help me as much as they
could.
They explained medication process well
SQHC4
They were really cared about my health
Service
SQHC1
Quality of The
SQHC2
Hospital
Service Quality
Concerns
(SQHC)
Service
Quality of The SQDC1
Doctor
Concerns
(SQDC)
Service
Quality of The
SQDC2
SQDC3
SQT1
SQT2
Tangible
Concerns
(SQT)
SQT3
SQT4
EXP1
EXP2
Expertise (Exp)
The process for taking queue number for
health
examination was quick and simple
I did not have to wait long for medical
examination
from
physician
The lab test was done in a prompt way
EXP3
EXP4
EXP5
The doctor gave an explanation sufficiently of
my
problem, lab test’s result and treatment
process
The doctor was willing to answer many
questions,
enough to understand everything
The doctor made me feel comfortable
The waiting areas for examination and
treatment
were wide and pleasant
It was easy to access amenities (e.g., canteen,
ATM)
The parking lots wer always available for
e
stakeholders
hospital’s employee,
(e.g.,
nurses,
doctors, patients,
relatives)
The hospital was equipped with the latest
care
equipment and facilities (e.g. lifts, air
conditioners)
The physicians were knowledgeable and
highly
educated
The physician instructed and explained fully
clear
and understandable about concerns
The hospital applied latest research,
techniques and
methods in medical examination and
treatment.
The hospital’s employee and nurses were
welleducated in responding any situation
The hospital’s employee, nurses and
physicians
were well-known about his/ her responsibilities
and
obligations
REP1
REP2
REP
REP3
REP4
TRS1
TRS
TRS2
TRS3
The hospital was highly regarded in
Vietnam
The hospital was known as the one of the most
capable hospital in Vietnam
The hospital had positive posts and comments
on
media (e.g. journals, news, television,
scientific
conference, social networks)
My friends, families and relatives positively
know
about this
hospital
I had no reason to doubt about physician’s
advice.
I absolutely believed in the lab test
and
examination’s
result.
I would feel a sense of improper result if I used
treatment and examinations of other
hospitals
628
TRS4
TRS5
SAS1
SAS
SAS2
SAS3
SAS4
SAS5
BEI1
BEI2
BEI
BEI3
BEI4
BEI5
I feel the physician understand and respond
caringly
and specifically my condition.
I feel more comfortable and safe when I was
taken
care of nurses in this hospital
I satisfied about facilities and equipment in
the
hospital.
I satisfied about the hospital’s staff behavior.
(e.g.
doctors, nurses, employee)
I satisfied about the hospital’s expertise.
I satisfied with my experience in treatment
and
examination that I received in the hospital.
I satisfied with my decision to choose the
hospital
I will recommend friends; family members
and
relatives should use service in this hospital
If I needed medical services in the future, I
would
consider this hospital as my first choice.
I will tell other people good things about
this
hospital
I do not care about the distance between my
home
and this hospital if I needed medical services
in the
future
Even price increased, I still choose this hospital
as the
primary medical services.
Table 16: Measurement Scales
3.5. Process of Data Analysis
In this study, AMOS (version 20.0) and SPSS (version 21.0) are two tool-kit has been applied
for extracted the raw data collected from the respondents through the survey on-site.
Particularly, SPSS support in figure out the descriptive statistics not only for demographic data
but also for the scaled questions. For ensuring the validity and reliability of the study also the
model, this research is verified from SPSS to AMOS. In specific, the reliability of this research
would be tested through the Cronbach’s Alpha and Corrected Item – Total Correlation. Before
moving the model and data to AMOS, the testing in EFA is required for validation purpose
where it test the validation of items and group of items called factors in Promax methods, this
output was used as the default model purpose in Pattern Matrix Model Builder of AMOS’s
plugin. The default model is built to understand whether the validation and reliability is
accepted on this first testing in the AMOS – called CFA, also checking the application of model
in population between factors including observed and latent. After conducting the CFA, the
model was formulated in SEM where the test is conducted for checking the complicated
relationship among unobserved and latent variables.
4. Data Analysis and Results
4.1. Sample Characteristics
Following the methodology, the survey has been delivered on-site among 4 hospitals
mentioned above. As online survey has not been used, the paper surveys have been
transferred to Excel where allow writer to analyze the data. Unfortunately, there are 316
among 350 surveys have been conducted is valid. Invalid questionnaires are come from mostly
people misunderstanding in scaling question also the routine in not
629
following the instruction has been implemented before conducting. In short, 90.3% data is
analyzed in deeper testing.
FREQUENCY
316
34
VALID
INVALID
PROPORTION
90.3%
9.7%
Table 17: Response Rate
It can be observed directly that the proportion of Female is higher than Male at nearly
52.85% while another computed at 47.15%. Particularly, it can be seen from the pie chart that
women tend to concern about these problems rather than men. Continually, it can be seen that
people in the two ages group: 26-35 and 36-45 accounted for more than 55% of the
respondents. It means that people in those age quite concern about their health rather than
other age group. People with the higher age group is lower as they are unwilling to conduct the
test while their relatives are responsible to handle it. In general, about the income level, two
those income levels group below 10 million and 10 – 20 million accounted more than 83%
where half of them belongs to each other. It can be explained that the vary of income level
approach this study.
Evaluation
Gender
Age
Income Level
Criteria
Male
Female
1 – 25
8
2 – 35
6
3 – 45
6
4 – 55
6
Over 55
Below 10 million
1 – 20 million
0
Over 20 million
FREQUENCY
149
167
60
PROPORTION
47.15%
52.85%
18.99%
91
28.80%
88
27.85%
24
7.59%
53
131
135
16.77%
41.46%
42.72%
50
15.82%
Table 18: Demographic Analysis
4.2. Preliminary Analysis
It can be seen from any research that the reliability test takes an important role to evaluate
whether the research can be trustable, consistent and reliable or not. By considering through
internal consistency measured by the Cronbach’s Alpha which is formulated and implemented by
Lee Cronbach’s in 1951. Basically, most of researchers have the agreement that Cronbach’s Alpha
index of the data must at least in the range between 0.6 and 0.7 which is examined as an
acceptable point, also it could be pointed out through the study of Slater (1995), Peterson (1994)
also Nunnally (1978). Besides, the reliability test including another tool that support in the
increasing of the Cronbach’s Alpha and the reliability of the research. Based on the valued in
Corrected Items – Total Correlation, it can be seen clearly that whether factors affect inversely to the
reliability test or not. According to the research of DeVellis in 1991, the figure Corrected Item – Total
Correlation have the point which is lower than 0.3 would be removed in order to increase the
reliability. In other meanings, Corrected Item – Total Correlation tools would be a helpful tool to erase
the item that downgrade the Cronbach’s Alpha of the factor for increasing the reliability in purpose.
According to the output, the corrected items – total correlation of all items in 9 variables have the
lowest point at 0.565; therefore, it created a huge gap between the risk point and the research when
one item among these meet the corrected items – total correlation at 0.3. From the highest to the
lowest point with Cronbach’s Alpha, the Cronbach’s Alpha of Reputation, Trust, Satisfaction,
Behavioral Intention, Service Quality in Convenience Concern, Expertise, Service Quality in Health
Care's Provider Concern, Service Quality in Tangibles and Service Quality in Doctor’s Concern are
630
0.920, 0.912, 0.913, 0.901, 0.898, 0.893, 0.891, 0.876, 0.871 and 0.833 in respectively. Above
all, evaluation tools including the Cronbach’s Alpha and Corrected Items – Total Correlation
show that the need for removing items to enhance the reliability and consistence of the
research are not appeared.
[Table 4 in here]
Besides, factors analysis is a diagnostic tool that combine the diversity techniques in term of
statistic for estimating the level of population structure purpose which basically based on the
variation of variables through observation and defined the correlation among these. In this section,
Principal Axis Factoring (PAF) is based on the raw data and constructs new dimensional space for the
accessible displays purpose while maintain variability and reduce the weak connection into a fewer
number of components (Fabrigar et al., 1999). The tables applying PAF as the extraction methods in
this stage especially in the Total Variance Explained table which focus on the last row in Cumulative
Extraction Sums of Squared Loadings which means how variables can explain the dependent
variable with the requirement over 50% while Eigenvalue represents for the variance explained by
each variable, according to Kaiser’s research in 1960, the additional evaluation tool which based on
the Eigenvalue > 1. The rule for Eigenvalue > 1 is consistently applied in many researches as
Thompson and Daniel mentioned in their research. According to previous studies, Kaiser-Meyer-Olkin
and Bartlett’s Test would be analyzed in this section, based on the output, the KMO ratio and Sig at
0.901 and 0.000 in respectively, the KMO coefficient is qualified when it is over 0.6, meanwhile, the
sig. at 0.00 < 0.05 which means that the items have a significantly correlation among others. At this
stage, “Promax” is applied as the rotation methods for analyzing confirmatory factor analysis (CFA)
rather than “Varimax” which is rather applicable for EFA analysis purpose. The default option in SPSS
- “Varimax”, however, has some problems in analysis due to the uncorrelation among dimensions
which cause the error or mislead figures in CFA step (Pett, Lackey, & Sullivan, 2003). In the pattern
matrix which applied extraction method as PAF and rotation method as “Promax”. Other
requirements implement that factor loading which illustrate the meaningful practicality of EFA in
research, the item’s factor loading must be greater than 0.3 or the value would be refused.
[Table 5,6,7 in here respectively]
4.3. Confirmatory Factor Analysis (CFA)
631
Figure 2: Measurement Standardized Modelling
632
4.3.1 Model Fit Checking
In CFA analysis for model fit purpose, several figures are considered. Firstly, it can be mentioned
2
to Chi-square/df (CMIN/df) or /df, this evaluation support for assessing the conceptual model in
detail whether it fit with the data sample that implemented before. If the ratio of the degree of
freedom ratio under Chi-square is placed in the range from 3 to 1, which would be considered as the
adequate fit between the collected data and the conceptual model (Carmines and McIver, 1981). By
providing other updates, the ratio which is lower than 2 and higher than 5 is highly recommended
(Carmines and Hocevar, 1985). P-value as mentioned above as the Sig is not allowed higher than
0.05 to prove the correlation among variables. In addition, standardized root means square residual
(SRMR) is the differences between the residual collection of data and the covariance model (Hooper
et al., 2008). According to the research of Byrne, Diamantopoulos and Siguaw in 1998 and 2000
respectively, the SRMR ratio is allowed from 1.0 to 0 and the model would be affordable model is
appreciated below 0.5. Notwithstanding, the ratio as high as 0.8 would be acceptable (Hu and
Bentler, 1999). Besides, the Root Mean Squared Error of Approximation or RMSEA also aims to
measure how well model optimal fit to the population instead of sample sizes (Byrne, 1998). By
collecting from the previous study, it can be founded that RMSEA assessment varies the evaluation
based on which output is belonged to the ranges. In 1996, MacCallum, Browne and Sugawara
suggested that the output lower than 0.01 is considered the excellent fit while close fit is the range
between 0.01 and 0.05. If any didn’t achieve higher than 0.08, it is considered as the good fit while
output lower than 0.10 is briefed as mediocre fit. Continuing with MacCallum and his partners’
research, other studies suggest that it would be cut-off if RMSEA is higher than 0.10. PCLOSE or
close-fitting model is set-up for retest the RMSEA purpose, the assumption of null hypothesis is the
RMSEA is not higher than 0.05. In other words, RMSEA must be at least containing the output with
close fit. Therefore, it called PCLOSE where it must be higher than 0.05 to prove that RMSEA is lower
or equal 0.05. Non-normed Fit Index (NNFI) or known as Turkey-Lewis Index (TLI) in the Amos
application, this is an upgrade version of NFI based on the disadvantage of NFI where it implements
the model fit based on Chi-squared and df. The value of NNFI are recommended higher than 0.9 for
model fitting purpose (Hair et al, 1998). In addition, the Comparative Fit Index is considered as the
variant of NNFI, unlike NFI it was developed for applying the model fit with the small sample size
without corruption (Tabachnick and Fidell, 2007). According to Hu and his partner in 1999, they
recommended CFI indicating the good model fit if CFI is higher or equal 0.95. Meanwhile, the index
which is higher than 0.9 is also review as the acceptable model fit. Likewise, GFI was created as an
alternative for Chi-squared, based on the variances in model fit support for the population
covariances. It would be allowed for adjusting the GFI based on degrees of freedom and observed
variables. It was recommended the GFI are equal or higher than 0.95 is more appropriate for the
model while 0.9 was considered as good and some cases can be extent for acceptable purpose with
the index higher than 0.8 (Miles and Shevlin, 1998) while AGFI required to be higher than 80% is
good fit.
Measurement
Chi-square/DF (CMIN/DF)
Thresholds
< 2 Good; < 5 Acceptable
CFI (Comparative Fit Index)
> 0.95: Great
0.95 – 0.9: Good
GFI (Goodness-of-Fit Index)
0.9 – 0.8: Sometimes Acceptable
> 0.95: Great
0.95 – 0.9: Good
TLI (Tucker Lewis Index)
0.9 – 0.8: Sometimes Acceptable
≥ 0.9
AGFI
> 0.8
SRMR
< 0.09
< 0.01: excellent fit
633
Current Indices
1.45 (Good Result)
0
0.96 (Great Result)
1
0.86 (Acceptable Result)
4
0.95 (Good Result)
7
0.84 (Good Result)
1
0.0428 (Good Result)
0.03 (Close Fit)
8
0.0
1
0.0
5
0.0
8
>=
RMSEA (Root Mean Squared
Error
of Approximation)
– 0.05: close fit
– 0.80: good fit
– 0.10: mediocre fit
0.1: poor fit
Table 19: Model Fit Assessment
Checking the Standardized Regression Weight also extract the Average Variance Extracted
(AVE) in order to build-up the foundation support the convergent validity measurement afford
with the theoretical model also applying for the discriminant validity assessment in seeking the
both AVEs while provide the r squared in correlation where both AVEs in the construct is
suggested to be higher than the squared of the correlation estimate. In addition, evaluating the
Standardized Regression Weight where it is preferred to be higher than 0.5 for checking
convergent validity purpose (Hair et al, 2006).
4.3.2. Reliability Checking
Besides, Composite Reliability (CR) is reevaluated for CFA model fits checking reliability
purpose, comparing to the Cronbach’s Alpha which is tool for assessing the reliability in EFA.
From AMOS results, it shows the estimation in r squared for computing the CR in the
established formula that has been reminded in Fornell and Larcker in 1981. The output of CR
must be equivalent to the assessment criteria of Cronbach’s Alpha where the ratio higher than
0.7 is preferable.
The formula below shows the instruction in calculating CR also the AVE followed the former
research of Joreskog in 1971 and Fornell and Larcker in 1981 respectively.
Composite Reliability (CR) Formula
Equation 1: Composite reliability (Joreskog 1971)
(∑
=
(∑
=1
λ)2
=1
λ)2 + ∑
=1
(1 − λ2)
Where:
λ: is corresponding factor loadings on the Standardized Regression Weight
1- λ2: is the variance’s error in the ith indicator of construct.
p: is the number of indicators
Average Variance Extracted (AVE) Formula
Equation 2: Extracted variance–VE (Fornell& Larcker 1981)
∑
=
∑
=1
2
+∑
=1(1
=1
2
2
− )
Where:
λ: is corresponding factor loadings on the Standardized Regression Weight
1- λ2: is the variance’s error in the ith indicator of construct.
p: is the number of indicators
The Average Variance Extracted (AVE) and the Composite Reliability (CR) has been extracted
from the output of AMOS assessment through the Standardized Regression Weight table. Based on
the result of AVEs, there are 9 factors have variance extracted result over the assessment criteria
(>0.5) where it ranged from 0.624 to 0.741. Additionally, the second reliability assessment –
composite reliability results in the good output which most of the factors having CR over 0.8 while it
is considered as preferable when CR larger or equal 0.5. As can be seen from the evaluation, it
cannot be denied that the model qualifying with the reliability test.
4.3.3. Convergent Validity Checking
634
Estimate
SAS1
SAS2
SAS3
SAS4
SAS5
SQCP1
SQCP2
SQCP3
SQCP4
SQCP5
BEI1
BEI2
BEI3
BEI4
BEI5
EXP1
EXP2
EXP3
EXP4
EXP5
REP1
REP2
REP3
REP4
TRS1
TRS2
TRS3
TRS4
TRS5
SQHC1
SQHC2
SQHC3
SQHC4
SQT1
SQT2
SQT3
SQT4
SQDC1
SQDC2
SQDC3
<--<--<--<--<--<--<--<--<--<--<--<--<--<--<--<--<--<--<--<--<--<--<--<--<--<--<--<--<--<--<--<--<--<--<--<--<--<--<--<---
SAS
SAS
SAS
SAS
SAS
SQCP
SQCP
SQCP
SQCP
SQCP
BEI
BEI
BEI
BEI
BEI
EXP
EXP
EXP
EXP
EXP
REP
REP
REP
REP
TRS
TRS
TRS
TRS
TRS
SQHC
SQHC
SQHC
SQHC
SQT
SQT
SQT
SQT
SQDC
SQDC
SQDC
1
0.97
0.978
0.985
0.956
1
0.911
0.886
1.065
0.82
1
0.97
0.992
0.944
0.977
1
0.967
0.927
0.954
1.038
1
0.939
1.045
0.942
1
0.942
0.925
1.01
0.971
1
0.973
1.016
0.934
1
0.963
0.909
0.671
1
1.035
0.964
S.E.
C.R.
P
0.062
0.061
0.063
0.063
15.659
16.09
15.66
15.092
***
***
***
***
0.061
0.061
0.065
0.058
15.005
14.588
16.432
14.081
***
***
***
***
0.06
0.061
0.061
0.061
16.102
16.293
15.516
16.071
***
***
***
***
0.069
0.067
0.062
0.065
13.929
13.794
15.347
15.878
***
***
***
***
0.048
0.049
0.048
19.475
21.321
19.589
***
***
***
0.056
0.055
0.058
0.054
16.841
16.902
17.402
17.976
***
***
***
***
0.064
0.066
0.064
15.125
15.482
14.67
***
***
***
0.05
0.048
0.06
19.316
19.125
11.246
***
***
***
0.078
0.075
13.301
12.856
***
***
Table 20: Regression Weights: (Group Number-Default model)
635
Label
Standardized Regression
Weights
SAS1
SAS2
SAS3
SAS4
SAS5
SQCP1
SQCP2
SQCP3
SQCP4
SQCP5
BEI1
BEI2
BEI3
BEI4
BEI5
EXP1
EXP2
EXP3
EXP4
EXP5
REP1
REP2
REP3
REP4
TRS1
TRS2
TRS3
TRS4
TRS5
SQHC1
SQHC2
SQHC3
SQHC4
SQT1
SQT2
SQT3
SQT4
SQDC1
SQDC2
SQDC3
<--<--<--<--<--<--<--<--<--<--<--<--<--<--<--<--<--<--<--<--<--<--<--<--<--<--<--<--<--<--<--<--<--<--<--<--<--<--<--<---
SAS
SAS
SAS
SAS
SAS
SQCP
SQCP
SQCP
SQCP
SQCP
BEI
BEI
BEI
BEI
BEI
EXP
EXP
EXP
EXP
EXP
REP
REP
REP
REP
TRS
TRS
TRS
TRS
TRS
SQHC
SQHC
SQHC
SQHC
SQT
SQT
SQT
SQT
SQDC
SQDC
SQDC
Estimate
0.793
0.806
0.823
0.806
0.783
0.792
0.791
0.773
0.853
0.751
0.819
0.798
0.804
0.776
0.797
0.784
0.754
0.748
0.818
0.843
0.874
0.841
0.884
0.843
0.834
0.804
0.806
0.822
0.840
0.819
0.794
0.810
0.774
0.864
0.867
0.860
0.591
0.791
0.815
0.764
Table 21: Standardized Regression Weights (Group number 1-Default model)
636