a finite element model for predicting the biomechanical behavior of the human femur affected by a bone metastasis 1156
Bạn đang xem bản rút gọn của tài liệu. Xem và tải ngay bản đầy đủ của tài liệu tại đây (2.66 MB, 5 trang )
Annals of Radiation Therapy and Oncology
Research Article
Published: 25 Feb, 2019
A Finite Element Model for Predicting the Biomechanical
Behavior of the Human Femur Affected by a Bone
Metastasis
Pusceddu C1*, Marrocu A2, Ball N3, Melis L4 and Fancellu A5
1
Department of Oncologic Radiology, Businco Hospital, Italy
2
Department of Research and Development, Technological Transfer Sector Sardegna Ricerche, Italy
3
Department of Oncologic Radiology, Regional Referral Center for Oncologic Diseases, Italy
4
Department of Oncologic Radiology, Division of Nuclear Medicine, Businco Hospital, Italy
5
Department of Medical Surgical and Experimental Sciences, University of Sassari, Italy
Abstract
Objective: To develop a biomechanically validated Finite Element Model (FEM) to predict the
biomechanical behavior of the human femur in patient affected by a large lytic metastasis at highrisk of fracture.
OPEN ACCESS
*Correspondence:
Pusceddu C, Department of Oncologic
Radiology, Division of Interventional
Radiology, Businco Hospital, Regional
Referral Center for Oncologic
Disease, Cagliari, 09100, Italy, Tel:
390706095123; Fax: 390706095208;
E-mail:
Received Date: 29 Jan 2019
Accepted Date: 21 Feb 2019
Published Date: 25 Feb 2019
Citation:
Pusceddu C, Marrocu A, Ball N, Melis
L, Fancellu A. A Finite Element Model
for Predicting the Biomechanical
Behavior of the Human Femur Affected
by a Bone Metastasis. Ann Radiat Ther
Oncol. 2019; 2(1): 1018.
Copyright © 2019 Pusceddu C. This is
an open access article distributed under
the Creative Commons Attribution
License, which permits unrestricted
use, distribution, and reproduction in
any medium, provided the original work
is properly cited.
Remedy Publications LLC.
Materials and Methods: 3D geometric models of the femur, device and tumor have been presented,
which integrated the CT data-based anatomical structure. Based on the geometric model, a 3D finite
element model of a femur was created. Loads, which simulate the pressure from above were applied
to the FEM, while a boundary condition describing the relative femur displacement is imposed on
the FEM to account for 3D physiological states. The simulation calculation illustrates the stress and
strain distribution and deformation of the femur. The method has two characteristics compared to
previous studies: FEM of the femur are based on the data directly derived from medical images CTs;
the result of analysis will be more accurate than using the data of geometric parameters.
Results: FEM of the real human femur and surgically altered state were loaded with the same force
(in accordance with the specifications defined by ISO 7206). The results of the intact and surgically
altered state were compared. As they were close together, the FEM was used to predict: load-sharing
within tumorous human femur in compression and the stabilizing potential of the different femur
implants and cement in compression with respect to different E moduli.
Conclusion: FEM may be used to predict the biomechanical behavior of the femur. Moreover, the
influence of different femur devices may be predicted.
Keywords: Biomedical; Finite element method; Models; Stability; Metastases
Introduction
Percutaneous Osteosynthesis plus Cementoplasty (POPC) is a minimally invasive technique
used for patients with impending pathological fracture of the proximal femur [1-4]. Little is known
about the exact distribution of forces within the femur affected by a tumor or the influence of
cement injection and femur implants on femur biomechanics [5]. However, additional knowledge
concerning the distribution of forces within the femur would be helpful for example to develop
femur implants and to perform future procedures [6]. The finite element method is a standard
engineering technique in general used in the design of airplanes, machinery and bridges [7-9].
Using special software, it allows modeling of even complex structures by splitting the structure into
numerous, simple finite elements each of which are easy to characterize and model mathematically.
These elements are connected by nodes and describe the geometry of model. Material properties are
assigned to the single elements and simulation of loading of the model is performed using a computer.
However, the predictions of the finite element can only be trusted, if the model has been validated.
This especially applies for application of finite element approaches in various biological systems
due to a huge variety between individuals. Thus, it also applies for application of finite element
modeling in the field of POPC research. Validation may, for example, be done in that way, that
the predictions of the model are compared to the results of a corresponding in vitro analysis. Thus,
1
2019 | Volume 2 | Issue 1 | Article 1018
Pusceddu C, et al.,
Annals of Radiation Therapy and Oncology
Table 1: Mechanical properties of titanium.
Material
E [GPa]
Poisson
Yield Strength [MPa]
Titanium GR5
106
0.34
828
Table 2: This table lists the material properties of element used to model the
various components of the femur and the complete model consisted of 90,000
elements.
a useful way to validate a finite element model of the human femur
may be a comparison to the results of a parallel in vitro analysis. If the
results of the in vitro investigation and the predictions of the finite
element model are close together, the predictions may be trusted and
the model could be a useful tool for further investigations. A finite
element model allows us to repeat experiments, to change parameters,
thus analyzing the effect and influence of a single component within
the construct investigated. Therefore, a model such as presented here
may be useful for first predictions on new femur implants. It may
provide important clues for the stabilizing potential, could be used for
analyzing of stress patterns, just leading to an optimal design of the
implant. Changes of the shape of the implant can be modeled quickly
and their effects predicted before the implant is constructed. It does,
however, not mean that biomechanical in vitro approaches should be
replaced by such a model, but would fully complement them.
Cortical Bone
Spongious Bone
6,982.9
2,029.4
E2 [MPa]
6,982.9
2,029.4
E3 [MPa]
18,155.0
3,195.3
GXY [GPa]
4.69
4.69
G23 [GPa]
5.61
5.61
G31 [GPa]
7.68
7.68
Ν12
0.40
0.40
Ν23
0.25
0.25
Ν31
0.25
0.25
module within Mimics (Materialise).
At two different times we obtained two groups of 3D data from
the CT scans: pre and post-operative model. In relation to the
preoperative acquisition data we simulated two different conditions:
absence and ideal positioning of an inserted medical device. The
finite element models of the real human femur, ideal positioning
and surgically altered state were loaded with the same force, and
compared with each other. Its content included space coordinates of
key points as well as topologic structure on the surface of the model.
We translated the data from the VTK file format to that of the macro
file format in order to import the data to the finite element method
software Ansys. We finally created the geometric model of the femur
segment in Ansys 11.0.
The aim of this study was to develop a biomechanically validated
finite element model to predict biomechanical properties of a real
human femur affected by tumor in compression.
In detail, the FEM should be used to predict:
1. Load-sharing within healthy human femur in compression.
2. Load-sharing within tumoral human femur in compression.
3. The stabilizing potential of the different femur implants and
cement in compression with respect to different E moduli.
Methods and Materials
The space coordinates of key points in the VTK software
corresponded to the key points in Ansys 11.0. It is convenient to
transfer data between the geometric model in VTK and the finite
element model in Ansys 11.0. The geometric model, which was
imported into Ansys 11.0 was an entity model. We divided it into a
grid of element by applying the finite element meshing on it to form
the FEM.
The method involves the FEM to analyze the biomechanical
characteristics of the femur based on the medical images. It is
a numerical method for solving problems of engineering and
mathematical physics. The femur is an anatomical component, which
bears loads derived from human activity. The finite element model
is fitting well for the bone system, which has a complex structure. In
present, the doctor and medical engineer can also utilize the finite
element analysis to analysis biomedical properties of femur. Its basic
principle was to take a continuity, which was consisted of infinite
particles and had finite freedoms such as an aggregation with finite
elements. We can get the stain and stress distribution of the whole
structure by researching the relation between the displacement of
particle and force for every element. It is a good method for resolving
biomechanical characteristic problem of complex structure.
The finite element model
The first step was to create three orthotropic, 3D, nonlinear finite
element models of (Figure 1): the models of the real human femur,
the ideal positioning and the surgically altered state. Details of the
models developing had been given and were briefly summarized here:
the shape of the femur segment was reconstructed from data obtained
from CT scans of patients with impending pathological fracture of the
proximal femur, as shown in Figure 1. Each femur component was
modeled as a 10-node isoparametric material element Solid 187 using
homogeneous and orthotropic material properties [8,9]. The tumor
was modeled using solid elements to simulate an incompressible
behavior with a low young modulus and a poisson ratio close to
0.4999 [10].
Geometric model
We developed a reconstruction model of the real femur based
on the CT data-based anatomical structure of the femur by using
specific reconstruction software. A 66 years old man with no history
of present and past femur disease was selected as normal subject.
Initially femur component data were taken in the axial direction
3D acquisitions with, which got 90 contiguous slices images from a
C-arm CT scan. The CT images had a slice thickness of 1.0 mm, and
each image size is 512 × 512. Ethical permission was obtained for the
study and the subject gave an informed consent for participating.
The CT scans were imported into mimics from materialize where
semi-automatic edge detection was carried out. Three-dimensional
object was created of each bone and meshed using surface elements.
The meshing was carried out using Magics, an automated meshing
Remedy Publications LLC.
E1 [MPa]
Regarding the implanted medical device was modeled a BIOS
SMALL system with length of 80 mm, made of Titanium GR5,
having the determined mechanical characteristics (Table 1). In order
to appropriately model the contacting areas between device and
internal femur surfaces, which must describe sliding consistent with
reality, interface regions were modeled using contact elements. In
order to obtain a greater understanding of the internal behavior of
the structure and to highlight the stress state of its most important
stressed points (neck of the femur and trans-trochanteric region),
2
2019 | Volume 2 | Issue 1 | Article 1018
Pusceddu C, et al.,
Annals of Radiation Therapy and Oncology
Table 3: The table shows that the insertion of the device and cement produces
a small increase in maximum deformation. This is justified by the increase in
stiffness obtained with the cement injection into the tumor region.
Deformation [mm]
DIFFERENCE [%]
Surgically altered state
4.17
---
Ideal positioning
4.2
+ 0.7
Real human femur
4.0
- 4.3
Figure 3: The model was constrained in the distal area, requiring all the nodes
at the end of the bone displacements and rotations void in all directions.
As regards the application of the load was taken into consideration a force,
hypothesized concentrated, which is discharged vertically on the head of the
femur, with a value equal to 2300 N, as described by ISO 7206. In particular,
since the forces are obviously vary in time and depend on the subject and the
type of road in question, it was decided to perform a static analysis refers to
the configuration in which it is maximum and the vertical action to apply to the
head of the femur only this force.
Figure 1: Preparation of the orthotropic, 3D, nonlinear finite element models
of the femur real structure. First, the reconstruction from the data obtained
from CT scan was performed to recreate the shape of the femur. Than each
component of the model was modeled using solid element SOLID 187.
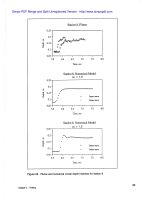
Figure 4: From the picture we can see, for each model, an increase tendency
of displacement of the femur with the increase of the distance from the point
of distal constraint. The tendency is approximately linear which also illustrates
that the femur bone has flexible biomechanical characteristics. The picture
shows load displacement for: the real human femur (A), ideal positioning (B)
and surgically altered state (C).
Figure 2: The lateral CT scan shows large lytic metastasis of the neck of
the left femur (a). The same scan after treatment shows screw fixation plus
cementoplasty (b). In order to obtain a greater understanding of the internal
behavior of the structure and to highlight the stress state of its most stressed
points (neck of the femur and trans-trochanteric region) the model was
divided into three regions, corresponding to: LAYER 1 - head of the femur;
LAYER 2 - neck of the femur; LAYER 3 - diaphyseal region of the femur (c).
all directions. The restraints were used to limit the models movement
with six possible values at the node on the surface, three translations
and three rotations. The value of freedom was zero.
Load cases
each model was divided into three regions (Figure 2), corresponding
to: LAYER 1 - the head of the femur; LAYER 2 - neck of the femur;
LAYER 3 - inter-trochanteric region of the femur.
In this paper we will analyze the stress and strain distribution
of the femur [15-21]. The evaluation was performed by loaddisplacement behavior method. We can observe the displacement
change of the femur and the strain distribution of the segment under a
load of 2,300 N axial compressions, applied to the superior surface of
the femur head in the form of a uniformly concentrated load over all
femur superior surface nodes. We can observe the stress distribution
of the femur segment by applying the load and clue on the high stress
concentration region as the most likely areas fracture. From the load
cases, we know that the finite element model can be used to predict
the change of biomechanical behavior of the femur under pressure.
The material properties used in the study were derived from the
literature [11-14]. The behavior of material properties in the model
response better reflected those of published experimental femur
response. Here, we hypothesize that the strain of femur is a small
strain (Table 2).
Boundary conditions
With regard to the validation and accurateness of model analysis,
we applied the boundary conditions on the FEM. The computation
model is inspired by the specifications defined by ISO 7206, used in
the fatigue test of the hip prosthesis. The boundary conditions on
the model (Figure 3) use pressure and restrains assigned to surface
areas of the model. The inferior surface of femur body was fixed in
Remedy Publications LLC.
Results
This study presents the results in three parts. The stress and strain
distributions of the femur in the real human femur, ideal positioning
3
2019 | Volume 2 | Issue 1 | Article 1018
Pusceddu C, et al.,
Annals of Radiation Therapy and Oncology
Table 4: Comparative table of results.
Small Trochanter
Sigma Max [MPa]
Node (20,723)
Real human femur
Ideal positioning
Surgically altered state
Femur Neck
Difference [%]
Node Up (56,633)
Difference [%]
Node Down (60,833)
100.0
…
80.0
-20.0
85.0
-15.0
Difference [%]
19.406
…
49.186
…
10.363
-46.6
35.653
-27.5
10.716
-44.8
37.236
-24.3
and surgically altered state were obtained from the biomechanical
analysis by applying the same axial compression load. The results are
presented in the following sections.
Load displacement
In accord with the specifications defined by ISO 7206 the load we
applied on the superior surface of the femur head was 2,300 N. The
results of load-displacement behavior in axial compression are shown
in (Table 3 and Figure 4).
Stress distribution of model
The Figure 5 shows the stress distribution of the femur, in the
three models analyzed, when applied 2,300 N loads. It shows that,
in all the models, the high stress concentrations are around the neck
of the femur and on the trans-trochanteric region due to the way the
load applied. That is, they are mainly focusing on the lower region of
the small trochanter. These areas show Von Mises stress that ranges
gradually from blue, to the Maximum Von Mises stress indicated in
red. The stress on the trans-trochanteric region is higher than that
around the neck of the femur, which makes it a common place for
injures due to loading. The superposition of the effects produced by
the mechanical actions provide the most critical conditions (Table
4): in the femoral neck, where there are no maximum values of the
three mechanical actions, but there is a minimum resisting section;
in the region below the small trochanter (Node 20723), which has the
maximum distance from the applied load and, therefore, where you
establish the maximum values of the lateral bending. In relation to
the neck of the femur, the region most heavily affected involves the
outermost fibers, at the top node (Node 56633 UP) and lower (Node
DOWN 60833) (Figure 5); regard, however, the small trochanter, the
maximum stress is easily identified directly from (Figure 6).
Figure 5: Representation of the superposition of the effects produced by
the mechanical actions in the femur. The picture shows that the most critical
conditions are: in the femoral neck, where there are no maximum values of
the three mechanical actions, but there is a minimum resisting section; in the
region below the small trochanter (Node 20723), which has the maximum
distance from the applied load and, therefore, where you establish the
maximum values of the lateral bending.
Discussion
The finite element method can be a powerful tool in the field
of POPC research. It allows us to repeat experiment, to change
parameters, thus analyze the influence of a single component within
the construct investigated. It is useful in analyzing stress patterns
of femur, also leading to an optimal design of the surgeon. It does,
however, not mean that biomechanical in vitro approaches should
be replaced by such a model. The current finite element model also
has limitations, even if its modeling is based on the characteristic of
physiological material and the geometric shape of femur. The internal
anatomic structure of femur is complicated, and such properties of the
small articulation as friction coefficient were not very clear. So all the
material parameters adopted for the model were simplified or based
on hypothesis on some degree. Any finite element model does only
represent a mathematical model and thus is only an approximation
to the specimen and even further from real life conditions. It cannot
reflect the variability of shape and material properties of the bone
inside the individual itself or among the individuals. The interface
between two bones only simulates appropriately the condition in vitro
or in vivo. There are lots of differences and uncertain factors induced
by the individual diversity during modeling. Based on the above
Remedy Publications LLC.
Figure 6: The picture shows Von Mises Stress for: the real human femur
(A), ideal positioning (B) and surgically altered state (C). The maximum
value of stress obtained for a load of 2300 N is imposed equal to 100.0 MPa,
corresponding to the value limit for breaking the cortical bone, and is found
just below the lesser trochanter, in conditions of absence of cement and
without implanted device; insertion of the device, resulting in the introduction
of the cement, reduces by 20% the maximum value of this effort and shows
the stress peaks within acceptable limits from the material.
reason, even though a finite element model has some limitations, it
simulates the biomechanical characteristics of the femur preferably.
Conclusion
The present study stems from the need to know and analyze
numerical methodologies with the states of stress induced by the
presence of a tumor region extended in the femur and the potential
benefits that can be obtained through the introduction of a screw,
able to inject cement within that region. The femur is an important
organ for bearing the weight. When load applied on the femur,
small distortion appeared and that reflected the flexion properties. It
4
2019 | Volume 2 | Issue 1 | Article 1018
Pusceddu C, et al.,
Annals of Radiation Therapy and Oncology
illustrated that the cancellous bone and cortical bone bear the force
together. And the high stress is concentrated on the neck and on
the trans-trochanteric zone. The high stress is on the inferior region
of small trochanter. A 3D nonlinear finite element model of femur
was established to simulate the loading state of the component.
The study indicates the biomechanical characteristic as follows: the
strain of the femur under axial compressive load increased with the
performed load; large stress concentrations were found in the transtrochanteric and neck region, a common place for injures. The results
obtained allowed to understand the state of deformation of the bone
and the critical areas where occur dangerous stress concentrations.
The maximum value of stress obtained for an imposed load of 2,300
N, is equal to 100.0 MPa, corresponding to the breaking limit value
for the cortical bone, and is detected just below the small trochanter,
in conditions of absence of cement and without implanted device.
The insertion of the device, with the consequent introduction of
the cement, reduces by 20% the maximum value of this effort and
brings the maximum values of stress within acceptable limits from
the material. This result can be justified by the fact that the tumor
component goes to erode the material of the resistant section just in
correspondence of this critical region. A state of stress of this type can
lead to a simple trochanteric fracture, with fracture line that extends
from the large to the small trochanter (Figure 5).
4. Andriacchi TP, Hurwitz DE. Gait biomechanics and the evolution of total
joint replacement. Gait and Posture. 1997;5(3):256-64.
5. Deschamps F, Farouil G, Hakime A, Teriitehau C, Barah A, de Baere T.
Percutaneous stabilization of impending pathological fracture of the
proximal femur. Cardiovasc Intervent Radiol. 2012;35(6):1428-32.
6. Lengsfeld M, Kaminsky J, Merz B, Franke RP. Sensitivity of femoral strain
pattern analyses to resultant and muscle forces at the hip joint. Med Eng
Phys. 1996;18(1):70-8.
7. McNamara BP, Cristofolini L, Toni A, Taylor D. Relationship between
bone-prosthesis bonding and load transfer in total hip reconstruction. J
Biomech. 1997;30(6):621-30.
8. Kenneth HH, Donald LD, Douglas ES, Ted GB. The finite element method
for engineers. IV ed. New York: A Wiley-Interscience Publication; 2004.
9. Moaveni S. Finite element analysis theory and applications with ansys. 2nd
ed. USA: Prentice Hall; 1999.
10.David SM, Michael EP, Robert JW, Robert D Cook. Concepts and
applications of finite element concepts and applications of finite element
analysis. 4th ed. Singapore: John Wiley & sons; 2003.
11.Keyak JH, Kaneko TS, Rossi SA, Pejcic MR, Tehranzadeh J, Skinner HB.
Predicting the strength of femoral shafts with and without metastatic
lesions. Clin Orthop Relat Res. 2005;439:161-70.
12.Hernandez CJ, Keaveny TM. A biomechanical perspective on bone quality.
Bone. 2006;39(6):1173-81.
The last analysis conducted shows that the mechanical point of
view, the surgical procedure implementation has allowed to come
close to the ideal case initially assumed by the surgeon, with the
maximum percentage variations very low, slightly higher than 6%
(Table 3). This lighter decrease in results, compared to the ideal case
previously illustrated, can be justified by the fact that the quantity of
cement inserted has not completely filled the tumor region but has,
however, possible to create a "reinforcement" internal able to stiffen
the structure and reduce the maximum stress within acceptable limits.
13.Huiskes R, Janssen JD, Slooff TJ. A detailed comparison of experimental
and theoretical stress analyses of a human femur. ASME AMD.
1983;45:211-34.
14.Bartel DL, Desormeaux S. Femoral stem performance. In: Weinstein A,
Horowitz E, Ruff AW, editors. Retrieval and Analysis of Orthopaedic
Implants. Maryland: NBS Special Publication; 1976. p. 51.
15.Franzoso G, Zysset PK. Elastic anisotropy of human cortical bone
secondary osteons measured by nanoindentation. J Biomech Eng.
2009;131(2):021001.
This study enriched some understandings of the biomechanical
characteristic under loadings and can help surgeons make better
decisions for the treatment with patients with impending pathological
fracture of the proximal femur. In the paper, it is an initial model
of femur including solid cortical bone, cancellous bone, and the real
dimension of the tumor. Our next step is to study more on stress and
strain distribution under torsion and shear conditions and to simulate
the biomechanical characteristics of femur during an operation. We
aim at the operation simulation and surgery navigation by developing
and analyzing the finite element model. The finite element model
based on medical images can analyze biomechanical characteristics of
femur effectively and help optimize individual therapy in the future.
16.Frost HM. “Why do bone strength and "mass" in aging adults become
unresponsive to vigorous exercise? Insights of the Utah paradigm. J Bone
Miner Metab. 1999;17(2):90-7.
17.Doblaré M, García JM. On the modelling bone tissue fracture and healing
of the bone tissue. Acta Cient Venez. 2003;54(1):58-75.
18.Cecchini F, Neri P. Analisi strutturale tridimensionale del femore sano.
Bologna: ENEA. Dipartimento Reattori Innovativi. 1992;43(6).
19.Neri P. Analisi strutturale e calcolo del carico di rottura nel femore
prossimale sottoposto a diverse condizioni di carico. Analisi strutturale
del femore con protesi sottoposto ad un carico assiale. Bologna: ENEA,
Dipartimento Reattori Innovativi, 29 ottobre 1991.
20.Vichnin HH, Battermann SC. Stress analysis and failure prediction in the
proximal femur before and after total hip replacement. J Biomech Eng.
1986;108(1):33-41.
References
1. Raji N, Veerendra K. “Biomechanical analysis of human femur bone”.
IJEST. 2011;3(4):3090-4.
21.Yousif AE, Aziz MY. Biomechanical analysis of the human femur bone
during normal walking and standing up. IOSRJEN. 2012;2(8):3-19.
2. Perry J. Gait analysis, normal and pathological function. 1st ed. NJ: Slack;
1992. p. 1-47.
3. Paul JP. Comparison of EMG signals from leg muscles with the
corresponding force actions calculated from walk path measurements.
Human Locomotor Eng. 1971;48A: 6-26.
Remedy Publications LLC.
5
2019 | Volume 2 | Issue 1 | Article 1018