Evaluation of pancreatic cancer cell migration with multiple parameters in vitro by using an optical real-time cell mobility assay device
Bạn đang xem bản rút gọn của tài liệu. Xem và tải ngay bản đầy đủ của tài liệu tại đây (4.26 MB, 11 trang )
Yamauchi et al. BMC Cancer (2017) 17:234
DOI 10.1186/s12885-017-3218-4
RESEARCH ARTICLE
Open Access
Evaluation of pancreatic cancer cell
migration with multiple parameters in vitro
by using an optical real-time cell mobility
assay device
Akira Yamauchi1* , Masahiro Yamamura2, Naoki Katase3, Masumi Itadani1, Naoko Okada2, Kayoko Kobiki1,
Masafumi Nakamura4, Yoshiyuki Yamaguchi2 and Futoshi Kuribayashi1
Abstract
Background: Migration of cancer cell correlates with distant metastasis and local invasion, which are good targets
for cancer treatment. An optically accessible device “TAXIScan” was developed, which provides considerably more
information regarding the cellular dynamics and less quantity of samples than do the existing methods. Here, we
report the establishment of a system to analyze the nature of pancreatic cancer cells using TAXIScan and we evaluated
lysophosphatidic acid (LPA)-elicited pancreatic cell migration.
Methods: Pancreatic cancer cell lines, BxPC3, PANC-1, AsPC1, and MIAPaCa-2, were analyzed for adhesion as well as
migration towards LPA by TAXIScan using parameters such as velocity and directionality or for the number of
migrated cells by the Boyden chamber methods. To confirm that the migration was initiated by LPA, the expression
of LPA receptors and activation of intracellular signal transductions were examined by quantitative reverse transcriptase
polymerase reaction and western blotting.
Results: Scaffold coating was necessary for the adhesion of pancreatic cancer cells, and collagen I and Matrigel were
found to be good scaffolds. BxPC3 and PANC-1 cells clearly migrated towards the concentration gradient formed by
injecting 1 μL LPA, which was abrogated by pre-treatment with LPA inhibitor, Ki16425 (IC50 for the directionality ≈ 1.
86 μM). The LPA dependent migration was further confirmed by mRNA and protein expression of
LPA receptors as well as phosphorylation of signaling molecules. LPA1 mRNA was highest among the 6 receptors,
and LPA1, LPA2 and LPA3 proteins were detected in BxPC3 and PANC-1 cells. Phosphorylation of Akt (Thr308 and
Ser473) and p42/44MAPK in BxPC3 and PANC-1 cells was observed after LPA stimulation, which was clearly
inhibited by pre-treatment with a compound Ki16425.
Conclusions: We established a novel pancreatic cancer cell migration assay system using TAXIScan. This assay device
provides multiple information on migrating cells simultaneously, such as their morphology, directionality, and velocity,
with a small volume of sample and can be a powerful tool for analyzing the nature of cancer cells and for identifying
new factors that affect cell functions.
Keywords: Migration, Chemotaxis, Lipid mediator, Inhibitor, TAXIScan, Metastasis
* Correspondence:
1
Department of Biochemistry, Kawasaki Medical School, 577 Matsushima,
Kurashiki, Okayama 701-0192, Japan
Full list of author information is available at the end of the article
© The Author(s). 2017 Open Access This article is distributed under the terms of the Creative Commons Attribution 4.0
International License ( which permits unrestricted use, distribution, and
reproduction in any medium, provided you give appropriate credit to the original author(s) and the source, provide a link to
the Creative Commons license, and indicate if changes were made. The Creative Commons Public Domain Dedication waiver
( applies to the data made available in this article, unless otherwise stated.
Yamauchi et al. BMC Cancer (2017) 17:234
Background
Migration of cancer cells correlates with distant metastasis
and local invasion. This phenomenon involves various
molecules including chemoattractants, trophic growth factors and their receptors, adhesion molecules, intracellular
signaling molecules, motor proteins, and the cytoskeleton
[1]. These molecules are orchestrated to help cells migrate
to specific parts of the body or even spontaneously without
an apparent destination. As cancer metastasis is directly
associated with prognosis, controlling cancer cell migration is an effective strategy for treating the disease. Pancreatic cancer is among those with the poorest prognosis [2].
The treatment for this type of cancer is currently restricted
as there are few effective drugs and knowledge regarding
the nature of this cancer type is insufficient. New insights
regarding this cancer and novel approaches for its treatment have long been awaited.
Lysophosphatidic acid (LPA) is a highly bioactive lipid
mediator and is known to be involved in cancer cell migration, proliferation, and production of angiogenic factors
[3]. In the process of cell migration, LPA works as a potent
chemoattractant for various kinds of cells. Six receptors of
LPA (LPA1, LPA2, LPA3, LPA4, LPA5, and LPA6) are
known and all of them are G-protein coupled [4–9]. Some
cells express one of these receptors, while others express
multiple receptors for LPA [10]. Several articles have reported that pancreatic cancer cell lines express LPA receptors and the cells migrate towards LPA, using Boyden
chamber and/or Transwell culture methods, which involve
counting the number of migrated cells [11–13].
TAXIScan is an assay device for studying cell dynamics
in vitro and has been used in the analysis of both suspension (mostly hematopoietic) and adherent cells [14–22].
The device functions as an optically accessible system and
provides two-dimensional images of cell migration. TAXIScan provides markedly more information including
morphology as well as quantitative analysis compared to
existing methods such as Boyden chamber method. This
device consists of an etched silicon substrate and a flat
glass plate, both of which form horizontal channels each
with a micrometer-order depth and forms 2 compartments on either side of a channel. Cells are placed and
aligned on one side, while a stimulating factor is injected
to the other side (typically 1 μL each of the cells and the
stimulant). The cells react to the stable concentration gradient of the stimulant inside the horizontal channel [14].
The cell images are observed thereafter and filmed with a
charge-coupled device camera located beneath the glass.
By analyzing the cell images, many parameters can be
determined including velocity, directionality, etc. [23–26].
The objective of this study is to establish TAXIScan as a
system for pancreatic cancer research by using pancreatic
cancer cell lines and to evaluate cancer cell migration in
vitro for understanding the characteristics of this cancer
Page 2 of 11
cell type and for identifying new drugs to regulate cancer
cell migration. Here, we show the adherence of cells to the
scaffolds as well as LPA-elicited migration by TAXIScan,
and by an existing method, the modified Boyden chamber
method (Transwell). The LPA-elicited migration was confirmed by checking the expression of LPA receptors and
the effect of an LPA inhibitor Ki16425.
Methods
Reagents
Fetal bovine serum (FBS) was obtained from Nichirei
Biosciences Inc. (Tokyo, Japan); RPMI1640 and D-MEM
were from Sigma-Aldrich (St. Louis, MO, USA); Collagen
I, Matrigel (growth factor reduced), fibronectin, laminin,
and collagen I pre-coated coverslips were obtained from
Becton Dickinson (San Jose, CA, USA); fatty-acid-free bovine serum albumin (BSA) from Nacalai Tesque (Kyoto,
Japan); LPA from Enzo Life Sciences Inc. (Farmingdale,
NY, USA); Opti-MEM from Thermo Fisher Scientific Inc.
(Waltham, MA, USA); Anti- LPA1, LPA3, LPA5, and LPA6
rabbit polyclonal antibodies from GeneTex Inc. (Irvine,
CA, USA); anti-LPA 2 rabbit polyclonal antibody from
Abgent (San Diego, CA, USA); and anti-LPA4 rabbit polyclonal antibody from Acris Antibodies Inc. (San Diego,
CA, USA); Ki16425 was purchased from Cayman
Chemical (Ann Arbor, MI, USA).
Maintenance of cells
Human pancreatic cancer cell lines BxPC3 (ATCC CRL1687), PANC-1 (ATCC CRL-1469), and AsPC1 (ATCC
CRL-1682) were obtained from the American Type Culture Collection (ATCC), and MIAPaCa-2 (RCB2094) and
KATOIII (RCB2088) from Riken Cell Bank. PC3 and
211H were kindly provided by Dr. Masakiyo Sakaguchi.
Cells were cultured and maintained in RPMI1640 with
10% FBS or in D-MEM with 10% FBS on 10-cm diameter
dishes as the standard procedure. Passaging of the cells
was performed using PBS and Trypsin/EDTA solution
when they were 80-90% confluent. All samples were
handled according to the Declaration of Helsinki.
Migration assay
The Real-time cell mobility assay was performed by optical
real-time cell mobility assay device “EZ-TAXIScan” (ECI,
Inc., Kawasaki, Japan) as described previously [20], except
for assembling the TAXIScan holder together with a coverslip pre-coated with the extracellular matrix. Briefly, coverslips were coated with collagen I (100 μg/mL), Matrigel
(1/30 diluted solution with culture medium), fibronectin
(100 μg/mL), laminin (100 μg/mL), or the culture
medium, by incubating 100 μL of each solution on a
coverslip at room temperature for 1 h before assembling
the TAXIScan holder. After collagen I was selected as the
scaffold, collagen I pre-coated coverslips were used for the
Yamauchi et al. BMC Cancer (2017) 17:234
TAXIScan method. The pre-coated coverslip was washed
once with 0.5 mL of PBS and was placed on the glass plate
for TAXIScan. The TAXIScan holder was assembled
according to the manufacturer’s instructions. Cells were
harvested by detaching from culture flasks using the same
conditions as passaging. One μL of suspension prepared
in the culture medium containing 2 × 10⁶ cells/mL was
applied to the cell-injection side of TAXIScan holder and
the cells (100 or less in most of the cases) were aligned at
the edge of the micro-channel. After obtaining the first
round of images, 1 μL of the chemoattractant solution
prepared in the chemotaxis buffer was added to the
ligand-injection side of the device to initiate migration.
The assay conditions were as follows: duration, 4 h; interval, 5 min; micro-channel depth, 10 μm; and temperature,
37 °C. Time-lapse images of cell migration were stored as
electronic files on a computer hard disk and analyzed
when needed. The morphologies of migrating cells were
depicted by tracing the edge of cells and then superimposing the resulting outlines onto the initial image. Movies of
the images were made and quantification of velocity and
directionality was carried out through the “TAXIScan
analyzer 2” software. The trajectory of each cell on the
image was traced by clicking the center portion of each
cell on the computer display. The velocity (V) and the
directionality (D) of each cell were calculated using the
traced data as described previously [20, 23]. The statistical
analysis for the velocity and the directionality was done
by the Kruskal-Wallis Test (Non-parametric ANOVA)
followed by the Dunn’s Multiple Comparisons Test, as the
data did not show normal distribution in most cases [20].
The modified Boyden chamber method was performed
using collagen I-coated polycarbonate membrane inserts
(8 μm pore size) in a 24-well plate (CytoSelect 24-Well
Cell Haptotaxis Assay kit, Cell Biolabs, Inc. San Diego,
CA, USA) or Transwell Plate with non-coated polycarbonate membrane (Corning Incorporated, Corning, NY,
USA), per the manufacturer’s protocols. Briefly, the cells
grown on a culture dish were detached with Trypsin/
EDTA solution, washed with PBS, and re-suspended in
RPMI1640/HEPES buffer with 0.1% fatty-acid-free BSA
(the chemotaxis buffer) to attain a density of 0.5 × 10⁶
cells/mL. A total of 1.5 × 10⁵ cells per well were placed
in the upper chamber; the chemotaxis buffer with or
without LPA was injected to the lower chamber, and
then the plate was incubated at 37 °C for 2 h. The migrated
cells were stained with the staining solution (supplied with
the kit), observed under the microscope, and then lysed
with the lysis solution (supplied with the kit) to quantify
the number of migrated cells by measuring the absorbance
at 560 nm. The absorbance was calibrated with the
numbers of cells by using the standard curve with a
series of different cell numbers (0, 10, 32, 100, 320,
1000, 3200, and 10,000 cells).
Page 3 of 11
Quantitative reverse transcriptase polymerase reaction
(qRT-PCR)
Total RNA was extracted from the cells using the
RNeasy kit (QIAGEN, Hilden, Germany). Cells were
seeded on 10 cm-diameter dishes until 80-90% confluency was attained. On the day of the experiment, the
medium was removed, and the cells were washed with
5 mL PBS, followed by addition of lysis solution, per the
manufacture’s recommended procedure. Template DNA
was prepared with extracted total RNA of each sample
using Ready-To-Go You-Prime First-Strand Beads kit
(GE Healthcare, Little Chalfont, UK) and 0.5 μL each of
1st strand DNA per sample was used for quantitative
polymerase reaction (qPCR) with Fast SYBR Green Master
Mix reagent (Life Technologies, Carlsbad, CA, USA). Analysis was done after preparing samples in a 96-well plate;
signal during PCR was detected by Step One Plus Realtime PCR system (Life Technologies). The primers used
are given in Additional file 1: Table S1. β-actin was
used as an internal control for normalization of data.
Data were analyzed by the software accompanied with
the PCR system.
Protein expression and phosphorylation detection
Cells were seeded on 10-cm-diameter dishes until 80-90%
confluency was attained. On the day of the experiment,
cells were rinsed once with 5 mL of serum free OptiMEM and then stimulated with 1 μM LPA prepared in
the chemotaxis assay buffer (0.1%BSA in RPMI1640) prewarmed at 37 °C for 30 s, 2 min, or 5 min. Immediately
after stimulation, the medium was replaced with ice-cold
chemotaxis assay buffer and cells were kept on ice until
lysis was done. Cells were lysed with ice-cold lysis buffer
from the PathScan RTK Signaling Antibody Array kit (Cell
Signaling Technology, Danvers, MA, USA) per the manufacture’s procedure. Cell lysate was kept at −70 °C until
the PathScan phosphorylation array or SDS-PAGE/
western blotting was performed. For western blotting,
each cell lysate was subjected to SDS-PAGE, blotting,
and antibody reaction. The pre-stained protein marker
(Bio-Rad, Hercules, CA, USA) or the CruzMarker protein
marker (Santa Cruz Biotechnology, Santa Cruz, CA, USA)
was used to estimate the molecular weight of probed
bands. Protein bands were visualized with ECL prime (GE
Healthcare) and detected by LAS-4000 mini device (GE
Healthcare). The list of the phosphorylated proteins for
the array is shown in Additional file 2: Table S2.
Results
Establishing the optical real-time migration assay system
for pancreatic cancer cells
We established the assay system for pancreatic cells
using optically accessible horizontal cell mobility assay
device, EZ-TAXIScan. This device has been used for
Yamauchi et al. BMC Cancer (2017) 17:234
monitoring chemotaxis assays mostly for hematopoietic
cells such as neutrophils, monocytes/macrophages, dendritic cells, eosinophils, and lymphocytes [14–25]. In the
case of adherent cells, like the cancer cells, additional
procedures may be required for retrieving the optimal response from cells, such as scaffold coating [26]. Therefore,
we compared different coatings on glass for facilitating
pancreatic cell migration. Human collagen I, fibronectin,
laminin, and Matrigel (growth factor reduced) were examined as scaffold substances coated on the glass plate
inside the TAXIScan chamber. Among these materials,
collagen I and Matrigel showed good performances
(Fig. 1) (An additional movie file shows this in more
detail [see Additional file 3]). Without coating, the cells
did not attach well onto the glass plate (Fig. 1a) and did
not show good migration (Fig. 1b). On the glass coated
with collagen I or Matrigel, most cells attached and spread
well even without a stimulant such as the chemoattractant
(Fig. 1a). On the glass coated with collagen I or Matrigel,
BxPC3 cells migrated towards LPA (Fig. 1b).
LPA is known as a chemoattractant for cancer cells. To
observe chemotactic migration of the pancreatic cancer
cells towards LPA using the TAXIScan system, we used
different concentrations of LPA to seek an optimal concentration for migration and observed that 1 μM of LPA
was optimal for BxPC3 and PANC-1 cells (Fig. 2a) (An
additional movie file shows this in more detail [see
Additional file 4]). In the case of AsPC1 and MIAPaCa-2
cells, very few cells migrated towards LPA at the concentration ranging from 0.1 nM to 10 μM (only the 1 μM
data is shown in Fig. 2a, an additional movie file shows
this in more detail [see Additional file 5]).
BxPC3 cells were the most responsive to LPA of all the
cell lines studied. Therefore, we quantitated the directionality and velocity of migration of BxPC3 cells in response
to different concentrations of LPA. The directionality in
response to LPA increased in a dose-dependent manner
(Fig. 2b left panel). The velocity also increased in a dosedependent manner in the dose range of 1 to 10 μM LPA
(Fig. 2b right panel). These results were in agreement the
TAXIScan images (Fig. 2a). We confirmed the same
phenomenon by an existing assay method, the Boyden
chamber method. In the Boyden chamber method, BxPC3
cells showed good response to LPA in a dose-dependent
manner (Fig. 2c, left). The concentrations of LPA that
elicited the migration of BxPC3 cells were observed to
be similar in both methods.
Expression of receptors for LPA on pancreatic cancer cells
To confirm if the migration of cells was due to the LPAdependent phenomenon, we evaluated the expression of
LPA receptors. Because most published reports showed
either only mRNA expression or only protein expression
[12, 13, 27], we attempted to show both mRNA and
Page 4 of 11
protein expression systematically by using qRT-PCR and
western blotting. As LPA1, LPA2, LPA3, LPA4, LPA5, and
LPA6 are the known receptors for LPA; we used primers
for these receptor isoforms (Additional file 1: Table S1)
[27] to compare their mRNA expressions. In BxPC3
cells, based on the results of qRT-PCR, LPA1 was the
most highly expressed receptor among all the 6 receptors
(Fig. 3a), whereas LPA2, LPA3, and LPA6 were moderately
expressed and LPA5 showed the lowest expression. In
PANC-1 cells, LPA1 and LPA3 were the major receptors
expressed. In AsPC1 cells, the mRNA expression of LPA1,
LPA2, and LPA6 were detected, and in MIAPaCa-2 cells,
the mRNA expression of most LPA receptors was extremely low. LPA3 expression was highest among the
receptors for the MIAPaCa-2 cells (Fig. 3a).
We also evaluated the expression of these receptors at
the protein level in the 4 pancreatic cell lines by western
blotting using anti-LPA antibodies. All cell lines express
a certain amount of LPA1, LPA2 and LPA3 receptors,
however, very low expression of LPA4, LPA5, and LPA6
receptors was observed in lysates of all cell lines compared
to 211H, KATOIII or PC3 which were used as positive
controls (Fig. 3b). The data from the migration assay and
western blotting indicated that BxPC3 and PANC-1 cells
express the LPA receptors and the migration images of
the cells reflects the LPA-elicited migration.
Signal transduction during migration of pancreatic cancer
cells towards LPA
To further confirm that the migration was LPA-dependent,
we determined phosphorylation of various molecules in
BxPC3 and PANC-1 cells using the PathScan array, which
enabled us to simultaneously evaluate the phosphorylation
of 39 different molecules (Additional file 2: Table S2). We
carried out phosphorylation assays at the time points 0.5,
2, and 5 min following LPA stimulation, due to uniform
stimulation of cells by LPA on culture dishes, which precludes the use of an LPA concentration gradient similar to
that of the TAXI Scan device. Using this array system, we
observed that Akt (Thr308 and Ser473), p44/42MAPK,
IRS-1, InsR, c-kit, EphA2, and Tie2 were phosphorylated
after LPA stimulation in both BxPC3 (Fig. 4a, b) and
PANC-1 cells (Fig. 4c, d). Of these phosphorylated proteins, Akt and MAPK are known to be key molecules involved in migration and proliferation. The phosphorylation
of these signaling molecules after uniform stimulation was
further observed by western blotting. The results obtained
showed that Akt (Thr308 and Ser473), p44/42MAPK were
phosphorylated after LPA stimulation, as expected, in both
BxPC3 and PANC-1 cell lines within 5 min (Figs. 4e and
5c). For the record, we also checked longer time points,
such as 15, 30, 60, 120, and 240 min which were similar to
the time points used in the TAXIScan experiments, but no
additional increase in phosphorylation of these molecules
Yamauchi et al. BMC Cancer (2017) 17:234
Page 5 of 11
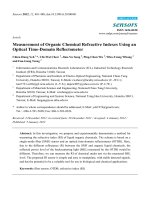
Fig. 1 Adhesion and migration of pancreatic cancer cells monitored by TAXIScan. a Morphology of BxPC3 pancreatic cancer cells after adherence
to each scaffold material coated on the coverslip without chemoattractant. Images were taken 240 min after starting the assay. Scale bar: 10 μm.
b Chemotaxis of BxPC3 pancreatic cancer cells towards 100 nM LPA with or without various kinds of scaffold-coating. Images taken at time 0, 120
and 240 min are shown. The morphologies of 4 or 5 representative migrating cells throughout the assays are shown on the “Trace” column. The
outlines of the migrating cells were traced every 10 min in this column. Cells migrating at more than 1 μm/min are shown in red. All data are
representative of 3 independent experiments. Scale bar: 100 μm
was observed (Fig. 4e). These data further support the
establishment of the assay system of cancer cell migration towards LPA.
Effect of inhibitor on migration towards LPA
We also tested the effect of an LPA inhibitor, Ki16425
[28], on LPA-elicited migration of BxPC3 cells. When
the cells were treated with Ki16425, the migration of the
cells towards LPA was abrogated in a dose-dependent
manner (Fig. 5a, b, an additional movie file shows this in
more detail [see Additional file 6]). The half maximal
inhibitory concentration (IC50) value for directionality
was ≈ 1.86 μM (Fig. 5b, left graph). Owing to weak inhibition of velocity by Ki16425, the IC50 value for
velocity was >100 μM (Fig. 5b, right graph). When the
cells were treated 50 μM Ki16425, the phosphorylation
of Akt and MAPK was reduced, as observed during
western blot analysis (Fig. 5c). The pancreatic cancer
cells showed LPA-elicited chemotactic migration with
clarity in the TAXIScan chamber, and this phenomenon
was vigorously supported by the inhibition of the intracellular signaling with Ki16425.
Yamauchi et al. BMC Cancer (2017) 17:234
Page 6 of 11
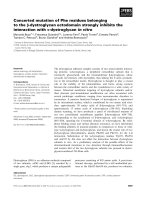
Fig. 2 Chemotaxis of pancreatic cancer cells towards LPA detected
by TAXIScan (a and b) or Boyden chamber (c). a Four pancreatic cancer
cell lines were used for the TAXIScan method. Dose-dependency of
BxPC3 chemotaxis towards LPA is observed. The migration images of
PANC-1, AsPC1, and MIAPaCa-2 cells in the optimal conditions are also
shown. Images taken at time 0, 120 and 240 min are shown. The
morphologies of 4 or 5 representative migrating cells throughout the
assays are shown on the “Trace” column. The outlines of the migrating
cells were recorded every 10 min in this column. Cells migrating at
more than 1 μm/min are shown in red. Data are representative of 3
independent experiments. Scale bar: 100 μm. b Quantitation of the
directionality and velocity of migration of BxPC3 cells towards various
concentrations of LPA. The graph on the left indicates the directionality
and the graph on the right indicates velocity. White circles are outliers.
Statistical analysis was done by the Kruskal-Wallis Test (Nonparametric
ANOVA) followed by the Dunn’s Multiple Comparisons Test. Data are
representative of 3 independent experiments. c Migration of BxPC3
cells towards LPA using Boyden chamber assay kit. The migrated cells
were stained with the staining solution and the numbers of the
migrated cells were estimated by measuring OD 560 nm based on
the standard curve (the graph on the right). The assay results with
the collagen I coated membrane (black bar) or the plain membrane
(white bar) are shown in the graph on the left. Mean values of data are
shown and the error bars represents the standard error (n = 6).
Statistical analysis was conducted using the Student’s t-test. *p < 0.05
(vs. data without LPA)
Discussion
In this study, we established a pancreatic cancer cell migration assay system by using the TAXIScan device. We found
that coating of scaffolds such as collagen and Matrigel on
glass, similar to that in some published studies using other
methods, was necessary for successful adhesion and migration. BxPC3 and PANC-1 cells migrated towards LPA in a
dose-dependent manner, which was clearly inhibited by an
LPA inhibitor, Ki16425. This is the first report of pancreatic
cancer cell migration monitored by the TAXIScan system
that enables analysis of multiple parameters, including
directionality, velocity, and cell morphology. Additionally,
this is the first report simultaneously comparing the
TAXIScan and Boyden chamber methods. The Boyden
chamber method has been used for over 50 years [29], the
limitations of this method have been pointed out by
several researchers. In this method, a membrane of
10 μm thickness, having holes of 8 μm diameter (in this
study) with random density, separates the upper and
lower wells (see Additional file 7). It is thought that
cells are able to sense differences in the chemoattractant
concentration between these two wells. Although this
method appears simple, it has certain limitations. (I) The
density of holes may not be uniform. (II) The microstructure inside the hole, e.g., a micro-channel of 10 μm
length × 8 μm diameter, is unknown, and the chemoattractant gradient is not measurable. (III) A large number
of cells is necessary for this assay (1.5 × 10⁵ cells per well
in this study). (IV) A considerable amount of chemoattractant is necessary (500 μL per well in this study),
which is expensive. (V) The process of cell migration is not
visible. (VI) The device only displays the numbers of
migrated cells. (VII) The obtained data may have high
background noise. (VIII) The density of cells migrating
to the lower side of the membrane is not uniform. A
few advantage of this method are as follows: (I) It has a
simple structure; (II) the apparatus itself (without coating
Yamauchi et al. BMC Cancer (2017) 17:234
Page 7 of 11
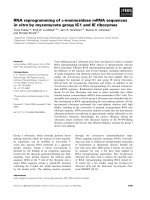
Fig. 3 LPA receptor expression in pancreatic cancer cell lines. a mRNA expression in 4 pancreatic cancer cell lines determined by quantitative RT-PCR.
The relative expression of each receptor was calculated based on the LPA1 expression in BxPC3. Data represent mean values of 3 independent
experiments. The error bars represent the standard error. Statistical analysis was conducted using the Student’s t-test. *p < 0.05, **p < 0.01,
***p < 0.001 (vs. BxPC3). b Protein expression in 4 pancreatic cancer cell lines detected by SDS-PAGE and western blotting. A prostate cancer
cell line, PC3, a gastric cancer cell line, KATOIII, and a pleural mesothelioma cell line, 211H, were used as positive controls. β-actin was used as
a loading control and its expression is also shown. The arrow-head indicates the specific bands of each LPA receptor. M, protein marker; Mia,
MIAPaCa-2; Photographs are representative of 3 independent experiments. The intensity of each band was measured and the relative expression of
each receptor protein was calculated based on the receptor in BxPC3 cells. Quantitative data represent mean values of 3 independent experiments
except the positive controls PC3 and 211H. The error bars represent the standard error
materials) is inexpensive; and (III) it is well known and
widely used. On the other hands, the advantages of TAXIScan are as follows [14] (see also Additional file 8): (I) it
has an uniform micro-channel (260 μm length × 1000 μm
width × 8 μm height); (II) the chemoattractant, which
is placed on one end of the micro-channel, defuses
uniformly through the channel, resulting in a stable
concentration gradient [14]; (III) a small number of cells
Yamauchi et al. BMC Cancer (2017) 17:234
Page 8 of 11
Fig. 4 Phosphorylation of receptors or signaling molecules. a and c Images of phosphorylation of receptors in BxPC3 (a) or in PANC-1 (c) cell lines
detected by Antibody Array. Data are representative of 3 independent experiments. b and d The quantitation of phosphorylation by measuring
density of Antibody Array with BxPC3 data (b) or with PANC-1 data (d). e Phosphorylation of Akt or p44/42MAPK in BxPC3 and PANC-1 cell lines,
as indicated. Cell lysates taken after LPA stimulation at each time point were analyzed by SDS-PAGE and western blotting. Anti-β-actin antibody
was used as the internal control. Arrows indicate the specific band for each antibody. Data are representative of 2 independent experiments
is required for analysis (100 or less cells per channel);
(IV) a small and inexpensive amount of chemoattractant is
necessary (1 μL per channel); (V) migrating cells are
observable; (VI) images obtained during migration are recorded automatically; (VII) data obtained from this assay
including that on morphology, behavior, directionality, and
velocity, are more informative. However, some demerits of
TAXIScan are as follows: (I) although the running cost is
low, the initial cost is high, and (II) it is not well-known
yet. In fact, it may not be appropriate to position TAXIScan as an alternate to the Boyden method, because both
methods utilize completely different equipment and
data collection methods, and the quality of data obtained
using these methods is entirely different (Additional files 7
and 8). However, because of lower requirement of samples
and the collection of more informative data, the approach
to cancer cell migration using TAXIScan is more useful
than analysis using existing techniques such as the Boyden
chamber method. With the TAXIScan system, the characteristics of pancreatic cancer cells can be analyzed in detail. Moreover, our system can be adopted for migration
studies in other types of cancer cells.
In the Boyden chamber method, a certain number of
cells without LPA was observed to migrate, indicating a
high background (Fig. 2c), similar to that reported previously [30–33]. This high background with the Boyden
chamber method is considered to be due to the thickness
of the membrane (10 μm in this study). In TAXIScan
method, cells without LPA were observed to migrate for
more than 10 μm (up to 100 μm) (Fig. 2a), explaining this
phenomenon. From this point of view, we could argue
that TAXIScan has a wider dynamic range to detect
cell migration.
Herein, 4 pancreatic cancer cell lines were analyzed
and only 2 of these cell-lines, BxPC3 and PANC-1,
showed good migration towards LPA with reasonable
co-evidence on the expression of LPA receptors. The
reason why AsPC1 and MIAPaCa-2 cells do not migrate
towards LPA is still unknown. BxPC3 and PANC-1 do
express LPA1, LPA2, and LPA3; however, these cell lines
do not express LPA4, LPA5, and LPA6 as observed during
western blotting (Fig. 3b). The latter 3 receptors are likely
not involved in cell migration but might be involved in
other cellular functions.
Yamauchi et al. BMC Cancer (2017) 17:234
Page 9 of 11
Fig. 5 Inhibition of BxPC3 chemotaxis towards LPA by Ki16425. a BxPC3 chemotaxis towards 1 μM LPA with various concentrations of Ki16425.
Cells were pre-incubated with Ki16425 for 24 h and the chemotaxis assay was performed using TAXIScan. Data are representative of 3 independent
experiments. b Box-plots of the directionality and the velocity in BxPC3 migration towards LPA with Ki16425. The graph on the left indicates
directionality and that on the right indicates velocity. The half maximal inhibitory concentration (IC50) values are also shown. Statistical analysis
was done by the Kruskal-Wallis Test (Non-parametric ANOVA) followed by the Dunn’s Multiple Comparisons Test. ***p < 0.0001 (vs. data with
1 μM LPA and without Ki16425). Data are representative of 3 independent experiments. c Inhibition of phosphorylation of Akt or p44/42MAPK
by Ki16425 in BxPC3 and PANC-1 cell lines, as indicated. Cell lysates taken after LPA stimulation at each time point were analyzed by SDS-PAGE and
western blotting. Anti-β-actin antibody was used as the internal control. Arrows indicate the specific band for each antibody. Data are representative
of 3 independent experiments
Yamauchi et al. BMC Cancer (2017) 17:234
LPA inhibitor, Ki16425, shown in this study is believed
to block human LPA1 and LPA3 receptors [28]; 10 μM
of Ki16425 significantly blocked the migration of cancer
cells [13]. In our system, Ki16425 clearly inhibited
BxPC3 cell migration towards LPA at 5-50 μM concentrations, indicating that TAXIScan and BxPC3 cells are
the best tools for screening inhibitors of pancreatic cell
migration. Utilizing such a new method, new molecules
for regulating pancreatic cancer metastasis can be identified, and the limited treatment options and the poor
prognosis of this disease can be overcome. Studies on
neutrophils have tested various kinds of compounds and
found that some compounds inhibit neutrophil function,
leading to the successful selection of several effective
molecules [34]. Collectively, it can be concluded that
the system established in our study can be a powerful
tool for cancer research and drug discovery in seeking
effectors and inhibitors for analyzing cancer cell function.
We are currently looking for and screening such molecules that can regulate pancreatic cancer cell migration; some promising molecules will be reported in the
near future.
Conclusions
We established a novel pancreatic cancer cell migration
assay system that provides optical and quantitative information simultaneously. Using this system, we demonstrated that BxPC3 and PANC-1 cells showed good
migration towards LPA. The effect of an LPA inhibitor,
Ki16425, was detected clearly in this system, which was
confirmed by the reduction in the phosphorylation of
signal transduction molecules, Akt and MAPK. As this
method provides a large amount of information on migrating cells simultaneously, such as their morphology,
directionality, and velocity, with a small volume of sample,
it can be a powerful tool for analyzing the characteristics
of cancer cells and for evaluating factors affecting cellular
functions.
Additional files
Additional file 1: Table S1. Primers used for the quantitative RT-PCR.
Total 6 pairs of primers for LPA receptors (LPA1, LPA2, LPA3, LPA4, LPA 5,
and LPA6) were used for this study, based on the information reported
previously (27). (DOCX 14 kb)
Additional file 2: Table S2. Targets for PathScan RTK signaling array.
The phosphorylation of 39 different molecules in BxPC3 and PANC-1 cells
was evaluated using the PathScan array. Details are described in Methods
section. (DOCX 14 kb)
Additional file 3: Chemotaxis of BxPC3 pancreatic cancer cells towards
100 nM LPA with or without various kinds of scaffold-coating. Images
were taken every 5 min for 4 h and movies were created by TAXIScan
Analyzer2 software. Representative of 3 independent experiments. Scale
bar: 100 μm. (MP4 9312 kb)
Additional file 4: Chemotaxis of BxPC3 pancreatic cancer cells towards
various concentrations of LPA on a collagen I coated coverslip. Images
Page 10 of 11
were taken every 5 min for 4 h and movies were created by TAXIScan
Analyzer2 software. Representative of 3 independent experiments. Scale
bar: 100 μm. (MP4 7612 kb)
Additional file 5: Chemotaxis of four kinds of pancreatic cancer cells
towards 1 μM LPA on a collagen I coated coverslip. Images were taken
every 5 min for 4 h and movies were created by TAXIScan Analyzer2
software. Representative of 3 independent experiments. Scale bar:
100 μm. (MP4 6258 kb)
Additional file 6: Inhibition of BxPC3 chemotaxis towards LPA by Ki16425.
Cells were pre-incubated with Ki16425 for 24 h and the chemotaxis assay
towards 1 μM LPA was performed using TAXIScan. Images were taken every
5 min for 4 h and movies were created by TAXIScan Analyzer2 software.
Representative of 3 independent experiments. Scale bar: 100 μm.
(MP4 6072 kb)
Additional file 7: The modified Boyden chamber assay. A) Schematic
diagram (sagittal section) of one well of the modified Boyden chamber
assay (Transwell). Cells in the chemotaxis buffer are located in the upper
chamber and the chemoattractant the chemotaxis buffer is added to the
lower chamber. B) Schematic diagram of the membrane part of the
modified Boyden chamber. The membrane separates the upper and the
lower chamber. The matrix is coated on the lower side of the membrane.
C) Photographs of the lower side of the membrane after the assay. Cells
are stained with the staining solution accompanied with the assay kit.
Magnification: 400×. (TIFF 98113 kb)
Additional file 8: The TAXIScan assay. A) Schematic diagram (sagittal
section) of one channel of the TAXIScan chamber. The chamber is filled
with the chemotaxis buffer (light brown color). Cells are located on the
one side of the micro-channel and the chemoattractant (red color) is
placed on the other side of the micro-channel. B) Schematic diagram
(sagittal section) of the micro-channel. The chemoattractant is defused in
the micro-channel, which forms the stable concentration gradient. Cells
on the matrix-coated coverslip migrates towards the gradient of the
chemoattractant in the micro-channel. C) Photograph of cells migrating
towards the chemoattractant. The image is taken from underneath of the
TAXIScan chamber. (TIFF 98112 kb)
Abbreviations
BSA: Bovine serum albumin; EDTA: Ethylenediamine tetraacetic acid;
EGF: Epidermal growth factor; Eph: Ephrin; FBS: Fetal bovine serum; IC50: The
half maximal inhibitory concentration; InsR: Insulin receptor; IRS-1: Insulin
receptor substrate 1; LPA: Lysophosphatidic acid; MAPK: Mitogen-activated
protein kinase; RTK: Receptor tyrosine kinase; SDS-PAGE: Sodium dodecyl
sulfate-polyacrylamide gel electrophoresis; Tie2: Tyrosine kinase with Ig-like
loops and epidermal growth factor homology domains-2
Acknowledgements
We would like to thank Dr. Masakiyo Sakaguchi for providing materials,
Editage (www.editage.jp) for English language editing, and the central
research center of Kawasaki Medical School for technical supports.
Funding
This study was supported by JSPS KAKENHI Grant Number JP15K10201
(to AY), JP25861742 / JP16K11470 (to NK), and JP15K09671 (to FK), Wesco
Scientific Promotion Foundation (to AY), Kawasaki Medical foundation for
Medicine and Medical Welfare (to AY), and Kawasaki Medical School projectresearch fund (to AY, MY, and NK). There was no role with all funding bodies
above in the design of the study or collection, analysis, or interpretation of
the data or writing the manuscript.
Availability of data and materials
All data and materials are available upon reasonable request to the
corresponding author. The data in this study were not deposited in publicly
available repositories since there is no suitable repository service for the data.
Authors’ contributions
AY and MY overviewed and designed this study and analyzed data. NK, MI,
KK, and NO collected and analyzed data. MN, YY, and FK critically discussed
and corrected the manuscript. All authors have read and approved the
manuscript.
Yamauchi et al. BMC Cancer (2017) 17:234
Page 11 of 11
Competing interests
There is no competing interest regarding the publication of this paper.
16.
Consent for publication
Not applicable since no personal information was collected in this study.
17.
Ethics approval and consent to participate
Not applicable since the established cell lines used in this study had no
personal information.
18.
Publisher’s Note
Springer Nature remains neutral with regard to jurisdictional claims in published
maps and institutional affiliations.
Author details
1
Department of Biochemistry, Kawasaki Medical School, 577 Matsushima,
Kurashiki, Okayama 701-0192, Japan. 2Department of Clinical Oncology,
Kawasaki Medical School, Okayama, Japan. 3Department of Molecular and
Developmental Biology, Kawasaki Medical School, Okayama, Japan.
4
Department of Surgery and Oncology, Graduate School of Medical Sciences,
Kyushu University, Fukuoka, Japan.
19.
20.
21.
Received: 14 March 2016 Accepted: 22 March 2017
22.
References
1. Roussos ET, Condeelis JS, Patsialou A. Chemotaxis in cancer. Nat Rev Cancer.
2011;11(8):573–87.
2. Dorsam RT, Gutkind JS. G-protein-coupled receptors and cancer. Nat Rev
Cancer. 2007;7(2):79–94.
3. Murph M, Tanaka T, Liu S, Mills GB. Of spiders and crabs: the emergence of
lysophospholipids and their metabolic pathways as targets for therapy in
cancer. Clin Cancer Res. 2006;12(22):6598–602.
4. Hecht JH, Weiner JA, Post SR, Chun J. Ventricular zone gene-1 (vzg-1)
encodes a lysophosphatidic acid receptor expressed in neurogenic regions
of the developing cerebral cortex. J Cell Biol. 1996;135(4):1071–83.
5. An S, Bleu T, Hallmark OG, Goetzl EJ. Characterization of a novel subtype of
human G protein-coupled receptor for lysophosphatidic acid. J Biol Chem.
1998;273(14):7906–10.
6. Bandoh K, Aoki J, Hosono H, Kobayashi S, Kobayashi T, Murakami-Murofushi
K, Tsujimoto M, Arai H, Inoue K. Molecular cloning and characterization of a
novel human G-protein-coupled receptor, EDG7, for lysophosphatidic acid. J
Biol Chem. 1999;274(39):27776–85.
7. Noguchi K, Ishii S, Shimizu T. Identification of p2y9/GPR23 as a novel G
protein-coupled receptor for lysophosphatidic acid, structurally distant from
the Edg family. J Biol Chem. 2003;278(28):25600–6.
8. Kotarsky K, Boketoft A, Bristulf J, Nilsson NE, Norberg A, Hansson S, Owman
C, Sillard R, Leeb-Lundberg LM, Olde B. Lysophosphatidic acid binds to and
activates GPR92, a G protein-coupled receptor highly expressed in
gastrointestinal lymphocytes. J Pharmacol Exp Ther. 2006;318(2):619–28.
9. Pasternack SM, von Kügelgen I, Al Aboud K, Lee YA, Rüschendorf F, Voss K,
Hillmer AM, Molderings GJ, Franz T, Ramirez A, et al. G protein-coupled
receptor P2Y5 and its ligand LPA are involved in maintenance of human
hair growth. Nat Genet. 2008;40(3):329–34.
10. Chun J, Hla T, Lynch KR, Spiegel S, Moolenaar WH. International Union of
Basic and Clinical Pharmacology. LXXVIII. Lysophospholipid receptor
nomenclature. Pharmacol Rev. 2010;62(4):579–87.
11. Mills GB, Moolenaar WH. The emerging role of lysophosphatidic acid in
cancer. Nat Rev Cancer. 2003;3(8):582–91.
12. Stähle M, Veit C, Bachfischer U, Schierling K, Skripczynski B, Hall A, Gierschik
P, Giehl K. Mechanisms in LPA-induced tumor cell migration: critical role of
phosphorylated ERK. J Cell Sci. 2003;116(Pt 18):3835–46.
13. Yamada T, Sato K, Komachi M, Malchinkhuu E, Tobo M, Kimura T, Kuwabara
A, Yanagita Y, Ikeya T, Tanahashi Y, et al. Lysophosphatidic acid (LPA) in
malignant ascites stimulates motility of human pancreatic cancer cells
through LPA1. J Biol Chem. 2004;279(8):6595–605.
14. Kanegasaki S, Nomura Y, Nitta N, Akiyama S, Tamatani T, Goshoh Y, Yoshida
T, Sato T, Kikuchi Y. A novel optical assay system for the quantitative
measurement of chemotaxis. J Immunol Methods. 2003;282(1-2):1–11.
15. Jang MH, Sougawa N, Tanaka T, Hirata T, Hiroi T, Tohya K, Guo Z, Umemoto
E, Ebisuno Y, Yang BG, et al. CCR7 is critically important for migration of
23.
24.
25.
26.
27.
28.
29.
30.
31.
32.
33.
34.
dendritic cells in intestinal lamina propria to mesenteric lymph nodes.
J Immunol. 2006;176(2):803–10.
Nishio M, Watanabe K, Sasaki J, Taya C, Takasuga S, Iizuka R, Balla T,
Yamazaki M, Watanabe H, Itoh R, et al. Control of cell polarity and motility
by the PtdIns(3,4,5)P3 phosphatase SHIP1. Nat Cell Biol. 2007;9(1):36–44.
Ito A, Suganami T, Yamauchi A, Degawa-Yamauchi M, Tanaka M, Kouyama
R, Kobayashi Y, Nitta N, Yasuda K, Hirata Y, et al. Role of CC Chemokine
receptor 2 in bone marrow cells in the recruitment of macrophages into
obese adipose tissue. J Biol Chem. 2008;283(51):35715–23.
Nishikimi A, Fukuhara H, Su W, Hongu T, Takasuga S, Mihara H, Cao Q,
Sanematsu F, Kanai M, Hasegawa H, et al. Sequential regulation of DOCK2
dynamics by two phospholipids during neutrophil chemotaxis. Science.
2009;324(5925):384–7.
Uchida M, Oyanagi E, Miyachi M, Yamauchi A, Yano H. Relationship between
macrophage differentiation and the chemotactic activity toward damaged
myoblast cells. J Immunol Methods. 2013;393(1-2):61–9.
Yamauchi A, Degawa-Yamauchi M, Kuribayashi F, Kanegasaki S, Tsuchiya T.
Systematic single cell analysis of migration and morphological changes of
human neutrophils over stimulus concentration gradients. J Immunol
Methods. 2014;404:59–70.
Kurose K, Ohue Y, Sato E, Yamauchi A, Eikawa S, Isobe M, Nishio Y, Uenaka
A, Oka M, Nakayama E. Increase in activated Treg in TIL in lung cancer and
in vitro depletion of Treg by ADCC using an antihuman CCR4 mAb (KM2760).
J Thorac Oncol. 2015;10(1):74–83.
Ishii M, Egen JG, Klauschen F, Meier-Schellersheim M, Saeki Y, Vacher J, Proia
RL, Germain RN. Sphingosine-1-phosphate mobilizes osteoclast precursors
and regulates bone homeostasis. Nature. 2009;458(7237):524–8.
Nitta N, Tsuchiya T, Yamauchi A, Tamatani T, Kanegasaki S. Quantitative analysis
of eosinophil chemotaxis tracked using a novel optical device - TAXIScan.
J Immunol Methods. 2007;320(1-2):155–63.
Terashima Y, Onai N, Murai M, Enomoto M, Poonpiriya V, Hamada T, Motomura
K, Suwa M, Ezaki T, Haga T, et al. Pivotal function for cytoplasmic protein
FROUNT in CCR2-mediated monocyte chemotaxis. Nat Immunol.
2005;6(8):827–35.
Takamatsu H, Takegahara N, Nakagawa Y, Tomura M, Taniguchi M, Friedel
RH, Rayburn H, Tessier-Lavigne M, Yoshida Y, Okuno T, et al. Semaphorins
guide the entry of dendritic cells into the lymphatics by activating myosin
II. Nat Immunol. 2010;11(7):594–600.
Yamauchi A, Hadjur C, Takahashi T, Suzuki I, Hirose K, Mahe YF. Human skin
melanocyte migration towards stromal cell-derived factor-1 alpha demonstrated
by optical real-time cell mobility assay: modulation of their chemotactic ability
by alpha-melanocyte-stimulating hormone. Exp Dermatol. 2013;22(10):664–7.
Jongsma M, Matas-Rico E, Rzadkowski A, Jalink K, Moolenaar WH. LPA is a
chemorepellent for B16 melanoma cells: action through the cAMP-elevating
LPA5 receptor. PLoS One. 2011;6(12):e29260.
Ohta H, Sato K, Murata N, Damirin A, Malchinkhuu E, Kon J, Kimura T, Tobo M,
Yamazaki Y, Watanabe T, et al. Ki16425, a subtype-selective antagonist for EDGfamily lysophosphatidic acid receptors. Mol Pharmacol. 2003;64(4):994–1005.
BOYDEN S. The chemotactic effect of mixtures of antibody and antigen on
polymorphonuclear leucocytes. J Exp Med. 1962;115:453–66.
Schuller HM, Al-Wadei HA, Majidi M. GABA B receptor is a novel drug target
for pancreatic cancer. Cancer. 2008;112(4):767–78.
Schuller HM, Al-Wadei HA, Majidi M. Gamma-aminobutyric acid, a potential
tumor suppressor for small airway-derived lung adenocarcinoma. Carcinogenesis.
2008;29(10):1979–85.
König J, Weiss G, Rossi D, Wankhammer K, Reinisch A, Kinzer M, Huppertz B,
Pfeiffer D, Parolini O, Lang I. Placental mesenchymal stromal cells derived
from blood vessels or avascular tissues: what is the better choice to support
endothelial cell function? Stem Cells Dev. 2015;24(1):115–31.
Kestens C, Siersema PD, Offerhaus GJ, van Baal JW. BMP4 signaling is able
to induce an epithelial-Mesenchymal transition-like phenotype in Barrett's
esophagus and esophageal Adenocarcinoma through induction of SNAIL2.
PLoS One. 2016;11(5):e0155754.
Hattori H, Subramanian KK, Sakai J, Jia Y, Li Y, Porter TF, Loison F, Sarraj B,
Kasorn A, Jo H, et al. Small-molecule screen identifies reactive oxygen
species as key regulators of neutrophil chemotaxis. Proc Natl Acad Sci U S
A. 2010;107(8):3546–51.