Socio-economic deprivation: A significant determinant affecting stage of oral cancer diagnosis and survival
Bạn đang xem bản rút gọn của tài liệu. Xem và tải ngay bản đầy đủ của tài liệu tại đây (2.51 MB, 10 trang )
Auluck et al. BMC Cancer (2016) 16:569
DOI 10.1186/s12885-016-2579-4
RESEARCH ARTICLE
Open Access
Socio-economic deprivation: a significant
determinant affecting stage of oral cancer
diagnosis and survival
Ajit Auluck1,2,6* , Blake Byron Walker3, Greg Hislop2, Scott A. Lear1,4,5, Nadine Schuurman3 and Miriam Rosin1,2
Abstract
Background: Many factors contribute to socioeconomic status (SES), yet in most survival studies only income is
used as a measure for determining SES. We used a complex, composite, census-based metric for socioeconomic
deprivation to better distinguish individuals with lower SES and assess its impact on survival and staging trends of
oral cancers.
Methods: Oropharyngeal (OPC) and oral cavity cancer (OCC) cases were identified from the British Columbia cancer
registry between 1981–2009 and placed into affluent and deprived neighborhoods using postal codes linked to
VANDIX (a composite SES index based on 7 census variables encompassing income, housing, family structure,
education, and employment). Stage and cancer-specific survival rates were examined by sex, SES, and time period.
Results: Approximately 50 % of OPC and OCC cases of both sexes resided in SES deprived neighborhoods. Numbers
of cases have increased in recent years for all but OCC in men. The deprivation gap in survival between affluent and
deprived neighborhoods widened in recent years for OPC and OCC in men, while decreasing for OPC and increasing
slightly for OCC in women. Greater proportions of OCC cases were diagnosed at later stage disease for both sexes
residing in deprived neighborhoods, a trend not seen for OPC.
Conclusion: SES remains a significant independent determinant of survival for both OPC and OCC when using
a composite metric for SES. OPC survival rates among men have improved, albeit at slower rates in deprived
communities. OCC screening programs need to be targeted towards SES-deprived neighborhoods where greater
proportions of cases were diagnosed at a later stage and survival rates have significantly worsened in both sexes.
Background
Socioeconomic status (SES) can impact health outcomes
and is dependent on many variables, such as income,
housing, educational attainment, employment, and family structure. However, most survival studies of head and
neck cancer (HNC) patients have used a single variable,
usually income, to measure SES [1–6]. For example, a
recent Canadian study reported a significant difference
in 2-year overall survival between the highest and lowest
income quintiles for oropharyngeal cancers (OPC) [6],
where income was determined by linking postal codes in
* Correspondence:
1
Biomedical Physiology and Kinesiology, Simon Fraser University, Burnaby,
Canada
2
Cancer Control Research Department, BC Cancer Agency, Vancouver,
Canada
Full list of author information is available at the end of the article
the registry with census data on average household income. Other prognostic factors, such as staging at diagnosis, were not examined. Income alone has several
limitations: being age-dependent; less stable than education or occupation; with a higher nonresponse rate; and
excludes other assets like wealth, health insurance coverage and disability benefits [7]. Since SES has been shown
to be an important indicator of health equity [8] and determinant of cancer survival [1, 9, 10], and no single
variable adequately captures SES [11], more attention
needs to be placed on composite indices.
The epidemiology of oral cancers is changing rapidly, especially in high-resource countries, a change
associated with declining rates of smoking and increasing prevalence of human papilloma viral infections (HPV) [12]. Alterations in incidence and survival
rates become apparent upon classification of these
© 2016 The Author(s). Open Access This article is distributed under the terms of the Creative Commons Attribution 4.0
International License ( which permits unrestricted use, distribution, and
reproduction in any medium, provided you give appropriate credit to the original author(s) and the source, provide a link to
the Creative Commons license, and indicate if changes were made. The Creative Commons Public Domain Dedication waiver
( applies to the data made available in this article, unless otherwise stated.
Auluck et al. BMC Cancer (2016) 16:569
cancers by anatomic site [13–15]. OPC, which include
the tonsils, base of tongue and other oropharyngeal
sites, are strongly associated with HPV infection and
have shown both an increase in incidence and improved
survival over the last several decades. In contrast, oral cavity cancers (OCC), which include the ventrolateral
tongue, gum, cheeks and floor of mouth, are more
likely to be related to tobacco and alcohol consumption with less association with HPV [12, 14–16]. Although OCC have tended to decline in incidence in
high-resource countries [16], change in survival has
been variable [17]. With increasing economic disparities in many countries including Canada [18, 19] and
changing epidemiology of HNC, it’s important to identify the high-risk populations for developing these
cancers using improved and better SES measures.
We undertook a population-based study using the
British Columbia Cancer Registry (BCCR) to address
some of these earlier limitations: by examining the interrelationships of SES and sex on cancer-specific survival
and stage at diagnosis for OPC and OCC, and by using a
unique composite census-based metric called VANDIX
that combines measures of neighborhood average
household income, housing tenure, educational attainment, employment, and family structure [20] We also
provide information about the changes in stage at
diagnosis that can significantly impact upon survival
rates. An enriched understanding of cancer-related
burden of SES inequalities is relevant not only to BC
but globally, as inequality-related health disparities
continue to grow and health care resource allocation
becomes an increasingly crucial component of addressing these inequalities [21].
Methods
Study population
Cases were identified from the population-based BCCR
from 1981 to 2009, with selection based on a histological diagnosis of invasive squamous cell carcinoma
in the oropharynx and oral cavity, as defined by the
International Classifications of Diseases in Oncology,
3rd edition (ICDO-3). Histology codes for selected
cases included: 8050 to 8076, 8078, 80713, 80723,
80733, 80743, and 80833. Site codes were then used for
etiological clustering of cases into OPC and OCC, as
described in our earlier papers [13–15]. This resulted in
the identification of 2059 (1512 male, 547 female) OPC
cases and 4319 (2692 male, 1627 female) OCC cases,
for a total of 6378 cases that were included in the survival analysis. This study was approved by the research
ethics boards at the BC Cancer Agency (BCCA) (certificate number HO8-00839) and Simon Fraser University
(2012-s-0348).
Page 2 of 10
Data collection
Registry data were collected on cancer characteristics
(anatomic site, date of diagnosis, date of death, cause of
death, stage at diagnosis) and patient demographics (surname, age, sex, residential postal code) and patient death
data (regularly updated from BC vital statistics). Staging
data is often problematic in cancer registries. BCCR receives staging information for all patients receiving
chemotherapy or radiation therapy in BC. It records the
clinical staging parameters T, N, and M (tumour size,
nodal status, and metastasis); these were used to determine stage at diagnosis according to the American Joint
Committee of Cancer Classification [22]. Early stage
(localized disease) was defined as Stage I (T1, N0, M0)
or Stage II (T2, N0, M0), and late stage (distant and
metastatic disease) was defined as Stage III (T3, N0, M0
or T1-3, N1, M0) and Stage IV (T4, N0, M0 or T1-4,
N2-3, M0 or T1-4, N1-3, M1).
We were able to ascertain stage for approximately
96 % of OPC cases (missing staging data for only 56
men and 31 women) but only 75 % of OCC cases (missing staging data for 647 men and 414 women), possibly
because OCC patients were more often treated by
surgery only in general hospitals and their staging data
were often not sent to BCCR. All data were checked for
completeness; duplicate records and recurrences were
removed; and discrepancies were corrected with the assistance of registry staff.
Neighbourhood socioeconomic status
Residential neighbourhood SES was calculated for each
of the 2006 Canadian Census Dissemination Areas (DA)
in BC (N = 6900) using VANDIX, a composite metric for
socioeconomic status based on the weighted sum of 7
census variables at the DA level: average income, workforce participation rate, unemployment rate, secondary
school completion rate, proportion of the population
with a university degree, and proportion of lone-parent
households. Variable weights were derived based on
structured surveys with local public health officers, as
described in previous publications [20, 23]. An exploratory regression found that income explains only onethird of the variance in VANDIX (R [2] = 0.337, F =
3410.50, p < 0.0005); we therefore elected to use this
index rather than income, as VANDIX encompasses a
broader range of variables that affect material and social deprivation.
For this study, the socioeconomic deprivation quintile
q1 represents the most affluent neighbourhoods (highest
SES) and q5 represents the most deprived neighbourhoods (lowest SES). Data are presented for grouped affluent (SES q1-3) and deprived (SES q4-5) neighbourhoods
because there were not enough cases to present data for
each quintile separately. A geographic information system
Auluck et al. BMC Cancer (2016) 16:569
(GIS) was then used to link individual patients to their
VANDIX score by spatially joining patients’ full residential
postal codes to it. The resulting dataset, containing patients’ data and their neighbourhood VANDIX quintile,
was used for the subsequent survival analysis.
Statistical analysis
Five-year cancer-specific survival rates for OPC and
OCC were calculated separately for males and females
residing in affluent (SES q1-3) and deprived (SES q4-5)
neighbourhoods from the date of diagnosis to the date
of death from oral cancer or to the date of censorship
(date of death from other causes or the end of the
follow-up period: 31st December, 2009). Actuarial life tables were stratified by sex and calendar period of diagnosis and used to calculate 5-year cancer-specific survival
rates with 95 % CI (confidence intervals). These rates
were compared using Kaplan-Meier curves with logrank tests. Temporal trends in 5-year survival rates were
then examined by comparing the two time periods:
1981–1995 and 1996–2009. The difference between survival rates in the most affluent and most deprived quintiles was presented as the ‘deprivation gap’; this was
reported as negative (−) if the most deprived group had
a lower survival than the most affluent group. Temporal
change in survival rates between these two time periods
were reported as ‘% change’ which was obtained by subtracting the calculated values of survival rates; this was
reported as positive (+) if 1996–2009 had a better survival than 1981–95.
Frequency distributions in the stage at diagnosis (early
and late stages) were determined separately for OPC and
OCC by site, sex, SES (affluent and deprived neighbourhoods) and time period and tested for significance using
Pearson’s Chi-square test.
Finally, a Cox Proportional Hazards model was then
used to determine the independent effect of SES on
cancer-specific survival rates, adjusting for the effects
of age, sex, stage at diagnosis and time period. A hazard
ratio (HR) with 95 % CI was estimated to infer the effect of selected variables on the outcome. All analyses
were conducted using SPSS (Statistical Package for
Social Sciences) version 22; all statistical tests were
two-sided and a p-value of 0.05 or less was considered
statistically significant.
Results
A total of 6378 cases were analyzed, of which 2059
(32.3 %) were OPC and 4319 (67.7 %) were OCC. Approximately half of OPC and OCC cases were found in
deprived neighbourhoods, among both men and women.
For OPC, 757 of 1512 cases in men, and 272 of 547
cases in women, were found to reside in deprived neighborhoods, with an increase in numbers occurring in
Page 3 of 10
both sexes between 1981–1995 and 1996–2009 (from
248 to 509 in men and 109 to 163 in women). A similarly large proportion of OCC cases were found to reside
in deprived neighborhoods, 1416 of 2692 cases in men
and 807 of 1627 cases in women. However, numbers of
cases have decreased in recent years in men in these
neighbourhoods (from 743 to 673), and, in contrast
have increased in women (from 371 to 436). In the
following sections, we will first describe the results of
our survival analysis and SES for OPC and OCC separately, then the results of the association of SES with
stage of disease at diagnosis.
SES and survival by sex
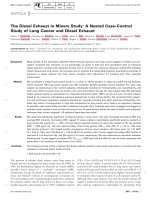
Men residing in affluent neighbourhoods (SES q1-3) had
significantly better cancer-specific survival rates for OPC
as compared to men residing in deprived neighbourhoods (SES q4-5) (P = 0.002, Fig. 1a), with 5-year cancerspecific survival rates of 72.5 (95 % CI, 70.6–76.2) and
66.6 (95 % CI, 62.9–69.7), respectively (Table 1). Among
women, 5-year cancer-specific survival rates were also
higher for the more affluent neighbourhoods (68.0, 95 %
CI: 62.2–73.8 and 64.2, 95 % CI: 57.8–70.6, respectively),
however, this difference was not significant (P = 0.50,
Fig. 1c, Table 1).
In contrast to OPC data, no significant difference was
found in the cancer-specific survival rates for OCC in
men residing in affluent as compared to deprived neighbourhoods (P = 0.20, Fig. 1b), with 5-year cancer-specific
survival rates of 78.5 (95 % CI, 76.2–80.8) and 77.0 (95 %
CI, 74.7–79.3), respectively (Table 1). A similar lack of association was found for OCC survival in women (P = 0.96,
Fig. 1d), with 5-year cancer-specific survival rates of 77.2
(95 % CI, 74.1–80.3) and 77.1 (95 % CI, 74.0–80.2), for affluent and deprived neighbourhoods, respectively (Table 3).
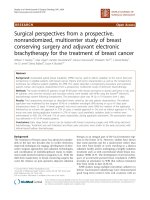
Time trend for SES and survival by sex
Significant improvement was found in the cancerspecific survival rates for OPC in recent years for
men in both affluent (P < 0.001, Fig. 2a) and deprived
(P = 0.05, Fig. 2b) neighbourhoods. 5-year cancerspecific survival rates increased between 1981–1995
and 1996–2009 by 11.4 % (95 % CI,−0.3–22.7) and
8.3 % (95 % CI,−0.3–19.8), respectively (Table 1). In
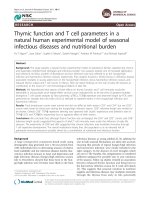
contrast to the pattern observed in men, there was
marginal reduction in survival for OPC in recent
years for women in affluent neighbourhoods. 5-year
survival rates decreased by − 2.9 % (95 % CI,−20–14.4)
(Table 1) but this change was not statistically significant
(P < 0.39, Fig. 3a). OPC survival rates remained largely
unchanged over time for women in deprived neighbourhoods (P = 0.82, Fig. 3b), with a −0.5 % (95 % CI,−18.7–
17.7) decrease in 5-year survival rates (Table 1).
Auluck et al. BMC Cancer (2016) 16:569
Page 4 of 10
Fig. 1 Five year cancer-specific survival rates for oropharyngeal cancers (OPC) and oral cavity cancers (OCC) by sex and socioeconomic status (SES) from
1981 to 2009: a OPC in men, b OCC in men, c OPC in women and d OCC in women
In contrast, significant reductions were found in cancerspecific survival rates for OCC in recent years for men in
both affluent (P = 0.002, Fig. 2c) and deprived (P < 0.001,
Fig. 2d) neighbourhoods. 5-year cancer-specific survival
rates decreased by −7.5 % (95 % CI,−15.6–2.6) and − 9.2 %
(95 % CI,−16.4–1.3), respectively (Table 1). Likewise, significant reductions were also seen in survival for OCC
in recent years for women in both affluent (P = 0.05,
Fig. 3c) and deprived (P = 0.01, Fig. 3d) neighbourhoods. 5-year cancer-specific survival rates decreased
by − 5.4 % (95 % CI,−14–3.4) and − 7.5 % (95 %
CI,−14.6–0.9), respectively (Table 1).
(95 % CI,−3–14.6) in 1996–2009 and for OCC increased from 0.9 % (95 % CI,−5.1–7.1) to 2.6 % (95 %
CI,−4.9–9.6) (Table 1).
The deprivation gaps between 5-year survival rates for
women residing in affluent and deprived neighbourhoods from 1981 to 2009 were 3.8 % (95 % CI,−8.5–16)
and 0.1 % (95 % CI,−6.1–6.2) for OPC and OCC, respectively. Again, looking at the earlier and later time
periods, the deprivation gap for OPC decreased in
women from 5.5 % (95 % CI,–14.1–25.1) in 1981–1995
to 3.1 % (95 % CI,−12.6–19) in 1996–2009 and for OCC
increased from − 1.1 % (95 % CI,−9.9–7.5) to 1.0 % (95 %
CI,−7.8–9.9), respectively (Table 1).
Temporal trends in deprivation gap for survival by sex
and SES
The deprivation gaps between 5-year cancer-specific
survival rates for men residing in affluent and deprived
neighbourhoods from 1981 to 2009 were 5.9 % (95 %
CI, 0.9–13.3) and 1.5 % (95 % CI,−3.1–6.1) for OPC
and OCC, respectively. However, when we looked separately at the two time periods (1981–1995 and 1996–
2009), the deprivation gap for OPC increased in men
from 2.9 % (95 % CI,−11.1–17.1) in 1981–1995 to 6.0 %
SES and stage at diagnosis by sex
We then looked at the relationship between SES and stage
at diagnosis by gender for OPC and OCC. No significant
differences were seen in stage at diagnosis for OPC between
residents of the deprived and affluent neighbourhoods for
either men (P = 0.82) or women (P = 0.12, Table 2). In contrast, significantly greater numbers of cases were found
diagnosed at a late stage for OCC among residents of
Auluck et al. BMC Cancer (2016) 16:569
Table 1 Temporal trends in 5-year cancer specific survival rates by site, socioeconomic status (SES), sex and time periods
Higher SES (q1-3)
Lower SES (q4-5)
OPC
Survival
rates
OCC
95 % CI
% change
a
OPC
Survival
rates
95 % CI
78.5
76.2–80.8
82.2
79.1–85.5
a
% change
Deprivation gapb
OCC
Survival
rates
95 % CI
66.6
62.9–69.7
60.9
54.1–67.7
a
% change
Survival
rates
95 % CI
77
74.7–79.3
81.3
78.4–84.2
a
% change
OPC
OCC
5.9
(0.9 to 13.3)
1.5
(−3.1 to 6.1)
2.9
(−11.1 to 17.1)
0.9
(−5.1 to 7.1)
5-year disease specific
survival rates
Men
1981-2009
72.5
70.6–76.2
1981–1995
63.8
56.6–71.2
1996-2009
75.2
70.9–79.3
74.7
70.9–78.2
69.2
64.7–73.9
72.1
68.6–75.8
6
(−3 to 14.6)
2.6
(−4.9 to 9.6)
1981-2009
68
62.2–73.8
77.2
74.1–80.3
64.2
57.8–70.6
77.1
74.0–80.2
3.8
(−8.5 to 16)
0.1
(−6.1 to 6.2)
1981–1995
69.9
60.1–79.7
80.2
75.7–84.5
64.4
54.6–74.2
81.3
77.0–85.6
5.5
(−14.1 to 25.1)
−1.1
(−9.9 to 7.5)
1996–2009
67
59.7–74.5
74.8
70.5–79.1
63.9
55.5–72.3
73.8
69.2–78.3
3.1
(−12.6 to 19)
1
(−7.8 to 9.9)
11.4
(−0.3 to 22.7)
−7.5
(−14.6 to 0.9)
8.3
(−3 to 19.8)
−9.2
(−15.6 to –2.6)
Women
−2.9
(−20 to 14.4)
−5.4
(−14 to 3.4)
−0.5
(−18.7 to 17.7)
−7.5
(−16.4 to 1.3)
a
Differences in survival rates between first and second time period, bDeprivation gap is the difference between affluent and deprived VANDIX quintiles
Page 5 of 10
Auluck et al. BMC Cancer (2016) 16:569
Page 6 of 10
Fig. 2 Five year cancer-specific survival rates for oropharyngeal cancers (OPC) and oral cavity cancers (OCC) by time periods and socioeconomic
status (SES) among men: a OPC in men in affluent (q1-3), b OPC in men in deprived (q4-5), c OCC in men in affluent (q1-3) and d OCC in men in
deprived (q4-5)
deprived as compared to affluent neighbourhoods for both
men (P = 0.001) and women (P = 0.01, Table 2).
Time trend for SES and stage at diagnosis by sex
On examining for changes in staging between the two
time periods (1981–1995 and 1996–2009), increased
proportions of OPC cases were diagnosed at later stages
in recent years in both affluent and deprived neighbourhoods for men and women (Table 3). In men, the percentage of OPC cases diagnosed at a later stage of
disease increased from 77.2 % to 88.4 % in affluent
neighbourhoods, and from 82.2 % to 87.6 % in deprived
neighbourhoods. In women, the percentage of OPC
cases diagnosed at a later stage of disease increased from
71.4 % to 74.1 % in affluent neighbourhoods and from
74.5 % to 81.8 % in deprived neighbourhoods.
Increased proportions of OCC cases were diagnosed at
later stages in recent years in deprived but not affluent
neighbourhoods for men and women. For residents in
deprived neighbourhoods, the percentage of OCC cases
diagnosed at a later stage of disease increased from
58.5 % to 61.7 % in men, and from 51.9 % to 54.1 % in
women. In contrast, for residents in affluent neighbourhoods, the percentage of OCC cases diagnosed at a later
stage of disease decreased from 51.5 % to 50.2 % in men
and decreased from 50.5 % to 41.7 % in women.
SES as an independent predictor of survival
In multivariate analysis, after adjustment of age, sex,
stage at diagnosis and time period, SES emerged as a
significant predictor of survival for both OPC (P = 0.02)
and OCC (P = 0.01). The hazards ratios for residence in
deprived neighbourhoods (SES q4-5) were 1.15 (95 % CI,
1.02–1.37) and 1.27 (95 % CI, 1.13–1.40) for OPC and
OCC cases, respectively.
Discussion
SES is a complex, multifaceted social phenomenon that
cannot be comprehensively modelled using any single
variable [23, 24]. Much social and cultural capital implicit in SES is lost in studies limited to the use of income
or education. There is a need to employ a composite
measure of SES that includes a broader scope of both
social and economic variables [11]. VANDIX, the index
Auluck et al. BMC Cancer (2016) 16:569
Page 7 of 10
Fig. 3 Five year cancer-specific survival rates for oropharyngeal cancers (OPC) and oral cavity cancers (OCC) by time periods and socioeconomic status
(SES) among women: a OPC in women in affluent (q1-3), b OPC in women in deprived (q4-5), c OCC in women in affluent (q1-3) and d OCC in women
in deprived (q4-5)
used in this study, was developed using variables selected in consultation with public health officers and statistically validated using principal component analysis. It
has since been applied in numerous studies of SES and
health [25–31]. The advantage of using VANDIX is that
it dimensionalizes the concept of SES in two ways: (i) by
incorporating other positive markers of social capital
such as home ownership; (ii) and by including negative
markers of SES such as lone-parent families. In this way,
we allow SES to better reflect the myriad phenomena
that combine to determine vulnerability.
Using VANDIX, we reported in an earlier publication
that incidence rate of oral cancers is not linear or proportionate between different SES quintiles, but there is a
sharp and dramatic increase in the incidence rate according to the deprivation status of the neighbourhood
[15]. In this paper, we reported survival differences for OPC
and OCC, again using VANDIX to measure SES. Approximately 50 % of OPC and OCC cases of both sexes resided
in deprived neighborhoods, and the numbers of cases have
increased in recent years for all but OCC cases in men. SES
remained an independent predictor of survival for both
OPC and OCC, after adjustment for age, gender, stage at
diagnosis and time period.
We found that survival rates for OPC have significantly improved among men and marginally reduced
among women, with similar trends being observed in
both deprived and affluent communities. These observed
trends may be due to the increased prevalence of HPV
among OPC cases [12, 32], which is more often observed among men than women [16]. This may be
attributed to heavier and longer duration of smoking
among men for smoking may interact with HPV infection to promote carcinogenesis [33]. Another hypothesis
is men have higher probability of contracting oral HPV infection due to orogenital sex [34]. Vulnerability of men to
contracting an oral HPV infection or progression of HPV
infection to OPC requires further research. Although optimal treatment for HPV-positive OPC remains uncertain,
it appears to be more sensitive to chemo-radiation [35]
Auluck et al. BMC Cancer (2016) 16:569
Page 8 of 10
Table 2 Distribution of cases by stage at diagnosis,
socioeconomic status (SES) quintiles and sex from 1981–2009
Chi-square
P value
Early
Late
%
N
%
N
OPC men
Affluent (q1-3)
108
14.7
625
85.3
Deprived (q4-5)
103
14.2
620
85.8
Affluent (q1-3)
69
27.0
187
73.0
Deprived (q4-5)
55
21.2
205
78.8
Affluent (q1-3)
476
49.1
494
50.9
Deprived (q4-5)
431
40.1
644
59.9
Affluent (q1-3)
338
54.2
286
45.8
Deprived (q4-5)
277
47.0
312
53.0
0.82
OPC women
0.12
OCC men
<0.001**
OCC women
0.01**
**Significant P value < 0.05. Missing cases for OPC among men and women
were 56 (q1-3 = 22 & q4-5 = 34) and 31 (q1-3 = 19 & q4-5 = 12), respectively,
and for OCC among men and women were 647 (q1-3 = 306, q4-5 = 341) and
414 (q1-3 = 196, q4-5 = 218), respectively. Missing cases were not included in
the analysis
which might explain the dramatic improvement in the observed survival rates for OPC in men.
Our findings of declining survival rates and increasing
deprivation gap for OCC for men and women residing
in both deprived and affluent neighbourhoods are in
contrast to data reported in a recent Canadian study
which showed no significant change in overall 2-year
survival rates for OCC by SES [6]. This difference may
be because we presented 5-year survival rates (survival
differences did not become most apparent until after
two years) and we reported cancer-specific survival and
not overall survival rates (which might not truly reflect
cancer outcomes because of greater non-cancer
smoking-and alcohol-related comorbidity in deprived
neighbourhoods). Also, our use of a composite measure
for SES may better categorize patients into affluent and
deprived neighbourhoods than income alone. Another
probable explanation might include differences in study
population profiles, for BC has a larger proportion of
South Asian and Chinese immigrants residing in deprived neighborhoods and South Asians have higher oral
cancer incidence because of chewing habits [13, 36, 37],
poorer oral cancer survival [14], less access to health
care facilities, poorer participation in cancer screening
programs, and less awareness of signs and symptoms of
oral cancer; all factors that often contributing to delayed
diagnosis [38–40]. The reasons for reductions in survival
rates for OCC among men and women residing in affluent neighbourhoods need to be further explored.
Staging at diagnosis strongly influences cancer-specific
survival rates [14, 41]. We found that greater proportions of OCC cases were diagnosed with later stage
disease among both men and women residing in deprived neighborhoods, a trend not seen for OPC which
showed increased proportions of later stage disease in
both affluent and deprived neighborhoods. This finding
is in contrast to another Canadian study which reported
no difference in stage by SES [4]. This difference may be
at least partially attributed to our use of VANDIX.
Our finding is consistent with other studies reporting
poorer survival rates with late stage diagnosis [39, 42].
Differences in access to dentists and oral cancer screening services may cause diagnostic delays resulting in the
Table 3 Temporal changes in distribution of cases by stage at diagnosis and socioeconomic status (SES) quinitiles
1981–1995
Chi-square test
1996–2009
Chi-square test
Early
Late
Early
Late
N
N
N
N
q1-3 (N = 970)
263 (48.5 %)
279 (51.5 %)
213 (49.8 %)
215 (50.2 %)
q4-5 (N = 1075)
250 (41.5 %)
352 (58.5 %)
181 (38.3 %)
292 (61.7 %)
q1-3 (N = 624)
144 (49.5 %)
147 (50.5 %)
q4-5 (N = 589)
143 (48.1 %)
154 (51.9 %)
q1-3 (N = 733)
47 (22.8 %)
159 (77.2 %)
q4-5 (N = 723)
43 (17.8 %)
198 (82.2 %)
q1-3 (N = 256)
28 (28.6 %)
70 (71.4 %)
q4-5 (N = 260)
27 (25.5 %)
79 (74.5 %)
OCC men
0.01**
0.001**
OCC women
0.74
194 (58.3 %)
139 (41.7 %)
134 (45.9 %)
158 (54.1 %)
61 (11.6 %)
466 (88.4 %)
60 (12.4 %)
422 (87.6 %)
0.002**
OPC men
0.19
0.67
OPC women
**Significant P value < 0.05
0.61
41 (25.9 %)
117 (74.1 %)
28 (18.2 %)
126 (81.8 %)
0.09
Auluck et al. BMC Cancer (2016) 16:569
observed later stage at diagnosis and poorer survival [38,
39, 43]. HNC patients with lower SES have been reported to be less likely treated with surgery, to have
poorer survival rates, and to poorly comply with treatment protocols because of lack of regular source of
care, poor communication and lack of patient navigation facilities [40]. A recent Canadian report suggests
that Canadians from low-middle income groups suffer
from pain, discomfort, disability due to poor oral health
and about six million Canadians avoid visiting a dentist
every year [44].
Several limitations of our study result from using cancer registry data. Oral cancer cases were categorized
into OPC and OCC based solely on ICDO codes and
not tumour HPV status. Information was lacking on
risk behavior and details on treatment. Another limitation was the extent of missing data on staging, especially for OCC cases who were less often referred to
BCCA for treatment.
Our study benefits from several strengths. We used
data from the population-based BCCR over three decades to determine the survival rates of OPC and OCC;
thus, we had adequate follow up of the cases. We only
selected biopsy-confirmed OCC and OPC cases, which
eliminated potential errors of over-inclusion of cases.
We also used a composite peer-reviewed index (VANDIX) to determine the SES deprivation status. And finally, the registry recorded postal codes for each case’s
place of residence which enabled us to assign neighbourhood deprivation status to each case. This had never
been done before to examine oral cancer survival in BC.
Moving forward, we would use GIS to determine
whether geographical clustering of cases by SES affects
choice of treatment, cancer survival and outcomes.
Policy interventions need to consider the observed
deprivation gap for targeting oral cancer screening,
awareness, and health promotion programmes, especially for OPC in men residing in deprived neighbourhoods. Such upstream approaches to oral cancer care
may proactively alleviate the economic burden imposed
by systematic inequalities in the delivery of dental care
in deprived neighbourhoods.
Conclusion
SES is a significant determinant of survival. We need
targeted oral cancer screening programs in deprived
neighborhoods for early detection and improving survival rates of oral cancers.
Abbreviations
BC, British Columbia; BCCA, British Columbia Cancer Agency; BCCR, British
Columbia Cancer Registry; CI, Confidence interval; DB, Dissemination blocks;
HNC, Head and neck cancers; HPV, Human papilloma viral infections; ICDO,
International Classifications of Diseases in Oncology; OC–Oral cavity cancer;
OPC–Oropharyngeal cancer; q, Quintile; SES, Socio–economic status; SPSS,
Statistical Package for Social Sciences; T, N, and M, Tumour size, nodal status,
Page 9 of 10
and metastasis; DA, Dissemination areas; VANDIX, Vancouver Area
Neighbourhood Deprivation Index
Acknowledgements
We thank BC Cancer Registry for data and Ryan Woods and Joanna Mendell
for their help in conduct of this research.
Funding
Supported by the LiVWELL Research Group and funded through the Community
Trust Endowment Fund of Simon Fraser University. SL holds the Pfizer/Heart and
Stroke Foundation Chair in Cardiovascular Prevention Research at St. Paul’s
Hospital. A research grant to MR from the Canadian Cancer Society Research
Institute (2012–701143) provides access to some of the infrastructure required for
this analysis.
Availability of data and materials
Data was collected from British Columbia Cancer Registry. Not available to
be uploaded due to confidentiality agreement with the cancer registry.
Authors’ contributions
AA–was involved in data acquisition, data coding, data analysis, data
interpretation and writing of this manuscript. BBW–was involved in data
coding and writing of this manuscript. GH–contributed in data
interpretation, provided feedback on scientific content and revising the
manuscript. SL–contributed in data presentation, providing feedback on
scientific content and revising the manuscript. NS–contributed in creating
VANDIX, data coding and revising the manuscript. MR–was involved in
conceptual design of this project, guiding data analysis, interpretation,
preparing and revising the manuscript. All authors provided consent to the final
version of this manuscript. All authors read and approved the final manuscript.
Competing interests
The authors declare that they have no competing interests.
Consent for publication
Not applicable.
Ethics approval and consent to participate
No individual ethics consent was required. This study was approved by the
research ethics boards at the BC Cancer Agency (BCCA) (certificate number
HO8-00839) and Simon Fraser University (2012-s-0348).
Author details
1
Biomedical Physiology and Kinesiology, Simon Fraser University, Burnaby,
Canada. 2Cancer Control Research Department, BC Cancer Agency,
Vancouver, Canada. 3Department of Geography, Simon Fraser University,
Burnaby, BC, Canada. 4Faculty of Health Sciences, Simon Fraser University,
Burnaby, Canada. 5Division of Cardiology, Providence Health Care, Vancouver,
Canada. 6BC Oral Cancer Prevention Program, BC Cancer Agency Research
Centre, 675 W. 10th Ave, 3rd Floor, Room 119, Vancouver, B.C V5Z1L3,
Canada.
Received: 14 April 2016 Accepted: 18 July 2016
References
1. Booth CM, Li G, Zhang-Salomons J, Mackillop WJ. The impact of
socioeconomic status on stage of cancer at diagnosis and survival: a
population-based study in Ontario. Canada Cancer. 2010;116(17):4160–7.
2. Boyd C, Zhang-Salomons JY, Groome PA, Mackillop WJ. Associations
between community income and cancer survival in Ontario, Canada, and
the United States. J Clin Oncol. 1999;17(7):2244–55.
3. Hwang E, Johnson-Obaseki S, McDonald JT, Connell C, Corsten M. Incidence
of head and neck cancer and socioeconomic status in Canada from 1992 to
2007. Oral Oncol. 2013;49(11):1072–6.
4. Johnson S, Corsten MJ, McDonald JT, Chun J. Socio-economic factors and
stage at presentation of head and neck cancer patients in Ottawa, Canada:
a logistic regression analysis. Oral Oncol. 2010;46(5):366–8.
5. Mackillop WJ, Zhang-Salomons J, Groome PA, Paszat L, Holowaty E.
Socioeconomic status and cancer survival in Ontario. J Clin Oncol. 1997;
15(4):1680–9.
Auluck et al. BMC Cancer (2016) 16:569
6.
7.
8.
9.
10.
11.
12.
13.
14.
15.
16.
17.
18.
19.
20.
21.
22.
23.
24.
25.
26.
27.
28.
29.
McDonald JT, Johnson-Obaseki S, Hwang E, Connell C, Corsten M. The
relationship between survival and socio-economic status for head and neck
cancer in Canada. J Otolaryngol Head Neck Surg. 2014;43:2.
Shavers VL. Measurement of socioeconomic status in health disparities
research. J Natl Med Assoc. 2007;99(9):1013–23.
Marmot M. Achieving health equity: from root causes to fair outcomes.
Lancet. 2007;370(9593):1153–63.
Robertson G, Greenlaw N, Bray CA, Morrison DS. Explaining the effects of
socio-economic deprivation on survival in a national prospective cohort
study of 1909 patients with head and neck cancers. Cancer Epidemiol. 2010;
34(6):682–8.
Chu KP, Shema S, Wu S, Gomez SL, Chang ET, Le QT. Head and neck
cancer-specific survival based on socioeconomic status in Asians and Pacific
Islanders. Cancer. 2011;117(9):1935–45.
Sharpe KH, McMahon AD, Raab GM, Brewster DH, Conway DI. Association
between socioeconomic factors and cancer risk: a population cohort study
in Scotland (1991–2006). PLoS ONE. 2014;9(2), e89513.
Chaturvedi AK, Engels EA, Pfeiffer RM, et al. Human papillomavirus and
rising oropharyngeal cancer incidence in the United States. J Clin Oncol.
2011;29(32):4294–301.
Auluck A, Hislop G, Bajdik C, Poh C, Zhang L, Rosin M. Trends in
oropharyngeal and oral cavity cancer incidence of human papillomavirus
(HPV)-related and HPV-unrelated sites in a multicultural population: the
British Columbia experience. Cancer. 2010;116(11):2635–44.
Auluck A, Hislop G, Bajdik C, et al. Gender-and ethnicity-specific survival
trends of oral cavity and oropharyngeal cancers in British Columbia. Cancer
Causes Control. 2012;23(12):1899–909.
Auluck A, Walker BB, Hislop G, Lear SA, Schuurman N, Rosin M. Populationbased incidence trends of oropharyngeal and oral cavity cancers by sex
among the poorest and underprivileged populations. BMC Cancer. 2014;
14(1):316.
Chaturvedi AK, Anderson WF, Lortet-Tieulent J, et al. Worldwide trends in
incidence rates for oral cavity and oropharyngeal cancers. J Clin Oncol.
2013;31(36):4550–9.
Sankaranarayanan R, Swaminathan R, Brenner H, et al. Cancer survival in
Africa, Asia, and Central America: a population-based study. Lancet Oncol.
2010;11(2):165–73.
Myles J, Picot G, Pyper W. Neighbourhood Inequality in Canadian Cities.
Government of Canada Publications. Accessed from URL .
ca/collections/Collection/CS11-0019-160E.pdf. [Accessed 9 Sept 2014].
Tjepkema M, Wilkins R, Long A. Cause-specific mortality by income adequacy
in Canada: A 16-year follow-up study. Health Rep. 2013;24(7):14–22.
Bell N, Hayes MV. The Vancouver Area Neighbourhood Deprivation Index
(VANDIX): a census-based tool for assessing small-area variations in health
status. Can J Public Health. 2012;103(8 Suppl 2):S28–32.
Richard Wilkinson KP. The Spirit Level: Why Greater Equality Makes Societies
Stronger: Bloomsbury USA. 2011.
Edge SB, Byrd DR, Compton CC, Fritz AG, Greene FL, Trotti A, editors.
American Joint Committee on Cancer Staging Manual. 7th ed. New York:
Springer; 2009.
Bell N, Schuurman N, Oliver L, Hayes MV. Towards the construction of
place‐specific measures of deprivation: a case study from the Vancouver
metropolitan area. Can Geogr. 2007;51(4):444–61.
Bell N, Schuurman N, Hayes MV. Using GIS-based methods of
multicriteria analysis to construct socio-economic deprivation indices.
Int J Health Geogr. 2007;6:17.
Bell NJ, Schuurman N, Morad Hameed S. A small-area population analysis of
socioeconomic status and incidence of severe burn/fire-related injury in
British Columbia, Canada. Burns. 2009;35(8):1133–41.
Hameed SM, Bell N, Schuurman N. Analyzing the effects of place on injury:
Does the choice of geographic scale and zone matter? Open Medicine.
2010;4(4):171–80.
Schuurman N, Bell N, Dunn J, Oliver L. Deprivation indices, population
health, and geography: an evaluation of the spatial effectiveness of indices
at multiple scales. J Urban Health. 2007;84(4):591–603.
Walker BB, Hameed SM, Schuurman N. A GIS-based spatial-temporal analysis
of violent trauma hotspots Vancouver, Canada: identification,
contextualisation, and intervention. BMJ Open. 2014;4, e003642.
Walker BB, Schuurman N. Environmental correlates with violent injury.
Geomatica. 2012;66(4):103–11.
Page 10 of 10
30. Walker BB, Schuurman N. The pen or the sword: a situated spatial analysis of
graffiti and violent injury in Vancouver, British Columbia. The Professional
Geographer 2014; Online ahead of print: DOI:10.1080/00330124.2014.970843.
31. Walker BB, Taylor-Noonan C, Tabbernor A, et al. A multi-criteria evaluation model
of earthquake vulnerability in Victoria, British Columbia. Nat Hazards. 2014;1–14.
32. Nichols AC, Palma DA, Dhaliwal SS, et al. The epidemic of human
papillomavirus and oropharyngeal cancer in a Canadian population. Curr
Oncol. 2013;20(4):212–9.
33. Combes JD, Chen AA, Franceschi S. Prevalence of human papillomavirus in
cancer of the oropharynx by gender. Cancer Epidemiol Biomarkers Prev.
2014;23(12):2954–8.
34. Hernandez BY, Wilkens LR, Zhu X, et al. Transmission of human
papillomavirus in heterosexual couples. Emerg Infect Dis. 2008;14(6):888–94.
35. Fakhry C, Westra WH, Li S, et al. Improved survival of patients with human
papillomavirus-positive head and neck squamous cell carcinoma in a
prospective clinical trial. J Natl Cancer Inst. 2008;100(4):261–9.
36. Auluck A, Hislop G, Poh C, Zhang L, Rosin MP. Areca nut and betel quid
chewing among South Asian immigrants to Western countries and its
implications for oral cancer screening. Rural Remote Health. 2009;9(2):1118.
37. Walker BB, Schuurman N, Auluck A, Lear SA, Rosin M. Suburbanisation of
oral cavity cancers: evidence from a geographically-explicit observational
study of incidence trends in British Columbia, Canada, 1981–2010. BMC
Public Health. 2015;15:758.
38. Holmes JD, Dierks EJ, Homer LD, Potter BE. Is detection of oral and
oropharyngeal squamous cancer by a dental health care provider associated
with a lower stage at diagnosis? J Oral Maxillofac Surg. 2003;61(3):285–91.
39. Agarwal AK, Sethi A, Sareen D, Dhingra S. Treatment delay in oral and
oropharyngeal cancer in our population: the role of socio-economic factors
and health-seeking behaviour. Indian J Otolaryngol Head Neck Surg. 2011;
63(2):145–50.
40. Subramanian S, Chen A. Treatment patterns and survival among lowincome medicaid patients with head and neck cancer. JAMA Otolaryngol
Head Neck Surg. 2013;139(5):489–95.
41. Sciubba JJ. Oral cancer. The importance of early diagnosis and treatment.
Am J Clin Dermatol. 2001;2(4):239–51.
42. Akram M, Siddiqui SA, Karimi AM. Patient related factors associated with
delayed reporting in oral cavity and oropharyngeal cancer. Int J Prev Med.
2014;5(7):915–9.
43. Adrien J, Bertolus C, Gambotti L, Mallet A, Baujat B. Why are head and neck
squamous cell carcinoma diagnosed so late? Influence of health care
disparities and socio-economic factors. Oral Oncol. 2014;50(2):90–7.
44. Canadian Academy of Health Sciences. Improving Acess to Oral Health
Care. from Accessed 16th Dec 2014.
Submit your next manuscript to BioMed Central
and we will help you at every step:
• We accept pre-submission inquiries
• Our selector tool helps you to find the most relevant journal
• We provide round the clock customer support
• Convenient online submission
• Thorough peer review
• Inclusion in PubMed and all major indexing services
• Maximum visibility for your research
Submit your manuscript at
www.biomedcentral.com/submit