A retrospective study of predictive factors for unexpectedly prolonged or shortened progression-free survival and overall survival among patients with metastatic renal cell carcinoma who
Bạn đang xem bản rút gọn của tài liệu. Xem và tải ngay bản đầy đủ của tài liệu tại đây (600.28 KB, 11 trang )
Kim et al. BMC Cancer (2016) 16:577
DOI 10.1186/s12885-016-2615-4
RESEARCH ARTICLE
Open Access
A retrospective study of predictive factors
for unexpectedly prolonged or shortened
progression-free survival and overall
survival among patients with metastatic
renal cell carcinoma who received first-line
targeted therapy
Sung Han Kim1, Sohee Kim2, Jungnam Joo2, Ho Kyung Seo1, Jae Young Joung1, Kang Hyun Lee1
and Jinsoo Chung1,3*
Abstract
Background: To identify predictors of prolonged or shortened progression-free survival (PFS) and overall survival
(OS) among patients with metastatic renal cell carcinoma (mRCC) who received first-line targeted therapies.
Methods: This retrospective study included 146 patients with mRCC who were treated during 2007–2015. These
patients were divided into a group with the worst response (WG), an expected group (EG), and a group with the
best response (BG), based on their PFS (≤3 monthsnths, 3–18 monthsnths, and >18 monthsnths, respectively) and
OS (<1 year, 1–3 years, and >3 years, respectively). To identify significant predictive factors, the BG and WG were
compared to the EG using the Memorial Sloan Kettering Cancer Center and Heng risk models.
Results: The overall PFS and OS were 9.3 months and 16.4 months, respectively. The median PFS for the WG (41.8 %),
EG (45.9 %), and BG (12.3 %) were 2.7 months, 9.3 months, and 56.6 months, respectively, and the median OS for the WG
(45.9 %), EG (35.6 %), and BG (18.5 %) were 5.5 months, 21.6 months, and 63.1 months, respectively; these outcomes
were significantly different (p < 0.001). Nephrectomy (odds ratio [OR]: 7.15) was a significant predictor of PFS in the BG,
and the significant predictors of OS in the BG were MSKCC intermediate risk (OR: 0.12), poor risk (OR: 0.04), and a diseasefree interval of <1 year (OR: 0.23) (all, p < 0.05). Anemia (OR: 3.25) was a significant predictor of PFS in the WG, and the
significant predictors of OS were age (OR: 1.05), anemia (OR: 4.13), lymphocytopenia (OR: 4.76), disease-free interval of
<1 year (OR: 4.8), and synchronous metastasis (OR: 3.52) (all, p < 0.05).
Conclusion: We identified several significant predictors of unexpectedly good and poor response to first-line targeted
therapy among patients with mRCC.
Keywords: Renal cell carcinoma, Neoplasm metastasis, Prognosis, Overall survival, Progression free survival, Molecular
targeted therapy
* Correspondence:
1
Department of Urology, Center for Prostate Cancer, Hospital of National
Cancer Center National Cancer Center, Goyang, Korea
3
Center for Prostate Cancer, National Cancer Center, 323 Ilsan-ro,
Ilsandong-gu, Goyang-si, Gyeonggi-do 410-769, Republic of Korea
Full list of author information is available at the end of the article
© 2016 The Author(s). Open Access This article is distributed under the terms of the Creative Commons Attribution 4.0
International License ( which permits unrestricted use, distribution, and
reproduction in any medium, provided you give appropriate credit to the original author(s) and the source, provide a link to
the Creative Commons license, and indicate if changes were made. The Creative Commons Public Domain Dedication waiver
( applies to the data made available in this article, unless otherwise stated.
Kim et al. BMC Cancer (2016) 16:577
Background
Research regarding the molecular biology of renal cell carcinoma (RCC) and the subsequent introduction of targeted therapeutic agents (TTs) have resulted in improved
treatment guidelines for metastatic RCC (mRCC), and significantly improved progression-free survival (PFS) and
overall survival (OS) [1, 2]. However, the appropriate treatment for mRCC in each case remains unclear, as the tumor’s heterogeneity can affect the clinical outcomes after
TT treatment, and it is difficult to accurately predict individual patients’ prognoses. Therefore, it remains challenging to optimize therapeutic outcomes using personalized
therapy.
Diverse criteria are used to stratify patients’ prognoses,
evaluate therapeutic responses, and determine patients’ eligibility for TTs, and these criteria are used to help predict
the patients’ PFS and OS after TT treatment [3, 4]. Among
the various evaluation tools and prognostic models, the
RECIST criteria [5] are the best known and most commonly used evaluation tools for radiologically stratifying patients with solid tumors who received TT treatment, based
on the responses of their primary tumor and metastatic lesions [4, 6]. Furthermore, the Memorial Sloan Kettering
Cancer Center (MSKCC) [7, 8] and the International Metastatic Renal Cell Carcinoma Database Consortium (IMDC,
also named as Heng) risk criteria [9] have been used in clinical prognostic models that predict the response to TT
among patients with mRCC. However, even with these
tools, clinicians may encounter difficulties in identifying patients who might experience clinical outcomes that significantly deviate from the expected outcomes. Therefore, the
present study aimed to evaluate the clinicopathological
characteristics of patients with mRCC who experience unexpectedly prolonged or shortened PFS and OS, and to
identify significant predictors of unexpected clinical responses to first-line TTs.
Methods
This retrospective study was approved by the institutional
review board of the Research Institute and Hospital National Cancer Center (approval no. NCC2014-0155), and
the requirement for informed consent was waived. All patient data were anonymized and de-identified prior to our
analysis. All study protocols were performed in accordance with the ethical tenets of the Declaration of Helsinki.
We identified 146 patients with mRCC and an intact
contralateral kidney, who were treated using first-line
TTs without any prior systemic treatment between January 2007 and April 2015. All included patients had
complete follow-up and medical history data, and none
of the patients discontinued their first-line TT due to
Grade 3 or higher adverse events. The specific first-line
TT was selected at the discretion of the treating urologist (JC), who considered each patient’s histopathology,
Page 2 of 11
disease status, medical condition, and the wishes of the patient and their family after a comprehensive discussion regarding the anticipatory efficacy and adverse events of each
TT. Each cycle of sunitinib consisted of a daily 50-mg oral
dose over a 4-week period, which was followed by a 2-week
hiatus. Each cycle of sorafenib consisted of twice-daily 400mg oral doses for a 6-week period. Each cycle of pazopanib
consisted of a daily 800-mg oral dose over a 6-week period.
Each cycle of temsirolimus consisted of a weekly 25-mg
intravenous infusion over a 6-week period. All patients
underwent a complete evaluation after every two cycles of
TT, which included a total physical evaluation, blood tests,
and radiological examinations. The radiological examinations included contrast-enhanced computed tomography
and/or positron emission tomography–computed tomography and bone scans to evaluate treatment response,
which was based on the RECIST criteria (version 1.1) [5].
Treatment was continued until disease progression was
identified.
The 146 patients were grouped according to their PFS
and OS, and the cut-offs were selected based on previously published representative findings that included a
PFS of 4–18.8 months and an OS of 11.9–33.1 months
[1, 2, 10–12]. Therefore, to stratify patients as having experienced unexpectedly prolonged or shortened OS and
PFS, we categorized the patients using PFS cut-offs of
3 months and 18 months, and OS cut-offs of 1 year and
3 years. The upper PFS cut-off value was not set to
17 months, as none of the patients exhibited a PFS of approximately 17 months during their first-line TT treatment.
Thus, the patients were grouped according to whether they
had experienced the worst survival outcomes (WG; PFS:
≤3 months, OS: <1 year), the normally expected outcomes
(EG; PFS: 3–18 months, OS: 1–3 years), or the best survival
outcomes (BG; PFS: >18 months, OS: >3 years).
Differences and associations between the baseline characteristics were examined using the chi-square test, Fisher’s
exact test, and the Kruskal-Wallis test, as appropriate. Binary logistic regression models were used to calculate the
odds ratios (ORs) and 95 % confidence intervals (CIs) for
the factors that significantly affected the BG and WG outcomes, compared to the EG outcomes. Only factors with a
p-value of <0.10 in the univariable analysis were subsequently evaluated in the multiple logistic regression analysis, using backwards stepwise selection with a significance
level of 0.10. Variables with large amounts of missing data
(>20 % of patients) were excluded from the multivariable
analysis (clinical T and N stages, and pathological T, N,
and M stages). The times to progression and death
were evaluated using Kaplan-Meier curves and the logrank test. All analyses were performed using Stata software (version 13.1; Stata Corp., College Station, TX,
USA), and differences with a p-value of <0.05 were considered statistically significant.
Kim et al. BMC Cancer (2016) 16:577
Page 3 of 11
Table 1 Clinicopathological characteristics of the worst group (n = 61, 41.8 %), expected group (n = 67, 45.9 %), and the best group
(n = 18, 12.3 %), according to their progression-free survival
Worst Group (≤3 mo)
Control Group (>3 and ≤18 mo)
Best Group (>18 mo)
p-value
Age
58.5 ± 10.9
58.0 ± 11.2
60.5 ± 11.1
0.697
Gender Male/Female
45/1 (73.8/26.2)
55/12 (82.1/37.7)
17/1 (94.4/5.6)
0.140
23.4 ± 3.1
23.2 ± 2.7
23.9 ± 2.0
Variables (N, %)
2
Body mass index (kg/m )
MSKCC criteria
0.647
<0.001
Favorable
3 (5.9)
5 (9.3)
6 (37.5)
Intermediate
30 (58.8)
42(77.8)
10 (62.5)
Poor
18 (35.3)
7 (13.0)
0
Heng criteria
0.003
Favorable
5 (8.9)
9 (15.8)
8 (47.1)
Intermediate
38 (67.9)
42 (73.7)
9 (52.9)
Poor
13 (23.2)
6 (10.5)
0
ECOG 0
54 (93.1)
59 (100)
18 (100)
4 (6.9)
0
0
Lung
48 (80.0)
57 (89.1)
14 (77.8)
0.268
Liver
15 (25.0)
9 (14.8)
1 (5.9)
0.139
Lymph node
32 (53.3)
31 (49.2)
9 (50.0)
0.918
Bone
19 (32.2)
21 (34.4)
6 (35.3)
0.968
Brain
7 (11.7)
7 (11.7)
2 (12.5)
1.000
Other metastasis
13 (22.0)
12 (19.7)
2 (11.8)
0.691
1
0.078
Metastatic site
Nephrectomy
28 (45.9)
35 (52.2)
16 (88.9)
0.004
Embolization
3 (4.9)
3 (4.5)
2 (11.1)
0.455
T1
7 (16.3)
5 (10.7)
2(16.7)
T2
4 (9.3)
11(23.4)
0
T3
22 (51.1)
15 (32.0)
3 (25.0)
T4
3 (7.0)
6(12.8)
3 (25.0)
Tx
7(16.3)
10 (21.3)
4 (33.3)
N1
9 (18.8)
9 (19.1)
4 (28.6)
0.570
synchronous metastasis
35 (59.3)
50 (75.8)
12 (66.7)
0.144
1–2
14 (34.1)
8 (36.7)
3 (25.0)
3–5
27 (65.9)
31 (63.3)
9 (75.0)
Clinical T stage
0.371
Fuhrman nuclear grade
0.767
Histology
0.701
Clear cell type
45 (77.6)
55(87.3)
11 (73.3)
Non-clear cell type
2(3.4)
1 (16)
0
Chromophobe with clear cell
2 (3.3)
3 (4.5)
1 (5.6)
Papillary with clear cell
7 (12.2)
2 (3.5)
2 (14.4)
unknown type
2 (3.4)
2 (3.2)
1(6.7)
5(8.8)
4 (6.5)
1 (6.7)
Sunitinib
43 (70.5)
45 (67.2)
13 (72.2)
Sorafenib
8(13.1)
8 (11.9)
1 (5.6)
Sarcomatoid presence
Treatment
0.895
0.877
Kim et al. BMC Cancer (2016) 16:577
Page 4 of 11
Table 1 Clinicopathological characteristics of the worst group (n = 61, 41.8 %), expected group (n = 67, 45.9 %), and the best group
(n = 18, 12.3 %), according to their progression-free survival (Continued)
Pazopanib
8 (13.1)
13(19.4)
4 (22.2)
Temsirolimus
2 (3.3)
1 (1.5)
0
RECIST response
<0.001
CR
0
2 (3.3)
5 (29.4)
PR
2 (6.5)
27 (44.3)
8 (47.1)
SD
7 (22.6)
23 (37.7)
3 (17.6)
PD
22 (71.0)
19 (14.8)
1 (5.9)
15/0 (26.3/0)
8/3(13.8/5.2)
2/1(11.8/5.9)
0.140
Anemia
43 (75.4)
28 (48.3)
5 (29.4)
<0.001
Thrombocytosis/penia
11/2(19.3/3.5)
7/2 (12.1/3.4)
0/0
0.279
Laboratory findings
Leukocytosis/Leucopenia
Neutrophilia/penia
14/0 (24.6/0)
7/1(12.1/1.7)
1/1 (5.9/5.9)
0.089
Lymphocytosis/penia
2/27 (3.5/47.4)
5/14 (8.6/24.1)
1/1 (5.9/5.9)
0.004
Hyper/hypocalcemia
3/11 (5.3/19.3)
3/3 (5.2/5.2)
0/0
0.059
Hypoalbuminemia
12 (20.3)
0
0
<0.001
LDH elevated
8 (14.0)
4 (6.9)
0
0.190
Neutrophil percent high/low
113 (19.3/5.3)
5/7 (8.6/12.1)
1/5 (5.9/29.4)
0.046
Progression-free survival (mo.)
2.7 (0.1–3.0)
9.3 (3.3–16.5)
56.6 (18.3–68.4)
<0.001
Overall survival (mo.)
6.9 (0.3–58.4)
18.6 (4.0–70.3)
68.3 (18.3–78.4)
<0.001
Results
The disease control rate, objective response rate, PFS, and
OS among all 146 patients were 70.6 %, 46.3 %, 9.3 months
(95 % CI: 7.3–11.2 months), and 16.4 months (95 % CI:
12.2–20.8 months), respectively. Seven patients (6.4 %)
achieved complete response, 15 patients (10.3 %) were still
being treated with first-line TT (i.e., stable disease or partial
response), and 105 patients (71.9 %) exhibited a
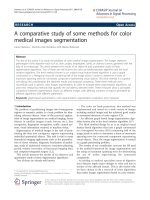
progression-free interval of <1 year. The baseline characteristics of the patients in the WG, EG, and BG are summarized in Tables 1 and 2. The median PFS for the WG (n =
61, 41.8 %), EG (n = 67, 45.9 %), and BG (n = 18, 12.3 %)
were 2.7 months (95 % CI: 2.4–2.9 months), 9.3 months
(95 % CI: 8.3–11.1 months), and 56.6 months (95 % CI:
22.4–68.4 months), respectively (Fig. 1a). The median OS
of the WG (n = 65, 45.9 %), EG (n = 52, 35.6 %), and BG (n
= 27, 18.5 %) were 5.5 months (95 % CI: 4.5–6.9 months),
21.6 months (95 % CI: 19.8–24.4 months), and 63.1 months
(95 % CI: 44.3–75.4), respectively (Fig. 1b). These survival
outcomes were significantly different (all, p < 0.001).
The correlation and parametric trend tests for PFS and
OS revealed that each group’s PFS and OS were significantly correlated (Pearson’ correlation coefficient: 0.6283,
and non-parametric trend test, p < 0.001). The correlation
percentages for the BG, EG, and WG were 50 % (n = 9,
PFS: >18 months, OS: >3 years), 49.3 % (n = 33, PFS: 3–
18 months, OS: 1–3 years), and 72.1 % (n = 44, PFS:
≤3 months, OS: <1 year).
When we compared the BG and EG using the complete
MSKCC risk evaluation, only nephrectomy (OR: 7.15,
95 % CI: 1.43–35.67) was a significant predictor of PFS in
the multivariate analysis (p = 0.016) (Table 3, see also
Additional file 1: Table S1). The significant predictors of
OS were MSKCC intermediate risk (OR: 0.12, 95 % CI:
0.003–0.049), MSKCC poor risk (OR: 0.04, 95 % CI: 0.01–
0.87), and a disease-free interval of <1 year (Heng, OR:
0.23, 95 % CI: 0.07–0.73) (all, p < 0.05) (Table 4, see also
Additional file 1: Table S2).
When we compared the WG (n = 105) and EG (n = 113),
the only significant predictor of PFS was anemia (MSKCC,
OR: 3.25, 95 % CI: 1.41–7.52; Heng, OR: 2.87, 95 % CI:
1.23–6.66; both, p < 0.05) (Table 5, see also Additional file 1:
Table S3). The significant predictors of OS were age
(MSKCC, OR: 1.05, 95 % CI: 1.01–1.1), anemia (MSKCC,
OR: 4.13, 95 % CI: 1.44–11.8; Heng, OR: 4.61, 95 % CI:
1.68–12.66), lymphocytopenia (MSKCC, OR: 4.76, 95 % CI:
1.25–18.17; Heng, OR: 5.26, 95 % CI: 1.44–19.14), a
disease-free interval of <1 year (MSKCC, OR: 4.8, 95 % CI:
1.1–20.9), and synchronous metastasis (MSKCC, OR: 3.52,
95 % CI: 1.07–11.61) (all, p < 0.05) (Table 6, see also
Additional file 1: Table S4).
Discussion
The shift to TTs for treating mRCC has greatly improved
the PFS of patients with mRCC. However, TTs are rarely
curative and therapeutic resistance develops after 6–11
Kim et al. BMC Cancer (2016) 16:577
Page 5 of 11
Table 2 Clinicopathological characteristics of the worst group (n = 67, 45.9 %), expected group (n = 52 35.6 %), and best group
(n = 27, 18.5 %), according to their overall survival
Variables (N, %)
Worst Group (<1 y)
Control Group (1–3 y)
Best Group (>3 y)
p-value
Age (years)
60.5 ± 10.7
57.1 ± 11.5
56.3 ± 10.3
0.136
Gender (Male/Female)
50/17 (74.6/25.4)
45/7 (86.5/13.5)
22/5 (81.5/18.5)
0.266
2
Body mass index (kg/m )
22.9 ± 2.8
23.7 ± 2.5
24.3 ± 2.9
0.096
MSKCC criteria
59 (88.1)
43 (100)
19 (73.1)
<0.001
Favorable risk
0
4 (9.3)
10 (52.6)
Intermediate risk
39 (66.1)
34 (79.1)
9 (47.4)
Poor risk
20(33.9)
5 (11.6)
0
Heng criteria
64 (95.5)
44 (84.6)
22 (81.5)
Favorable risk
2 (3.1)
9(20.5)
11 (50.0)
Intermediate risk
46 (71.9)
32 (72.7)
11 (50.0)
Poor risk
<0.001
16 (25.0)
3 (6.8)
0
ECOG 0
61(93.8)
47 (100)
23(100)
1
4 (6.2)
0
0
Lung
54 (81.8)
42(84.0
23 (88.5)
0.738
Liver
18(27.3)
6 (12.2)
1 (4.3)
0.020
0.109
Metastatic site
Lymph node
33 (49.3)
17 (36.2)
8 (33.3)
0.064
Bone
23 (34.8)
16 (34.0)
6 (25.0)
0.612
Brain
9 (13.6)
5 (10.6)
2 (8.3)
0.758
Other metastasis
18 (27.3)
5 (10.6)
4 (16.7)
0.083
Nephrectomy
Embolization
23(34.3)
4 (5.9)
32 (61.5)
1 (1.9)
24 (88.9)
3(11.1)
<0.0010.146
Clinical T stage
43 (64.2)
35 (67.3)
T1
4 (10.8)
6 (17.2)
3 (18.8)
T2
3 (8.1)
8(20.0)
7 (12.5)
T3
15 (40.5)
11 (31.5)
9 (31.3)
T4
8 (21.6)
3 (8.6)
0 (18.8)
Tx
7 (18.9)
7 (20.0)
2(18.8)
N1
13 (31.0)
6 (14.6)
5 (29.4)
0.179
0.229
Synchronous metastasis
58(87.9)
31 (60.8)
8 (30.8)
0.001
Fuhrman nuclear grade
41 (61.2)
39 (75.0)
22 (81.5)
0.460
1–2
13 (31.7)
12 (30.8)
10 (45.5)
3–5
28 (68.3)
27 (69.2)
12 (54.5)
Histology
63 (94.0)
50 (96.2)
26 (96.3)
Clear cell type
50 (79.4)
44 (89.8)
17 (70.8)
Non-clear cell type
2 (3.2)
1 (2.0)
0
Chromophobe with clear cell
2 (3.0)
2 (3.8)
2 (7.4)
Papillary with clear cell
7 (6.5)
1 (2.3)
3 (5.1)
Unknown type
2 (3.2)
1 (2.0)
2 (8.3)
3 (4.8
1 (2.0)
2(8.3)
Sarcomatoid presence
Treatment
0.581
0.168
0.430
Sunitinib
42 (62.7)
37 (71.2)
22(81.5)
Sorafenib
9 (13.4)
6 (11.5)
2 (7.4)
Pazopanib
13 (19.4)
9 (17.3)
3 (11.1)
Kim et al. BMC Cancer (2016) 16:577
Page 6 of 11
Table 2 Clinicopathological characteristics of the worst group (n = 67, 45.9 %), expected group (n = 52 35.6 %), and best group
(n = 27, 18.5 %), according to their overall survival (Continued)
Temsirolimus
3 (4.5)
0
0
CR
0
4 (9.1)
3 (15.0)
PR
9 (20.0)
19 (43.2)
9 (45.0)
SD
11 (24.4)
14 (31.8)
8 (40.0)
PD
25 (55.6)
7 (15.9)
0
RECIST response
<0.001
Laboratory findings
Leukocytosis/Leucopenia
19/1 (28.4/1.6)
4/2 (8.9/4.4)
2/1(7.4/3.7)
0.030
Anemia
51 (76.4)
17 (37.8)
8 (29.6)
<0.001
Thrombocytosis/penia
14/2(20.9/3.0)
4/2 (8.9/4.4)
0/0
0.041
Neutrophilia/penia
18/0 (26.9/0)
2/1 (4.4/2.2)
2/1(7.4/3.7)
0.002
Lymphocytosis/penia
1/37 (1.5/55.2)
4/4 (8.9/8.9)
3/1 (11.1/3.7)
<0.001
Hyper/hypocalcemia
5/11 (7.4/16.4)
1/2 (2.2/4.4)
0/1 (0/3.7)
0.077
Hypoalbuminemia
12(17.9)
0
0
0.002
LDH elevated
10 (14.9)
2(4.4)
0
0.051
Neutrophil percent high/low
16/1 (23.9/1.5)
0/8(0/17.8)
1/6 (3.7/22.2)
<0.001
PFS (mo.)
2.7 (1–9.3)
9.5 (1–28.3)
12.2 (1–68.4)
<0.001
OS (mo.)
5.5 (0.3–11.6)
21.6 (12.1–35.7)
63.1 (36.6–88.4)
<0.001
months of first-line TT treatment, which eventually leads
to disease progression within 4–18.8 months; thus, only a
few studies have reported significant improvements in OS
[1, 2, 10, 11]. However, the absence of any significant improvements in OS are mainly related to the confounding effects of crossover to active treatment from the placebo/
comparator arm. [13] Nevertheless, TT resistance and disease control are addressed via sequential therapy using various combinations of TTs, which provide a general OS of
11.9–33.1 months, and an OS of 9.0–10.9 months for patients with poor-risk features [9, 10, 12, 14, 15].
In the present study, we used PFS cut-off values of
3 months and 18 months, and OS cut-off values of 1 year
and 3 years, in order to identify the patients that experienced unexpectedly prolonged or shortened survival outcomes [1, 2, 10, 12]. The cut-off for unexpectedly prolonged
PFS was selected based on a review of sorafenib and sunitinib by Porta et al. [13], and a study by Buchler et al. that reported a PFS of 17.7 months among patients who received
sunitinib followed by sorafenib (n = 138), and 18.8 months
among patients who received sorafenib followed by sunitinib (n = 122) [16]. Another review article [12] reported that
a study of sorafenib from the Nexavar Charity Patient Aid
Program provided a PFS of 17.6 months with a 95 % disease
control rate. The OS cut-off was supported by data from
the SWITCH study, which reported an OS of 31.5 months
for the sorafenib-sunitinib group and an OS of 30.2 months
for the sunitinib-sorafenib group [17]. Furthermore, Tomita
et al. reported that their first-line TT group (n = 25, a
median of six 6-week cycles) achieved an OS of 33.1 months,
and their pretreated group (n = 26; 9.5 cycles of TT)
achieved an OS of 32.5 months [12]. Therefore, we compared the correlations between PFS and OS in each group,
and found that these outcomes were well correlated. Interestingly, the WG exhibited the greatest correlation between
PFS and OS (72.1 % of patients), while the BG and EG only
exhibited correlations for 50 % of their patients.
In the present study, the overall disease control rate
(70.6 %), objective response rate (46.3 %), and median PFS
(9.3 months, 95 % CI: 7.3–11.2 months) were similar to
those of other previously published series (69–79 %,
24–32 %, and PFS: 5.5–11.1 months for first-line sunitinib [11, 18], sorafenib [11, 19, 20], and pazopanib [21],
respectively). In contrast, the median OS (16.4 months,
95 % CI: 12.2–20.8 months) was shorter than those in previous TT trials (22.9–26.4 months) [10, 12, 13]. This discrepancy may be related to the fact that the previous
studies generally included patients who had undergone
nephrectomy and exhibited clear cell histology, while the
present study included relatively small proportions of patients who had undergone nephrectomy (54.1 %), exhibited sarcomatoid histology (6.8 %), exhibited non-clear cell
histology (18.4 %), or had poor- or unknown-risk features
(30.0–34.2 %) according to the MSKCC and Heng criteria.
Our multivariate analyses revealed that nephrectomy
(MSKCC, HR: 7.15) was the only significant predictor of
PFS in the BG, and that anemia (MSKCC, HR: 3.25; Heng,
HR: 2.87) was the only significant predictor of PFS in the
Kim et al. BMC Cancer (2016) 16:577
Page 7 of 11
Fig. 1 The Kaplan-Meier curves for (a) progression-free survival (PFS) and (b) overall survival (OS) among the control group and the groups with
the worst and best responses to first-line targeted therapy
Table 3 Predictive factors for progression-free survival after comparing the expected group and the group with the best response
to therapy
Univariate
Multivariate
MSKCC risk patients
Variables
OR
P-value
95 % CI
Heng Intermediate risk group
0.25
0.019
0.08–0.8
Poor
0.09
0.111
0.01–1.76
Nx
7.31
0.012
1.56–34.33
HR
7.15
P-value
0.016
Heng risk patients
95 % CI
1.43–35.67
HR
P-value
95 % CI
0.32
0.083
0.09–1.16
0.25
0.414
0.01–7.0
3.90
0.076
0.87–17.56
Kim et al. BMC Cancer (2016) 16:577
Page 8 of 11
Table 4 Predictive factors for overall survival after comparing the expected group and the group with the best response to therapy
Univariate
Multivariate
MSKCC risk patients
Heng risk patients
Variables
OR
P-value
95 % CI
HR
P-value
95 % CI
MSKCC Intermediate
0.12
0.001
0.03–0.44
0.12
0.003
0.03–0.49
Poor
0.04
0.040
0.01–0.86
0.04
0.041
0.01–0.87
DFI < 1 year
0.22
0.003
0.08–176.29
WG (all, p < 0.05). In this context, several retrospective
studies have reported that nephrectomy provides benefits
for PFS and OS in mRCC by reducing the tumor burden,
although there is debate regarding whether this benefit is
observed for all patients with mRCC. Thus, the results from
two ongoing prospective randomized phase 3 studies may
provide definitive data regarding nephrectomy’s efficacy in
mRCC that is treated using presurgical or postsurgical TT
[22–24]. Nevertheless, the prognostic benefit of nephrectomy during the TT era has generally been positive, as it
likely removes a large proportion of the tumor burden and
facilitates better responses to TT. In the present study, we
found that nephrectomy provided a benefit in 47.6 % of BG
patients with favorable-risk features, although this benefit
was not significant in the multivariate analysis. In addition,
anemia indicated a poor general condition that resembled
paraneoplastic syndrome in mRCC, although anemia is
known to be a marker for poor inflammatory and immunerelated outcomes [8, 9, 25]. Furthermore, the Heng (or
IMDC) prognostic model and the MSKCC model include
anemia as a poor prognostic factor in their criteria for both
PFS and OS [26].
The present study also revealed several significant negative prognostic markers for OS. In the WG, older age (HR:
1.05), decreased hemoglobin (HR: 4.13), lymphocytopenia
(HR: 4.76), synchronous metastatic state (HR: 3.52), and a
disease-free interval of <1 year were significantly associated
with a reduced OS. In the BG, a disease-free interval of
<1 year (HR: 0.23), the MSKCC intermediate-risk group
(HR: 0.12), and the MSKCC poor-risk group (HR 0.004)
were associated with a prolonged OS (all, p < 0.05). Previous studies have reported that age is an important prognostic factor for localized RCC, as patients who exhibited late
HR
P-value
95 % CI
0.23
0.013
0.07–0.73
relapse and survival of >5 years beyond expectations were
significantly younger, compared to patients who experience
early relapse (3 months to 5 years after nephrectomy [27].
Furthermore, patients with RCC who are <40 years old
generally have less aggressive tumor features and better
survival outcomes [27–29]. Therefore, several studies have
suggested that follow-up protocols for younger patients
with RCC should be adjusted to include a longer follow-up,
as these patients generally experience later relapse [27–29].
Similar to anemia, lymphocytopenia was associated with
shortened OS in the present study. In this context, lymphocytes play key roles in tumor suppression, which include inducing cytotoxic cell death and the production of
cytokines in cancer cells. Therefore, lymphocytopenia may
indicate an impaired antitumor response, and explain the
poor prognosis for patients with mRCC [30, 31]. However,
the calcium was not significant prognostic factor in any
comparisions among BG, WG vs. CG (Tables 3, 4 and 5).
The reason for insignificant prognostic role of hypercalcemia like other Heng and MSKCC prognostic models was
estimated by the small numbers of hypercalcemia in this
study (4.1 %) similar to that of our previously publishing
papers (9.4 %) with sunitinib study [32] that the hypercalcemia was not significant either.
In previous studies of various malignancies (including
mRCC), the presence of synchronous or metachronous
metastasis (based on the time between the diagnoses of
the primary and secondary tumor) was a negative prognostic factor for OS. For example, Kwack et al. demonstrated that the time to metastasis and the number of
metastases were important prognostic factors for mRCC
during the immunotherapy era [29]. Furthermore, the
International Metastatic Renal Cell Carcinoma Database
Table 5 Predictive factors for progression-free survival after comparing the expected group and the group with the worst response
to therapy
Univariate
Multivariate
MSKCC risk patients
Heng risk patients
Variables
OR
P-value
95 % CI
HR
P-value
95 % CI
HR
P-value
95 % CI
Hemoglobin low
3.29
0.003
1.49–7.27
3.25
0.006
1.41–7.52
2.87
0.014
1.23–6.66
Platelet high
1.75
0.288
0.62–4.91
low
1.11
0.916
0.15–8.24
Lymphocyte high
0.56
0.503
0.1–3.08
0.26
0.242
0.03–2.47
Low
2.69
0.016
1.2–6.02
2.05
0.098
0.88–4.78
Kim et al. BMC Cancer (2016) 16:577
Page 9 of 11
Table 6 Predictive factors for overall survival after comparing the expected group and the group with the worst response to therapy
Univariate
Multivariate
MSKCC risk patients
Heng risk patients
Variables
OR
P-value
95 % CI
HR
P-value
95 % CI
Age
1.03
0.099
0.99–1.06
1.05
0.045
1.01–1.10
Hemoglobin low
6.46
0.000
2.74–15.22
4.13
0.008
Lymphocyte high
0.36
0.368
0.04–15.22
0.22
0.215
Low
13.16
0.000
4.18–9.34
4.76
DFI < 1 year
3.81
0.007
1.43–10.15
4.80
synchronous metastasis
4.68
0.001
1.85–11.84
3.52
Consortium also demonstrated that an increased metastatic
tumor burden at the initial therapy was associated with
worst OS among all patients with mRCC, and that bone
and liver metastases were more frequent in the groups with
poor-risk features [26]. Although we did not observe significant differences in the baseline metastatic bone or liver lesions between the three groups, bone and liver metastases
were more common in the WG (liver: 26.9 %, bone:
38.6 %), compared to the EG (liver: 12.2 %, bone: 34.0 %)
and the BG (liver: 4.5 %, bone: 23.7 %) (all, p > 0.05).
This study included several limitations that warrant consideration. First, the retrospective design and small sample
size are prone to well-known biases, and larger prospective
studies should be performed to validate our findings. Second, we did not perform any histological analyses, and additional analysis of RCC specimens from patients in the BG
and WG might have provided histopathological data regarding prognostic biomarkers. Lastly, other existing clinical, political, and economic confounding factors influenced
on the prognosis of mRCC during 8-year period of followup were not dealt in this study. The improving care system
in nutritional, pain, and symptomatic therapeutic fields;
introduction of new various curative and palliative strategies such as radiotherapy and metastatectomy, and widening coverage of insurance system on mRCC were the most
affecting factors on improvement of prognoses in mRCC,
which should be discussed in future studies. Nevertheless,
our study identified several factors that were associated
with unexpectedly prolonged or shortened survival outcomes after first-line TT treatment, by comparing the BG
and WG to the EG. Our findings may provide clinicians
with objective markers to identify candidates that are most
and least likely to benefit from TTs. Furthermore, our findings may be useful for developing additional prognostic
models or helping previous models to potentiate their accuracy of prognostic predictability and therapeutic plans
that accurately predict patients’ clinical outcomes in the TT
era. For example, the nephrectomy, the presence of synchronous metastasis, age, and lymphocyte level might be
also helpful in the MSKCC, Heng model to potentiate its
predictability in mRCC treated with first line TT. This
HR
P-value
95 % CI
1.44–11.8
4.61
0.003
1.68–12.66
0.02–2.42
0.18
0.160
0.02–1.95
0.022
1.25–18.17
5.26
0.012
1.44–19.14
0.036
1.10–20.9
0.039
1.07–11.61
3.17
0.057
0.97–10.41
study comprised of 46 % patients who had not received
nephrectomy, whereas previous Heng criteria comprised of
almost all nephrectomized patients that some discrepancies
existed when evaluating the non-nephrectomized patients’
prognoses. Therefore, some additionally useful information
of non-nephrectomized patients’ prognoses would be obtained in this study.
Conclusion
The present study identified several significant predictive
factors that were associated with unexpectedly prolonged and shortened survival outcomes after first-line
TT treatment in patients with mRCC. However, a larger
prospective study is needed to validate these factors.
Additional file
Additional file 1: Table S1. Predictive factors for progression-free
survival after comparing the expected group and the group with the
best response to therapy. Table S2. Predictive factors for overall survival
after comparing the expected group and the group with the best
response to therapy. Table S3. Predictive factors for progression-free
survival after comparing the expected group and the group with the
worst response to therapy. Table S4. Predictive factors for overall survival
after comparing the expected group and the group with the worst
response to therapy. (DOCX 49KB)
Abbreviations
BG, the best responsive group; CI, confidence intervals; EG, normal expected
responsive group; mRCC, metastatic renal cell carcinoma; MSKCC, Memorial
Sloan Kettering Cancer Center; OR, odds ratio; OS, overall survival; PFS,
progression-free survival; TT, target therapy; WG, the worst responsive group
Acknowledgements
Ms. Jung Eun Kim and You-na Hwang from prostate cancer department
contributed to the database management.
Funding
The authors declare that they have no financial supports on this study.
Availability of data and materials
The dataset of this study was available on the Kidney cancer database of
National Cancer Center, where the authors could freely receive the available
database to use after the approval of our IRB committee under the consideration
of the purpose of its use. The request for database was asked to the
corresponding author (Dr. Jinsoo Chung, ).
Kim et al. BMC Cancer (2016) 16:577
Authors’ contributions
SK, JJ carried out the statistical analysis in this study. HKS, JC, KHL, and JYJ
carried the collecting samples and their data. JC, and SHK conceived of the
study, and participated in its design and coordination and helped to draft
the manuscript. All authors read and approved the final manuscript.
Competing interests
The authors declare that they have no competing interests.
Consent for publication
Not applicable.
The institutional review board of the Research Institute and Hospital National
Cancer Center also waived the requirement of written consent from
participants in this study. All the data were anonymized and de-identified
abdout the participants prior to the analysis.
Page 10 of 11
12.
13.
14.
15.
Ethical approval and consent to participate
This retrospective study was approved by the institutional review board of
the Research Institute and Hospital National Cancer Center (approval no.
NCC2014-0155), and the requirement for informed consent to participate in
this study was waived due to its retrospective design. All patient data were
anonymized and de-identified prior to the analysis. All study protocols were
performed in accordance with the ethical tenets of the Declaration of Helsinki.
16.
Author details
1
Department of Urology, Center for Prostate Cancer, Hospital of National
Cancer Center National Cancer Center, Goyang, Korea. 2Biometric Research
Branch, Clinical Research Coordination Center, Hospital of National Cancer
Center National Cancer Center, Goyang, Korea. 3Center for Prostate Cancer,
National Cancer Center, 323 Ilsan-ro, Ilsandong-gu, Goyang-si, Gyeonggi-do
410-769, Republic of Korea.
18.
17.
19.
Received: 19 January 2016 Accepted: 25 July 2016
20.
References
1. Choudhury AD, Eeles R, Freedland SJ, Isaacs WB, Pomerantz MM, Schalken
JA, Tammela TL, Visakorpi T. The role of genetic markers in the
management of prostate cancer. Eur Urol. 2012;62(4):577–87.
2. Pecuchet N, Fournier LS, Oudard S. New insights into the management of
renal cell cancer. Oncology. 2013;84(1):22–31.
3. Heng DY, Xie W, Regan MM, Harshman LC, Bjarnason GA, Vaishampayan
UN, Mackenzie M, Wood L, Donskov F, Tan MH, et al. External validation and
comparison with other models of the International Metastatic Renal-Cell
Carcinoma Database Consortium prognostic model: a population-based
study. Lancet Oncol. 2013;14(2):141–8.
4. Julka PK, Doval DC, Gupta S, Rath GK. Response assessment in solid
tumours: a comparison of WHO, SWOG and RECIST guidelines. Br J
Radiol. 2008;81(966):444–9.
5. Eisenhauer EA, Therasse P, Bogaerts J, Schwartz LH, Sargent D, Ford R, Dancey J,
Arbuck S, Gwyther S, Mooney M, et al. New response evaluation criteria in solid
tumours: revised RECIST guideline (version 1.1). Eur J Cancer. 2009;45(2):228–47.
6. Leon L, Garcia-Figueiras R, Suarez C, Arjonilla A, Puente J, Vargas B, Mendez
Vidal MJ, Sebastia C. Recommendations for the clinical and radiological
evaluation of response to treatment in metastatic renal cell cancer. Target
Oncol. 2014;9(1):9–24.
7. Motzer RJ, Bacik J, Murphy BA, Russo P, Mazumdar M. Interferon-alfa as a
comparative treatment for clinical trials of new therapies against advanced
renal cell carcinoma. J Clin Oncol Off J Am Soc Clin Oncol. 2002;20(1):289–96.
8. Motzer RJ, Bacik J, Schwartz LH, Reuter V, Russo P, Marion S, Mazumdar M.
Prognostic factors for survival in previously treated patients with metastatic
renal cell carcinoma. J Clin Oncol Off J Am Soc Clin Oncol. 2004;22(3):454–63.
9. Heng DY, Xie W, Regan MM, Warren MA, Golshayan AR, Sahi C, Eigl BJ,
Ruether JD, Cheng T, North S, et al. Prognostic factors for overall survival in
patients with metastatic renal cell carcinoma treated with vascular
endothelial growth factor-targeted agents: results from a large, multicenter
study. J Clin Oncol Off J Am Soc Clin Oncol. 2009;27(34):5794–9.
10. Cho IC, Chung J. Current status of targeted therapy for advanced renal cell
carcinoma. Korean J Urology. 2012;53(4):217–28.
11. Park SJ, Lee JL, Park I, Park K, Ahn Y, Ahn JH, Lee DH, Ahn S, Song C, Hong
JH, et al. Comparative efficacy of sunitinib versus sorafenib as first-line
21.
22.
23.
24.
25.
26.
27.
28.
treatment for patients with metastatic renal cell carcinoma. Chemotherapy.
2012;58(6):468–74.
Ye D, Eto M, Chung JS, Kimura G, Chang WC, Chang YH, Pang ST, Lee JL,
Niu Y, Gurney H, et al. Use of targeted therapies for advanced renal cell
carcinoma in the Asia-Pacific region: opinion statement from China, Japan,
Taiwan, Korea, and Australia. Clin Genitourin Cancer. 2014;12(4):225–33.
Porta C, Tortora G, Linassier C, Papazisis K, Awada A, Berthold D, Maroto JP,
Powles T, De Santis M. Maximising the duration of disease control in
metastatic renal cell carcinoma with targeted agents: an expert agreement.
Med Oncol. 2012;29(3):1896–907.
Choueiri TK, Rini B, Garcia JA, Baz RC, Abou-Jawde RM, Thakkar SG, Elson P,
Mekhail TM, Zhou M, Bukowski RM. Prognostic factors associated with longterm survival in previously untreated metastatic renal cell carcinoma. Annals
Oncol. 2007;18(2):249–55.
De Lichtenberg TH, Hermann GG, Rorth M, Hojer Larsen MJ, Mansourvar Z,
Holm ML, Scheike T. Overall survival after immunotherapy, tyrosine kinase
inhibitors and surgery in treatment of metastatic renal cell cancer: outcome
of 143 consecutive patients from a single centre. Scand J Urol Nephrol.
2014;48(4):379–86.
Buchler T, Klapka R, Melichar B, Brabec P, Dusek L, Vyzula R, Abrahamova J.
Sunitinib followed by sorafenib or vice versa for metastatic renal cell
carcinoma–data from the Czech registry. Annals Oncol. 2012;23(2):395–401.
Eichelberg C, Vervenne WL, De Santis M, Fischer Von Weikersthal L, Goebell
PJ, Lerchenmuller C, Zimmermann U, Bos MM, Freier W, Schirrmacher-Memmel
S, et al. SWITCH: A Randomised, Sequential, Open-label Study to Evaluate the
Efficacy and Safety of Sorafenib-sunitinib Versus Sunitinib-sorafenib in the
Treatment of Metastatic Renal Cell Cancer. Eur Urol. 2015;68(5):837–47.
Motzer RJ, Hutson TE, Tomczak P, Michaelson MD, Bukowski RM, Oudard S,
Negrier S, Szczylik C, Pili R, Bjarnason GA, et al. Overall survival and updated
results for sunitinib compared with interferon alfa in patients with metastatic
renal cell carcinoma. J Clin Oncol Off J Am Soc Clin Oncol. 2009;27(22):3584–90.
Escudier B, Eisen T, Stadler WM, Szczylik C, Oudard S, Siebels M, Negrier S,
Chevreau C, Solska E, Desai AA, et al. Sorafenib in advanced clear-cell renalcell carcinoma. N Engl J Med. 2007;356(2):125–34.
Escudier B, Szczylik C, Hutson TE, Demkow T, Staehler M, Rolland F, Negrier
S, Laferriere N, Scheuring UJ, Cella D, et al. Randomized phase II trial of
first-line treatment with sorafenib versus interferon Alfa-2a in patients with
metastatic renal cell carcinoma. J Clin Oncol Off J Am Soc Clin Oncol. 2009;
27(8):1280–9.
Sternberg CN, Hawkins RE, Wagstaff J, Salman P, Mardiak J, Barrios CH, Zarba JJ,
Gladkov OA, Lee E, Szczylik C, et al. A randomised, double-blind phase III study
of pazopanib in patients with advanced and/or metastatic renal cell carcinoma:
final overall survival results and safety update. Eur J Cancer. 2013;49(6):1287–96.
Mathieu R, Pignot G, Ingles A, Crepel M, Bigot P, Bernhard JC, Joly F, Guy L,
Ravaud A, Azzouzi AR, et al. Nephrectomy improves overall survival in
patients with metastatic renal cell carcinoma in cases of favorable MSKCC or
ECOG prognostic features. Urol Oncol. 2015;33(8):339. e339-339 e315.
Shinohara N, Abe T. Prognostic factors and risk classifications for patients
with metastatic renal cell carcinoma. Int J Urol. 2015;22(10):888–97.
Procopio G, Testa I, Verzoni E, Iacovelli R, Grassi P, Galli G, De Braud F,
Saravia D, Salvioni R. Time from nephrectomy as a prognostic factor in
metastatic renal cell carcinoma patients receiving targeted therapies: overall
results from a large cohort of patients. Oncology. 2015;88(3):133–8.
Santoni M, Buti S, Conti A, Porta C, Procopio G, Sternberg CN, Bracarda S,
Basso U, De Giorgi U, Rizzo M, et al. Prognostic significance of host immune
status in patients with late relapsing renal cell carcinoma treated with
targeted therapy. Target Oncol. 2015;10(4):517–22.
Ueda T, Uemura H, Tomita Y, Tsukamoto T, Kanayama H, Shinohara N,
Tarazi J, Chen C, Kim S, Ozono S, et al. Efficacy and safety of axitinib versus
sorafenib in metastatic renal cell carcinoma: subgroup analysis of Japanese
patients from the global randomized Phase 3 AXIS trial. Jpn J Clin Oncol.
2013;43(6):616–28.
Hutson TE, Escudier B, Esteban E, Bjarnason GA, Lim HY, Pittman KB, Senico
P, Niethammer A, Lu DR, Hariharan S, et al. Randomized phase III trial of
temsirolimus versus sorafenib as second-line therapy after sunitinib in
patients with metastatic renal cell carcinoma. J Clin Oncol Off J Am
Soc Clin Oncol. 2014;32(8):760–7.
Kroeger N, Choueiri TK, Lee JL, Bjarnason GA, Knox JJ, MacKenzie MJ, Wood
L, Srinivas S, Vaishamayan UN, Rha SY, et al. Survival outcome and treatment
response of patients with late relapse from renal cell carcinoma in the era
of targeted therapy. Eur Urol. 2014;65(6):1086–92.
Kim et al. BMC Cancer (2016) 16:577
Page 11 of 11
29. Kwak C, Park YH, Jeong CW, Jeong H, Lee SE, Ku JH. Characteristics of
metastasis as a prognostic factor for immunotherapy in metastatic renal cell
carcinoma. Tumori. 2007;93(1):68–74.
30. Keizman D, Ish-Shalom M, Huang P, Eisenberger MA, Pili R, Hammers H,
Carducci MA. The association of pre-treatment neutrophil to lymphocyte
ratio with response rate, progression free survival and overall survival of
patients treated with sunitinib for metastatic renal cell carcinoma. Eur J
Cancer. 2012;48(2):202–8.
31. Santoni M, De Giorgi U, Iacovelli R, Conti A, Burattini L, Rossi L, Luca Burgio S,
Berardi R, Muzzonigro G, Cortesi E, et al. Pre-treatment neutrophil-to-lymphocyte
ratio may be associated with the outcome in patients treated with everolimus
for metastatic renal cell carcinoma. Br J Cancer. 2013;109(7):1755–9.
32. Kwon WA, Cho IC, Yu A, Nam BH, Joung JY, Seo HK, Lee KH, Chung J.
Validation of the MSKCC and Heng risk criteria models for predicting
survival in patients with metastatic renal cell carcinoma treated with
sunitinib. Ann Surg Oncol. 2013;20(13):4397–40.
Submit your next manuscript to BioMed Central
and we will help you at every step:
• We accept pre-submission inquiries
• Our selector tool helps you to find the most relevant journal
• We provide round the clock customer support
• Convenient online submission
• Thorough peer review
• Inclusion in PubMed and all major indexing services
• Maximum visibility for your research
Submit your manuscript at
www.biomedcentral.com/submit