The pretreatment Controlling Nutritional Status (CONUT) score is an independent prognostic factor in patients with resectable thoracic esophageal squamous cell carcinoma: Results from a
Bạn đang xem bản rút gọn của tài liệu. Xem và tải ngay bản đầy đủ của tài liệu tại đây (709.88 KB, 11 trang )
Toyokawa et al. BMC Cancer (2016) 16:722
DOI 10.1186/s12885-016-2696-0
RESEARCH ARTICLE
Open Access
The pretreatment Controlling Nutritional
Status (CONUT) score is an independent
prognostic factor in patients with
resectable thoracic esophageal squamous
cell carcinoma: results from a retrospective
study
Takahiro Toyokawa1* , Naoshi Kubo2, Tatsuro Tamura1, Katsunobu Sakurai2, Ryosuke Amano1, Hiroaki Tanaka1,
Kazuya Muguruma1, Masakazu Yashiro1, Kosei Hirakawa1 and Masaichi Ohira1
Abstract
Background: The purpose of this study was to investigate the impact of the Controlling Nutritional Status (CONUT)
score on survival compared with the platelet to lymphocyte ratio (PLR), the neutrophil to lymphocyte ratio (NLR),
and the Glasgow Prognostic Score (GPS) in patients with resectable thoracic esophageal squamous cell carcinoma
(ESCC).
Methods: One hundred eighty-five consecutive patients who underwent subtotal esophagectomy with curative
intent for resectable thoracic ESCC were retrospectively reviewed. Time-dependent receiver operating characteristic
curve analyses for 3-year overall survival (OS) as the endpoint were performed, and the maximal Youden indices were
calculated to assess discrimination ability and to determine the appropriate cut-off values of CONUT, PLR, and NLR.
The patients were then classified into high and low groups based on these cut-off values. Correlations between
CONUT and other clinicopathological characteristics were analyzed. Prognostic factors predicting overall survival (OS)
and relapse-free survival (RFS) were analyzed using Cox proportional hazards models.
Results: The areas under the curve predicting 3-year OS were 0.603 for CONUT, 0.561 for PLR, 0.564 for NLR, and 0.563
for GPS. The optimal cut-off values were two for the CONUT score, 193 for PLR, and 3.612 for NLR. The high-CONUT
group was significantly associated with lower BMI, high-PLR, high-NLR, and GPS1/2 groups. On univariate analysis,
high-CONUT, high-PLR, high-NLR, and GPS 1/2 groups were significantly associated with poorer OS and RFS. Of
these factors, multivariate analysis revealed that only the CONUT score was an independent prognostic factor for
OS (HR 2.303, 95 % CI 1.191–4.455; p = 0.013) and RFS (HR 2.163, 95 % CI 1.139–4.109; p = 0.018).
Conclusions: The CONUT score was an independent predictor of OS and RFS before treatment and was superior
to PLR, NLR, and GPS in terms of predictive ability for prognosis in patients with resectable thoracic ESCC.
Keywords: Esophageal cancer, Esophagectomy, Prognostic factor, Nutrition, Controlling nutritional status
(Continued on next page)
* Correspondence:
1
Department of Surgical Oncology, Osaka City University Graduate School of
Medicine, 1-4-3 Asahimachi, Abeno-ku, Osaka 545-8585, Japan
Full list of author information is available at the end of the article
© 2016 The Author(s). Open Access This article is distributed under the terms of the Creative Commons Attribution 4.0
International License ( which permits unrestricted use, distribution, and
reproduction in any medium, provided you give appropriate credit to the original author(s) and the source, provide a link to
the Creative Commons license, and indicate if changes were made. The Creative Commons Public Domain Dedication waiver
( applies to the data made available in this article, unless otherwise stated.
Toyokawa et al. BMC Cancer (2016) 16:722
Page 2 of 11
(Continued from previous page)
Abbreviations: ASA, American Society of Anesthesiology score; AUC, Areas under the curve; BMI, Body mass
index; CI, Confidence interval; CONUT, Controlling nutritional status; ESCC, Esophageal squamous cell carcinoma;
GPS, Glasgow prognostic score; HR, Hazard ratio; IQR, Interquartile range; NLR, Neutrophil to lymphocyte ratio;
OS, Overall survival; PLR, Platelet to lymphocyte ratio; PS, Eastern cooperative oncology group performance status;
RFS, Relapse-free survival; ROC, Receiver operating characteristic; SCCA, Serum squamous cell carcinoma antigen
Background
Despite significant improvements in the diagnosis and
treatment of patients with esophageal cancer, their prognosis still remains poor due to its aggressive biological behavior [1]. Although surgical resection is the mainstay of
treatment for local and locoregional disease in esophageal
cancer, neoadjuvant treatment has been widely accepted
as a means of improving the prognosis of esophageal cancer [2–5]. Therefore, predicting prognosis using pretreatment clinical variables, but not operative and pathological
variables, is important to improve the prognosis and to
offer an optimal treatment strategy.
There is accumulating evidence that the presence of a
systemic inflammatory response and malnutrition are associated with a worse prognosis in various malignancies
[6–9]. Recently, several inflammation-based markers,
such as the platelet to lymphocyte ratio (PLR), the neutrophil to lymphocyte ratio (NLR), and the Glasgow
Prognostic Score (GPS), have been reported to be prognostic factors in various malignancies, including esophageal cancer [10–15]. The Controlling Nutritional Status
(CONUT) score, which is calculated by the serum albumin concentration, the total peripheral lymphocyte count,
and the total cholesterol concentration, was developed as
a screening tool for early detection of poor nutritional status [16]. Use of the CONUT score has some advantages,
such as simplicity and cost effectiveness, but there have
been few reports on the relationship between the CONUT
score and clinical outcomes in malignancies [17]. Therefore, the significance of the CONUT score in the treatment of esophageal cancer is still unknown.
The aim of this study was to elucidate the impact of
the pretreatment CONUT score on survival compared
with other inflammation-based markers (PLR, NLR, and
GPS) in patients with resectable thoracic esophageal
squamous cell carcinoma (ESCC).
Methods
The clinical data of consecutive patients who underwent
subtotal esophagectomy with curative intent for resectable thoracic ESCC at Osaka City University Hospital
(Osaka, Japan) between January 2000 and December
2014 were retrospectively reviewed. In this study, resectable thoracic ESCC was defined as patients without cT4
tumor and distant metastases on pretreatment examination. All patients were diagnosed with ESCC by biopsy
before initial treatment. For reliable analysis, only thoracic ESCC patients who underwent two- or three-field
lymphadenectomy and reconstruction using a gastric
tube through the posterior mediastinum by cervical anastomosis were included. There was no uniform guideline
for preoperative treatment until 2009; from 2009, neoadjuvant chemotherapy consisting of 5-fluorouracil/cisplatin
or 5-fluorouracil/nedaplatin was administered for patients
with clinical stage II/III in principle. Adjuvant chemotherapy was scheduled for patients with positive lymph node
metastasis. Eight patients whose entire set of preoperative
laboratory data was not available were excluded from this
study. Ultimately, 185 patients were included. Forty-six
patients received preoperative treatment; 39 patients
received chemotherapy, 6 patients received chemoradiotherapy, and 1 patient received radiotherapy. This retrospective study was approved by the ethics committee at
our institution and was conducted in accordance with the
principles of the Declaration of Helsinki. Informed consent was obtained from all patients before treatment.
The pretreatment staging workup in principle included
physical examination, laboratory tests, esophageal barium
meal examination, upper GI endoscopy, enhanced computed tomography (CT) scans between the neck and
upper abdomen, and positron emission tomographycomputed tomography (PET-CT). On the basis of these
examinations, tumor stage was assessed using the 6th edition of the International Union Against Cancer [18]. Blood
samples were obtained during the patients’ first visit to
our institution before initial treatment. The CONUT score
was calculated as described in Table 1. The PLR was calculated by dividing the platelet count by the lymphocyte
Table 1 Scoring system for the CONUT
Parameter
Undernutrition degree
None
Light
Moderate Severe
Serum albumin (g/dL)
≥3.50
3.00–3.49
2.50–2.99 <2.50
Score
0
2
4
6
Total lymphocyte count (/mm ) ≥1600 1200–1599 800–1199 <800
3
Score
0
1
2
3
Total cholesterol (mg/dL)
≥180
140–179
100–139
<100
Score
0
1
2
3
CONUT score = Serum albumin score + Total lymphocyte count score +
Total cholesterol score
Ignacio de Ullibarri J et al. Nutr Hosp [16]
Toyokawa et al. BMC Cancer (2016) 16:722
count. The NLR was calculated by dividing the neutrophil
count by the lymphocyte count. The GPS was constructed
as follows: patients with both elevated C-reactive protein
(CRP) (>1.0 mg/dl) and low albumin (<3.5 g/dl) were
assigned GPS 2, those with elevated CRP (>1.0 mg/dl) or
low albumin (<3.5 g/dl) were assigned GPS 1, and those
with normal CRP (≤1.0 mg/dl) and normal albumin
(≥3.5 g/dl) were assigned GPS 0.
Pretreatment variables, such as age, sex, body mass
index (BMI), Eastern Cooperative Oncology Group performance status (PS), American Society of Anesthesiology
score (ASA), tumor location, clinical TNM stage, and
serum squamous cell carcinoma antigen (SCCA) levels
were evaluated.
Follow-up
The patients were followed every 3–4 months for the
initial 2 years, every 6 months for the next 3 years, and
annually thereafter. On a semiannual basis or on suspicion of recurrence, a clinical history was taken, and a
physical examination, routine blood tests, measurements
of SCCA, and enhanced CT scans between the neck and
upper abdomen were performed. PET-CT was conducted if necessary. Recurrence was diagnosed according
to the findings of these scheduled examinations. If the
patients had not visited the hospital, follow-up information was obtained from telephone calls to the patients,
family members, or their referring physicians.
Cut-off determination and primary outcomes
To set the cut-off values for CONUT, PLR, and NLR,
time-dependent receiver operating characteristic (ROC)
curve analyses for 3-year overall survival (OS) as the
endpoint were performed, and the maximal Youden indices were calculated [19]. All patients were classified
into two groups based on these cut-off values. OS and
relapse-free survival (RFS), which were the primary outcomes, were calculated from the start date of treatment
to the date of last follow-up or death and to the date of
confirmation of recurrence or death, respectively.
Statistical analysis
Fisher’s exact test or the chi-square test was used for
analyzing associations between categorical variables. Survival rates were calculated by the Kaplan-Meier method,
and survival curves were compared with the log-rank
test. Univariate analyses and multivariate analyses for
OS and RFS were conducted with Cox proportional hazards models. To compare the prognostic value of each
inflammation-based and nutritional marker, multivariate
analyses including variables with p < 0.1 on univariate
analyses and CONUT, PLR, NLR, or GPS, respectively,
were performed, because CONUT, PLR, and NLR include the lymphocyte count, and CONUT and GPS
Page 3 of 11
include the albumin levels in their calculation. The hazard ratios (HRs) and 95 % confidence intervals (CIs)
were calculated. A value of p < 0.05 was considered significant. These statistical analyses were performed with
SPSS software (SPSS, Inc., Chicago, IL, USA), except for
the time-dependent ROC curve-analyses that were performed with R-project Software, version 3.2.1.
Results
Time-dependent ROC curve-analyses
The time-dependent ROC analyses showed the areas
under the curve (AUCs) predicting 3-year OS were 0.603
for CONUT, 0.561 for PLR, 0.564 for NLR, and 0.563 for
GPS. The sensitivity and specificity of CONUT, PLR,
NLR, and GPS were 19 % and 95, 26 and 87 %, 22 % and
92 %, and 16 % and 96 %, respectively. When the CONUT
score was 2, PLR was 193, and NLR was 3.612, the Youden
indices were maximal; therefore, these values were selected as the cut-off values.
CONUT and patients’ clinicopathological characteristics
The patients’ median age was 64 (interquartile range
[IQR] 59–70) years. A total of 180 patients underwent R0
resection, 4 patients underwent R2 resection, and 1 patient underwent R1 resection. All patients with R1/2 resection were included in the low-CONUT group. The
clinicopathological characteristics of the two CONUT
groups are shown in Table 2. The high-CONUT group
was significantly associated with male sex (p = 0.046),
lower BMI (p = 0.010), high-PLR (p < 0.001), high-NLR
(p = 0.002), and higher GPS (p < 0.001).
Survival
The median follow-up period for survivors was 81.5 months
(IQR 45.8–112.3 months). Three patients were lost to
follow-up within 5 years, with the shortest follow-up period
for survivors being 13 months. Recurrence was observed in
54 cases with a median duration to recurrence of 11 months
(IQR 6.0–17.5 months). A total of 77 deaths were observed.
The 3- and 5-year OS and RFS rates for the entire
study population were 68.5 and 60.7 %, and 62.6 and
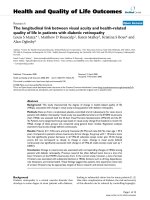
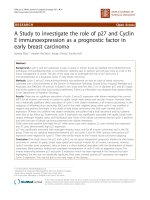
57.1 %, respectively. The Kaplan-Meier survival curves
comparing OS and RFS between two groups based on
each nutritional and inflammation-based marker are
shown in Fig. 1a-h. The OS and RFS rates were significantly lower in the high-CONUT (p < 0.001, p = 0.002),
high-PLR (p = 0.023, p = 0.031), high-NLR (p = 0.016,
p = 0.028), and GPS 1/2 (p < 0.001, p = 0.004) groups.
Prognostic factors for OS and RFS
The results of univariate and multivariate analyses for
OS and RFS are summarized in Tables 3 and 4. For the
univariate analyses, the same factors, sex, PS, ASA, clinical TNM stage, CONUT score, PLR, NLR, and GPS,
Toyokawa et al. BMC Cancer (2016) 16:722
Page 4 of 11
Table 2 Relationships between clinical characteristics and the CONUT
Variables
Total (n = 185)
High-CONUT (n = 17)
Low-CONUT (n = 168)
n
%
n
%
n
%
< 65
95
51.4
9
52.9
86
51.2
≥ 65
90
48.6
8
47.1
82
48.8
Male
152
82.2
17
100
135
80.4
Female
33
17.8
0
0
33
19.6
< 21.0
95
51.4
14
82.4
81
48.2
≥ 21.0
90
48.6
3
17.6
87
51.8
0
173
93.5
15
88.2
158
94.0
1/2
12
6.5
2
11.8
10
6.0
1
34
18.4
2
11.8
32
19.0
2
140
75.7
14
82.4
126
75.0
3
11
5.9
1
5.9
10
6.0
Upper
27
14.6
3
17.6
24
14.3
Middle
106
57.3
8
47.1
98
58.3
Lower
52
28.1
6
35.3
46
27.4
cT1
73
39.5
4
23.5
69
41.1
cT2
44
23.8
5
29.4
39
23.2
cT3
68
36.8
8
47.1
60
35.7
Negative
128
69.2
10
58.8
118
70.2
Positive
57
30.8
7
41.2
50
29.8
I
67
36.2
4
23.5
63
37.5
II
78
42.2
7
41.2
71
42.3
III/IV
40
21.6
6
35.3
34
20.2
<2.0
148
80
12
70.6
136
81.0
≥2.0
37
20
5
29.4
32
19.0
High (>193)
32
17.3
10
58.8
22
13.1
Low (≤193)
153
82.7
7
41.2
146
86.9
High (>3.612)
22
11.9
6
35.3
16
9.5
Low (≤3.612)
163
88.1
11
64.7
152
90.5
p value
Age (years)
0.891
Sex
0.046*
BMI
0.010*
PS
0.304*
ASA score
0.757
Location
0.668
cT stage
0.369
cN stage
0.331
Clinical TNM stage
0.293
SCCA (ng/ml)
0.309
PLR
<0.001
NLR
0.002
Toyokawa et al. BMC Cancer (2016) 16:722
Page 5 of 11
Table 2 Relationships between clinical characteristics and the CONUT (Continued)
GPS
0
171
92.4
12
70.6
159
94.6
1
13
7.0
4
23.5
9
5.4
2
1
0.5
1
5.9
0
0
<0.001
Components of the CONUT score
Albumin score
0
183
98.9
15
88.2
168
100
2/4
2
1.1
2
11.8
0
0
0
125
67.6
0
0
125
74.4
1
39
21.1
4
23.5
35
20.8
2/3
21
11.4
13
76.5
8
4.8
0
113
61.1
2
11.8
111
66.1
1
58
31.4
9
52.9
49
29.2
2/3
14
7.6
6
35.3
8
4.8
0.008*
TLC score
<0.001
TC score
<0.001
CONUT Controlling Nutritional Status, BMI body mass index, PS performance status
ASA American Society of Anesthesiology, TNM tumor-node-metastasis, SCCA squamous
cell carcinoma antigen, PLR platelet to lymphocyte ratio, NLR neutrophil to lymphocyte ratio
GPS Glasgow Prognostic Score, TLC total lymphocyte count, TC total cholesterol
*Fisher’s exact test
were significantly associated with OS and RFS. On
multivariate analyses for OS and RFS using variables
with p < 0.1 on univariate analyses and CONUT, PLR,
NLR, GPS, or components of the CONUT score (serum
albumin score, total lymphocyte count score, total cholesterol score), respectively, among the inflammationbased and nutritional markers, only the CONUT score
was an independent predictive factor for OS (HR 2.303,
95 % CI 1.191–4.455; p = 0.013) and RFS (HR 2.163,
95 % CI 1.139–4.109; p–0.018).
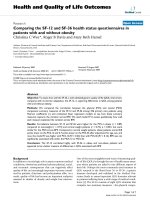
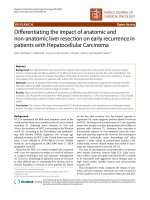
Subgroup analysis
A subgroup analysis according to the presence of preoperative treatment was conducted. In patients with or
without preoperative treatment, the Kaplan-Meier survival
curves comparing OS and RFS based on the CONUT
score are shown in Fig. 2a-d. The OS and RFS rates were
significantly lower in the high-CONUT group in patients
with preoperative treatment (p = 0.008, p = 0.010) and
in patients without preoperative treatment (p = 0.002,
p = 0.009).
Cause of death
Causes of death according to the CONUT score are
shown in Table 5. The proportion of patients who died
of primary disease was significantly higher in the highCONUT group than in the low-CONUT group (47.1 %
vs. 20.8 %, p = 0.015), whereas there were no significant
differences in the rates of patients who died of other disease, other cancer, and postoperative complications.
Discussion
In the present study, the prognostic impacts of the
CONUT score, PLR, NLR, and GPS were evaluated and
compared in 185 patients with resectable thoracic
ESCC. We found that only the CONUT score was an
independent prognostic factor for OS and RFS, and it
was superior to other inflammation-based markers in
terms of predictive ability for prognosis before initial
treatment.
The CONUT score was developed to assess nutritional
status more easily and more objectively, having been validated in comparison with two other classical but slightly
complicated assessment tools: the Subjective Global Assessment and the Full Nutritional Assessment [16]. The
CONUT score is composed of the serum albumin concentration, total peripheral lymphocyte count, and total cholesterol concentration. The serum albumin concentration
is known as a reliable indicator of nutritional status and
systemic inflammation [20]. Total peripheral lymphocytes,
which play an important role in the immune response to
the tumor, are known to indicate the immunological and
nutritional status. Total cholesterol concentration is
known as an indicator of a patient’s caloric reserves [21].
Thus, a higher CONUT score could reflect not only malnutrition, but also systemic inflammation and an impaired
Toyokawa et al. BMC Cancer (2016) 16:722
B
1.0
p<0.001
0.8
Low-CONUT (n=168)
0.6
0.4
High-CONUT (n=17)
0.2
Relapse free survival
Overall survival
A
Page 6 of 11
0.0
1.0
0.8
Low-CONUT (n=168)
0.6
0.4
High-CONUT (n=17)
0.2
0.0
0
20
40
60
80
100
120
0
Survival time (months)
C
20
1.0
Low-PLR (n=153)
0.6
0.4
High-PLR (n=32)
0.2
Relapse free survival
p=0.023
0.8
0.0
p=0.031
0.8
Low-PLR (n=153)
0.6
0.4
High-PLR(n=32)
0.2
20
40
60
80
100
0
120
20
Survival time (months)
p=0.016
0.8
Low-NLR (n=163)
0.6
0.4
0.2
High-NLR (n=22)
Relapse free survival
Overall survival
F
1.0
60
80
100
120
1.0
p=0.028
0.8
Low-NLR (n=163)
0.6
0.4
High-NLR (n=22)
0.2
0.0
0
20
40
60
80
100
Survival time (months)
120
0
H
1.0
p<0.001
0.8
GPS 0 (n=171)
0.6
0.4
GPS 1/2 (n=14)
0.2
0.0
Relapse free survival
Overall survival
40
Survival time (months)
0.0
G
120
0.0
0
E
40
60
80
100
Survival time (months)
D
1.0
Overall survival
p=0.002
20
40
60
80
100
Survival time (months)
1.0
120
p=0.004
0.8
GPS 0 (n=171)
0.6
0.4
0.2
GPS 1/2 (n=14)
0.0
0
20
40
60
80
100
Survival time (months)
120
0
20
40
60
80
100
Survival time (months)
120
Fig. 1 Kaplan-Meier survival curves of overall survival (OS) and relapse-free survival (RFS) in patients with resectable thoracic ESCC. a The 3- and
5-year OS rates are 72.0 % and 63.6 % in the low-CONUT group and 35.3 and 35.3 % in the high-CONUT group. b The 3- and 5-year RFS rates are
65.3 and 59.5 % in the low-CONUT group and 35.3 and 35.3 % in the high-CONUT group. c The 3- and 5-year OS rates are 72.1 and 62.6 % in the
low-PLR group and 52.1 and 52.1 % in the high-PLR group. d The 3- and 5-year RFS rates are 65.4 and 59.5 % in the low-PLR group and 49.3 and
45.5 % in the high-PLR group. e The 3- and 5-year OS rates are 72.1 and 63.3 % in the low-NLR group and 43.5 and 43.5 % in the high-NLR group.
f The 3- and 5-year RFS rates are 65.0 and 59.6 % in the low-NLR group and 44.6 and 39.0 % in the high-NLR group. g The 3- and 5-year OS rates
are 71.4 and 63.9 % in the GPS 0 group and 32.7 and 16.3 % in the GPS 1/2 group. h The 3- and 5-year RFS rates are 64.8 and 59.8 % in the GPS
0 group and 34.3 and 17.1 % in the GPS 1/2 group
immune response. Indeed, the high-CONUT group was
significantly associated with lower BMI, high-PLR, highNLR, and GPS1/2.
Recently, Hirahara et al. [22] first reported that the
CONUT score was an independent predictor of cancer-
specific survival in patients who underwent curative
thoracoscopic esophagectomy for esophageal cancer.
They also demonstrated that a high CONUT score was
significantly associated with high NLR, and NLR was
shown not to be a significant prognostic factor,
Toyokawa et al. BMC Cancer (2016) 16:722
Page 7 of 11
Table 3 Univariate and multivariate analyses of prognostic
factors for OS of patients with resectable thoracic ESCC
Variable
5-year
OS (%)
Total
60.7
Age (years)
< 65
68.5
≥ 65
52.1
Sex
Univariate
Multivariate
p value
HR (95 % CI)
p value
0.089
1.214 (0.753–1.956)
0.427
Table 3 Univariate and multivariate analyses of prognostic
factors for OS of patients with resectable thoracic ESCC
(Continued)
Components of the CONUT score
Albumin score
0
61.4
2/4
0
TLC score
0.004
0.276 (0.107–0.711)
0.008
0/1
62.6
47.6
Male
56.0
2/3
Female
83.3
TC score
BMI
0.479
<21.0
67.3
≥21.0
54.2
PS
<0.001
0
64.6
1/2
8.3
ASA
4.223 (2.155–8.274)
<0.001
<0.001
<0.001
1
81.2
1.000
2
59.6
1.184 (0.554–2.528)
0.663
3
10.9
5.856 (2.102–16.310)
0.001
Location
0.941
Upper
58.6
Middle
60.7
Lower
62.3
cTNM stage
0.001
0.015
I
75.4
1.000
II
57.5
1.515 (0.850–2.698)
0.159
III/IV
40.4
2.485 (1.338–4.615)
0.004
<0.001
2.303 (1.191–4.455)
0.013
0.025
1.213 (0.696–2.115)
0.496
0.018
1.194 (0.627–2.273)
0.589
0.001
1.021 (0.465–2.245)
0.958
SCCA (ng/ml)
0.139
<2.0
61.2
≥2.0
59.6
CONUT score
High (≥3)
35.3
Low (≤2)
63.6
PLR
High (>193)
52.1
Low (≤193)
62.6
NLR
High (>3.612)
43.5
Low (≤3.612)
63.3
GPS
0
63.9
1/2
16.3
0/1
62.4
2/3
40.8
0.012
1.096 (0.479–2.511)
0.828
0.074
1.061 (0.518–2.171)
0.872
0.015
1.481 (0.688–3.190)
0.316
BMI body mass index, PS performance status, ASA American Society of
Anesthesiology, TNM tumor-node-metastasis, SCCA squamous cell carcinoma
antigen, CONUT Controlling Nutritional Status, PLR platelet to lymphocyte ratio,
NLR neutrophil to lymphocyte ratio, GPS Glasgow Prognostic Score, TLC total
lymphocyte count, TC total cholesterol
The results of multivariate analyses of age, sex, PS, ASA, cTNM stage in this
table are the results of analyses with CONUT score
HRs and p values of PLR, NLR, GPS, Albumin score, TLC score, and TC score in
this table are the results of respective multivariate analyses using variables
with p < 0.1 on univariate analyses and each factor
consistent with the present results. The present study
advances this previous study by determining the cut-off
value using statistical methods, showing that the
CONUT score is an independent prognostic factor for
both OS and RFS and by comparing it with several
inflammation-based markers.
The difference between the CONUT score and other
inflammation-based markers is that the CONUT score
includes the total cholesterol concentration in its calculation. Cholesterol is an essential component of the cell
membrane that is involved in numerous biochemical
pathways potentially correlated with cancer initiation
and progression and the immune response. Several epidemiological studies and case control studies have demonstrated that a lower serum total cholesterol level was
associated with increased mortality from several cancers
[23–29]. Similarly, in the present study, a lower serum
total cholesterol level was significantly associated with
poorer survival. However, it remains uncertain whether
hypocholesterolemia is a result of tumor progression or
induces tumor progression. As a potential hypothesis to
explain the relationship between hypocholesterolemia and
cancer, a lowered serum cholesterol is attributed to the increased consumption of cholesterol needed for growth in
cancer cells, which may indicate higher activity and malignancy of the tumor [25, 30]. This hypothesis could be supported by the fact that serum cholesterol levels increase
after curative surgery and then decrease with cancer recurrence [31]. On the other hand, Calleros et al. [32] demonstrated that chronic cholesterol depletion induces NFkB
activation, which could promote proliferation of malignant
Toyokawa et al. BMC Cancer (2016) 16:722
Page 8 of 11
Table 4 Univariate and multivariate analyses of prognostic
factors for RFS of patients with resectable thoracic ESCC
Variable
5-year
RFS (%)
Total
57.1
Age (years)
Univariate
Multivariate
p value
HR (95 % CI)
p value
63.2
≥65
50.2
Sex
Components of the CONUT score
Albumin score
0.194
< 65
Table 4 Univariate and multivariate analyses of prognostic
factors for RFS of patients with resectable thoracic ESCC
(Continued)
0
57.7
2/4
0
TLC score
0.014
0.458 (0.214–0.982)
0.045
0/1
59.1
42.9
Male
53.1
2/3
Female
75.1
TC score
BMI
0.394
<21.0
62.6
≥21.0
51.4
PS
<0.001
0
60.7
1/2
8.3
ASA
4.029 (2.041–7.956)
0.005
<0.001
0.010
1
73.2
1.000
2
56.2
1.117 (0.572–2.181)
0.746
3
10.9
3.600 (1.372–9.443)
0.009
Location
0.803
Upper
57.5
Middle
58.0
Lower
55.0
cTNM stage
<0.001
0.011
I
73.1
1.000
II
52.5
1.731 (1.006–2.979)
0.048
III/IV
37.4
SCCA (ng/ml)
<2.0
59.0
≥2.0
49.8
CONUT score
High (≥3)
35.3
Low (≤2)
59.5
PLR
High (>193)
45.5
Low (≤193)
59.5
NLR
High (>3.612)
39.0
Low (≤3.612)
59.6
GPS
0
59.8
1/2
17.1
2.515 (1.361–4.646)
0.003
0.051
1.226 (0.717–2.097)
0.456
0.003
2.163 (1.139–4.109)
0.018
0.033
1.129 (0.656–1.943)
0.662
0.030
1.094 (0.569–2.102)
0.788
0.006
0.955 (0.439–2.078)
0.908
0/1
58.4
2/3
41.7
0.012
1.334 (0.608–2.928)
0.472
0.069
1.113 (0.551–2.250)
0.765
0.050
1.287 (0.604–2.743)
0.513
BMI body mass index, PS performance status, ASA American Society of
Anesthesiology, TNM tumor-node-metastasis, SCCA squamous cell carcinoma
antigen, CONUT Controlling Nutritional Status, PLR platelet to lymphocyte ratio,
NLR neutrophil to lymphocyte ratio, GPS Glasgow Prognostic Score, TLC total
lymphocyte count, TC total cholesterol
The results of multivariate analyses of sex, PS, ASA, cTNM stage, SCCA in this
table are the results of analyses with CONUT score
HRs and p values of PLR, NLR, GPS, Albumin score, TLC score, and TC score in
this table are the results of respective multivariate analyses using variables
with p < 0.1 on univariate analyses and each factor
tumor cells. Muldoon et al. [33] reported that hypocholesterolemia was significantly more associated with fewer circulating lymphocytes, total T cells, and CD8+ cells than
hypercholesterolemia. It was also reported that cholesterol
increases the antigen-presenting function of monocytes
[34]. Thus, a low serum total cholesterol level may contribute to a poorer prognosis by affecting intracellular signaling and impairing the immune system against tumor
spread. Inclusion of the serum total cholesterol level in its
calculation may be one of the reasons why the CONUT
score is able to predict patients with a poorer prognosis
more sensitively than other inflammation-based markers.
As in other malignancies, several studies have shown
that PLR, NLR, and GPS were independent prognostic
factors in esophageal cancer [11, 35]. In contrast, several
studies did not show PLR and NLR to be independent
prognostic factors [36–38]. In the present study, although PLR, NLR, and GPS were found to be predictive
factors for OS and RFS on univariate analyses, multivariate analysis did not show these markers to be independent prognostic factors. These discrepancies may be due
to the differences in sample size, follow-up periods, and
cut-off values, which vary by method of determination
and the population. Because the method to determine
the optimal cut-off value has still not been fully established, various cut-off values have been used in previous
studies [11, 14, 39]. In this study, the cut-off values to
predict survival were determined from the maximal
Youden indices based on the results of time-dependent
ROC curve analyses [19, 40]. The present methodological approach seems to have advantages in terms of
Toyokawa et al. BMC Cancer (2016) 16:722
A
Page 9 of 11
B
1.0
p=0.008
p=0.010
0.8
0.6
Relapse free survival
0.8
Overall survival
1.0
Low-CONUT (n=43)
0.4
0.2
0.6
Low-CONUT (n=43)
0.4
0.2
High-CONUT (n=3)
High-CONUT (n=3)
0.0
0.0
0
20
40
60
80
100
120
0
20
Survival time (months)
C
40
60
80
D
1.0
Low-CONUT (n=125)
High-CONUT (n=14)
0.2
0.0
0.8
Relapse free survival
Overall survival
p=0.009
0.6
0.4
120
1.0
p=0.002
0.8
100
Survival time (months)
Low-CONUT (n=125)
0.6
0.4
High-CONUT (n=14)
0.2
0.0
0
20
40
60
80
100
120
Survival time (months)
0
20
40
60
80
100
120
Survival time (months)
Fig. 2 Kaplan-Meier survival curves of overall survival (OS) and relapse-free survival (RFS) according to the CONUT score in patients with preoperative
treatment (a OS, p = 0.008; b RFS, p = 0.010) and in patients without preoperative treatment (c OS, p = 0.002; d RFS, p = 0.009)
objectivity, but its validity has not been evaluated. Further studies are needed to establish the best method to
determine cut-off values. The present study focused on
resectable esophageal cancer patients who may have less
systemic inflammation and better nutritional status than
those with T4 and metastatic disease. Therefore, the proportions of high PLR and high NLR patients were lower
than in previous reports [11, 41]. It might be important
to identify an optimal cut-off value based on similar
populations, such as tumor stage.
It is noteworthy that the CONUT score calculated before initial treatment was an independent prognostic factor, contributing to making an individual treatment
strategy. Although the effects of perioperative nutritional
intervention on the long-term outcome in patients with
Table 5 Cause of death
Total
Low-CONUT
(n = 168)
High-CONUT
(n = 17)
65 (38.7 %)
12 (70.6 %)
p value
Primary disease
35 (20.8 %)
8 (47.1 %)
0.015
Other disease
21 (12.5 %)
2 (11.8 %)
1.000*
Other cancer
7 (4.2 %)
1 (5.9 %)
0.545*
Postoperative complications
2 (1.2 %)
1 (5.9 %)
0.252*
*Fisher’s exact test
malnutrition due to malignant disease have not been
confirmed, numerous studies have reported that perioperative nutritional intervention improved tolerance for
anticancer treatment and reduced postoperative complications, which may contribute to improving the prognosis [42–44]. However, the definition and assessment of
malnutrition in previous studies have not been unified.
The CONUT score may be used as an index for selection of patients who need nutritional intervention and
for evaluation of nutritional management in esophageal
cancer treatment.
In the present study, the high-CONUT group was
significantly associated with primary cancer death
and poorer RFS. Similarly, Iseki et al. [17] and Hirahara et al. [22] reported that a higher CONUT score
was an independent predictive factor for cancerspecific survival in colorectal cancer and esophageal
cancer, respectively. These findings suggest that
poorer nutritional status identified by the CONUT
score may be involved in poorer tolerability for anticancer treatment and the growth of micrometastatic
and residual cancer cells, which results in a worse
prognosis. Patients with a high CONUT score may
be candidates for not only nutritional intervention,
but also more intensive multimodal treatment in resectable ESCC.
Toyokawa et al. BMC Cancer (2016) 16:722
The present study has some limitations. First, this was
a retrospective study conducted at a single institution,
and the number of cases was limited. Second, potential
factors that affect inflammation-based and nutritional
markers, such as comorbidities and medications, could
not be excluded. Third, there was heterogeneity in the
neoadjuvant and adjuvant treatments in this study. However, in the subgroup analysis with or without neoadjuvant
treatment, the high-CONUT group had significantly
worse OS and RFS in both subgroups. Within these limitations, the present study demonstrated that the CONUT
score is a promising prognostic factor with a better predictive value than PLR, NLR, and GPS in patients with resectable thoracic ESCC. Large-scale prospective validation
studies are needed to confirm these findings.
Conclusion
The CONUT score was found to be an independent predictor of OS and RFS before treatment, and it was superior to PLR, NLR, and GPS in terms of predicting
prognosis in patients with resectable thoracic ESCC. The
estimation of the CONUT score is inexpensive and easily
available from laboratory data in daily clinical practice.
We suggest that the CONUT score should be calculated
routinely before initial treatment, and it could be a useful indicator for pretreatment nutritional management in
esophageal cancer.
Acknowledgements
The authors declare no conflict of interest.
Availability of data and materials
The datasets during and/or analyzed during the current study available from
the corresponding author on reasonable request.
Authors’ contributions
TT1 analyzed and drafted the manuscript. NK, TT2, KS, HT and KM participated
data collection and assisted with data interpretation. NK, RA, MY, KH and MO
reviewed and revised the manuscript. All authors read and approved the final
manuscript.
Competing interests
The authors declare that they have no competing interests.
Consent for publication
Not applicable.
Ethics approval and consent to participate
This retrospective study was approved by the ethics committee of Osaka
City University (no. 3158) and was conducted in accordance with the
principles of the Declaration of Helsinki. Informed consent was obtained
from all patients before treatment.
Author details
1
Department of Surgical Oncology, Osaka City University Graduate School of
Medicine, 1-4-3 Asahimachi, Abeno-ku, Osaka 545-8585, Japan. 2Department
of Gastroenterological Surgery, Osaka City General Hospital, 2-13-22,
Miyakojimahondohri, Miyakojima-ku, Osaka 534-0021, Japan.
Received: 10 June 2016 Accepted: 7 August 2016
Page 10 of 11
References
1. Pennathur A, Gibson MK, Jobe BA, Luketich JD. Oesophageal carcinoma.
Lancet. 2013;381(9864):400–12.
2. Sjoquist KM, Burmeister BH, Smithers BM, et al. Survival after neoadjuvant
chemotherapy or chemoradiotherapy for resectable oesophageal
carcinoma: an updated meta-analysis. Lancet Oncol. 2011;12(7):681–92.
3. Ando N, Kato H, Igaki H, et al. A randomized trial comparing
postoperative adjuvant chemotherapy with cisplatin and 5-fluorouracil
versus preoperative chemotherapy for localized advanced squamous
cell carcinoma of the thoracic esophagus (JCOG9907). Ann Surg Oncol.
2012;19(1):68–74.
4. van Hagen P, Hulshof MC, van Lanschot JJ, et al. Preoperative
chemoradiotherapy for esophageal or junctional cancer. N Engl J Med.
2012;366(22):2074–84.
5. Gronnier C, Trechot B, Duhamel A, et al. Impact of neoadjuvant
chemoradiotherapy on postoperative outcomes after esophageal cancer
resection: results of a European multicenter study. Ann Surg. 2014;260(5):764–71.
6. Jiang X, Hiki N, Nunobe S, et al. Prognostic importance of the inflammationbased Glasgow prognostic score in patients with gastric cancer. Br J Cancer.
2012;107(2):275–9.
7. Guthrie GJ, Charles KA, Roxburgh CS, Horgan PG, McMillan DC, Clarke SJ.
The systemic inflammation-based neutrophil-lymphocyte ratio: experience
in patients with cancer. Crit Rev Oncol Hematol. 2013;88(1):218–30.
8. Schutte K, Tippelt B, Schulz C, et al. Malnutrition is a prognostic factor in
patients with hepatocellular carcinoma (HCC). Clin Nutr. 2015;34(6):1122–7.
9. Galizia G, Lieto E, Zamboli A, et al. Neutrophil to lymphocyte ratio is a
strong predictor of tumor recurrence in early colon cancers: A propensity
score-matched analysis. Surgery. 2015;158(1):112–20.
10. Kobayashi T, Teruya M, Kishiki T, et al. Inflammation-based prognostic score, prior
to neoadjuvant chemoradiotherapy, predicts postoperative outcome in patients
with esophageal squamous cell carcinoma. Surgery. 2008;144(5):729–35.
11. Sharaiha RZ, Halazun KJ, Mirza F, et al. Elevated preoperative neutrophil:
lymphocyte ratio as a predictor of postoperative disease recurrence in
esophageal cancer. Ann Surg Oncol. 2011;18(12):3362–9.
12. Vashist YK, Loos J, Dedow J, et al. Glasgow Prognostic Score is a predictor
of perioperative and long-term outcome in patients with only surgically
treated esophageal cancer. Ann Surg Oncol. 2011;18(4):1130–8.
13. Choi WJ, Cleghorn MC, Jiang H, Jackson TD, Okrainec A, Quereshy FA.
Preoperative Neutrophil-to-Lymphocyte Ratio is a Better Prognostic Serum
Biomarker than Platelet-to-Lymphocyte Ratio in Patients Undergoing
Resection for Nonmetastatic Colorectal Cancer. Ann Surg Oncol. 2015;22
Suppl 3:603–13.
14. Yodying H, Matsuda A, Miyashita M, et al. Prognostic Significance of
Neutrophil-to-Lymphocyte Ratio and Platelet-to-Lymphocyte Ratio in
Oncologic Outcomes of Esophageal Cancer: A Systematic Review and Metaanalysis. Ann Surg Oncol. 2016;23(2):646–54.
15. Sakurai K, Ohira M, Tamura T, et al. Predictive Potential of Preoperative
Nutritional Status in Long-Term Outcome Projections for Patients with
Gastric Cancer. Ann Surg Oncol. 2016;23(2):525–33.
16. Ignacio de Ulibarri J, Gonzalez-Madrono A, de Villar NG, et al. CONUT: a tool
for controlling nutritional status. First validation in a hospital population.
Nutr Hosp. 2005;20(1):38–45.
17. Iseki Y, Shibutani M, Maeda K, et al. Impact of the Preoperative Controlling
Nutritional Status (CONUT) Score on the Survival after Curative Surgery for
Colorectal Cancer. PLoS One. 2015;10(7), e0132488.
18. Sobin L, Wittekind C. TNM Classification of malignant tumours, International
Union Against Cancer 6th edition (UICC). New York: Wiley-liss; 2002.
19. Perkins NJ, Schisterman EF. The inconsistency of “optimal” cutpoints
obtained using two criteria based on the receiver operating characteristic
curve. Am J Epidemiol. 2006;163(7):670–5.
20. McMillan DC, Elahi MM, Sattar N, Angerson WJ, Johnstone J, McArdle CS.
Measurement of the systemic inflammatory response predicts cancerspecific and non-cancer survival in patients with cancer. Nutr Cancer. 2001;
41(1–2):64–9.
21. Gadgil MD, Anderson CA, Kandula NR, Kanaya AM. Dietary patterns are
associated with metabolic risk factors in South Asians living in the United
States. J Nutr. 2015;145(6):1211–7.
22. Hirahara N, Matsubara T, Hayashi H, Takai K, Nakada S, Tajima Y. Prognostic
Importance of Controlling Nutritional Status in Patients Undergoing
Curative Thoracoscopic Esophagectomy for Esophageal Cancer. Am J Ther.
2016. doi:10.1097/MJT.0000000000000414.
Toyokawa et al. BMC Cancer (2016) 16:722
23. Windler E, Ewers-Grabow U, Thiery J, Walli A, Seidel D, Greten H. The
prognostic value of hypocholesterolemia in hospitalized patients. Clin
Investig. 1994;72(12):939–43.
24. Iribarren C, Reed DM, Chen R, Yano K, Dwyer JH. Low serum cholesterol and
mortality. Which is the cause and which is the effect? Circulation. 1995;92(9):
2396–403.
25. Cengiz O, Kocer B, Surmeli S, Santicky MJ, Soran A. Are pretreatment serum
albumin and cholesterol levels prognostic tools in patients with colorectal
carcinoma? Med Sci Monit. 2006;12(6):Cr240-7.
26. Strasak AM, Pfeiffer RM, Brant LJ, et al. Time-dependent association of total
serum cholesterol and cancer incidence in a cohort of 172,210 men and
women: a prospective 19-year follow-up study. Ann Oncol. 2009;20(6):1113–20.
27. Sok M, Ravnik J, Ravnik M. Preoperative total serum cholesterol as a
prognostic factor for survival in patients with resectable non-small-cell lung
cancer. Wien Klin Wochenschr. 2009;121(9–10):314–7.
28. Kitahara CM, Berrington de Gonzalez A, Freedman ND, et al. Total cholesterol
and cancer risk in a large prospective study in Korea. J Clin Oncol. 2011;29(12):
1592–8.
29. Ko K, Park YH, Lee JW, Ku JH, Kwak C, Kim HH. Influence of nutritional
deficiency on prognosis of renal cell carcinoma (RCC). BJU Int. 2013;112(6):
775–80.
30. Tomiki Y, Suda S, Tanaka M, et al. Reduced low-density-lipoprotein cholesterol
causing low serum cholesterol levels in gastrointestinal cancer: a case control
study. J Exp Clin Cancer Res. 2004;23(2):233–40.
31. Niendorf A, Nagele H, Gerding D, Meyer-Pannwitt U, Gebhardt A. Increased
LDL receptor mRNA expression in colon cancer is correlated with a rise in
plasma cholesterol levels after curative surgery. Int J Cancer. 1995;61(4):
461–4.
32. Calleros L, Lasa M, Toro MJ, Chiloeches A. Low cell cholesterol levels
increase NFkappaB activity through a p38 MAPK-dependent mechanism.
Cell Signal. 2006;18(12):2292–301.
33. Muldoon MF, Marsland A, Flory JD, Rabin BS, Whiteside TL, Manuck SB.
Immune system differences in men with hypo- or hypercholesterolemia.
Clin Immunol Immunopathol. 1997;84(2):145–9.
34. Hughes DA, Townsend PJ, Haslam PL. Enhancement of the antigenpresenting function of monocytes by cholesterol: possible relevance to
inflammatory mechanisms in extrinsic allergic alveolitis and atherosclerosis.
Clin Exp Immunol. 1992;87(2):279–86.
35. Duan H, Zhang X, Wang FX, et al. Prognostic role of neutrophil-lymphocyte
ratio in operable esophageal squamous cell carcinoma. World J Gastroenterol.
2015;21(18):5591–7.
36. Rashid F, Waraich N, Bhatti I, et al. A pre-operative elevated neutrophil:
lymphocyte ratio does not predict survival from oesophageal cancer
resection. World J Surg Oncol. 2010;8:1. doi:10.1186/1477-7819-8-1.
37. Dutta S, Crumley AB, Fullarton GM, Horgan PG, McMillan DC. Comparison of
the prognostic value of tumour- and patient-related factors in patients
undergoing potentially curative resection of oesophageal cancer. World J
Surg. 2011;35(8):1861–6.
38. Hirahara N, Matsubara T, Hayashi H, Takai K, Fujii Y, Tajima Y. Impact of
inflammation-based prognostic score on survival after curative
thoracoscopic esophagectomy for esophageal cancer. Eur J Surg Oncol.
2015;41(10):1308–15.
39. Feng JF, Huang Y, Chen QX. Preoperative platelet lymphocyte ratio (PLR) is
superior to neutrophil lymphocyte ratio (NLR) as a predictive factor in
patients with esophageal squamous cell carcinoma. World J Surg Oncol.
2014;12:58. doi:10.1186/1477-7819-12-58.
40. Heagerty PJ, Lumley T, Pepe MS. Time-dependent ROC curves for censored
survival data and a diagnostic marker. Biometrics. 2000;56(2):337–44.
41. Feng JF, Chen QX. Significance of the prognostic nutritional index in
patients with esophageal squamous cell carcinoma. Ther Clin Risk Manag.
2014;10:1–7. doi:10.2147/TCRM.S56159.
42. Paccagnella A, Morassutti I, Rosti G. Nutritional intervention for improving
treatment tolerance in cancer patients. Curr Opin Oncol. 2011;23(4):322–30.
43. Aida T, Furukawa K, Suzuki D, et al. Preoperative immunonutrition decreases
postoperative complications by modulating prostaglandin E2 production
and T-cell differentiation in patients undergoing pancreatoduodenectomy.
Surgery. 2014;155(1):124–33.
44. Kubota K, Kuroda J, Yoshida M, Okada A, Deguchi T, Kitajima M.
Preoperative oral supplementation support in patients with esophageal
cancer. J Nutr Health Aging. 2014;18(4):437–40.
Page 11 of 11
Submit your next manuscript to BioMed Central
and we will help you at every step:
• We accept pre-submission inquiries
• Our selector tool helps you to find the most relevant journal
• We provide round the clock customer support
• Convenient online submission
• Thorough peer review
• Inclusion in PubMed and all major indexing services
• Maximum visibility for your research
Submit your manuscript at
www.biomedcentral.com/submit